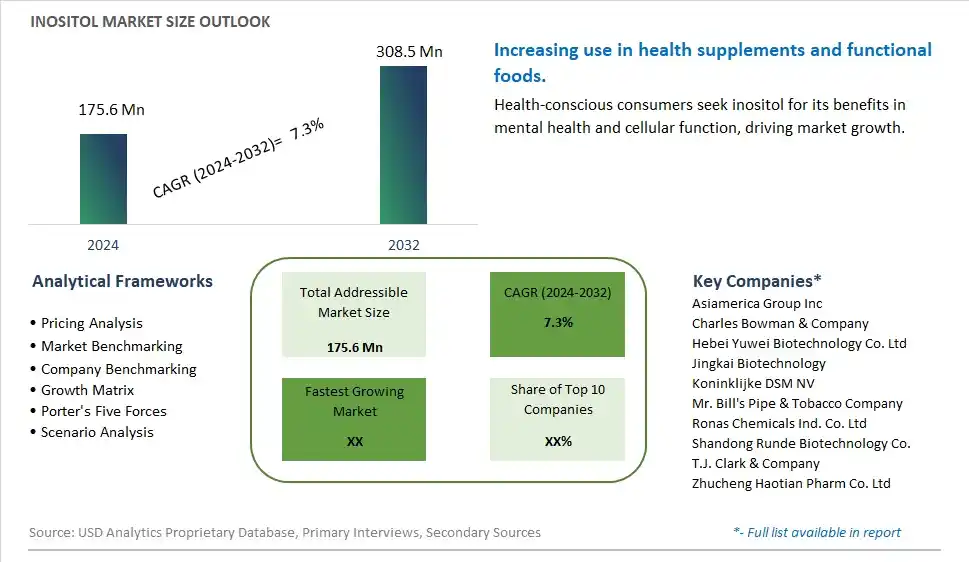
Global Inositol Market Size is valued at $175.6 Million in 2024 and is forecast to register a growth rate (CAGR) of 7.3% to reach $308.5 Million by 2032.
The global Inositol Market Comprehensive Study analyzes and forecasts the market size across 6 regions and 24 countries for diverse segments -By Source (Plant-based, Synthetic), By Application (Dietary Supplement, Beverage, Feed Industry, Pharmaceutical Industry, Others)
An Introduction to Inositol Market
In 2024, the inositol market is thriving, fueled by the demand for functional ingredients that support cognitive health, metabolic function, and overall wellness. Inositol, a type of sugar alcohol found in plants and animals, is used in dietary supplements, functional foods, and pharmaceuticals. The market benefits from advancements in extraction and synthesis technologies that enhance the purity and efficacy of inositol. The trend towards clean label and natural ingredients is influencing product development. Increasing consumer awareness of mental health and metabolic health, supported by the popularity of functional supplements, is further propelling market growth.
Inositol Competitive Landscape
The market report analyses the leading companies in the industry including Asiamerica Group Inc, Charles Bowman & Company, Hebei Yuwei Biotechnology Co. Ltd, Jingkai Biotechnology, Koninklijke DSM NV, Mr. Bill's Pipe & Tobacco Company, Ronas Chemicals Ind. Co. Ltd, Shandong Runde Biotechnology Co., T.J. Clark & Company, Zhucheng Haotian Pharm Co. Ltd, and Others.
Inositol Market Dynamics
Inositol Market Trend: Increasing Use in Dietary Supplements and Functional Foods
The most prominent trend in the Inositol Market is the increasing use in dietary supplements and functional foods. Inositol, known for its role in cellular function and mental health, is gaining popularity as a supplement ingredient. This trend is driven by the demand for health products that support cognitive function, metabolic health, and overall wellness.
Inositol Market Driver: Health Consciousness and Demand for Mental Health Solutions
A key driver in the Inositol Market is health consciousness and the demand for mental health solutions. As more individuals focus on managing stress, anxiety, and mental health conditions, there is a rising demand for inositol supplements that offer natural support for brain function and emotional well-being. This demand supports market growth as consumers seek effective and holistic health solutions.
Inositol Market Opportunity: Expansion into Functional Beverages and Nutraceuticals
One significant opportunity in the Inositol Market lies in expansion into functional beverages and nutraceuticals. Companies can innovate by incorporating inositol into a variety of products, such as energy drinks, health bars, and fortified foods, offering consumers convenient and health-focused options. By highlighting the benefits and versatility of inositol, manufacturers can attract a broader consumer base and drive market growth.
Inositol Market Share Analysis- Largest Segment by Source
In the Inositol Market, the Synthetic source is the largest segment. Synthetic inositol dominates due to its cost-effectiveness and consistent quality, which makes it a preferred choice for large-scale production and application across various industries. The ability to produce synthetic inositol in bulk at a lower cost compared to plant-based sources, combined with its widespread use in dietary supplements and pharmaceuticals, contributes to its dominant market position. Additionally, the synthetic form's high purity and stability further enhance its appeal, reinforcing its leading status in the market.
Inositol Market Share Analysis- Poised to Grow Fastest Over the Next Five Years by Application
In the Inositol Market, the Dietary Supplement application segment is poised to grow the fastest over the next five years. This growth is driven by the increasing consumer awareness of the health benefits associated with inositol, such as its role in mental health and metabolic regulation. The rise in demand for natural and functional supplements, coupled with growing research supporting inositol's efficacy in treating conditions like polycystic ovary syndrome (PCOS) and mood disorders, is fueling this rapid growth. Additionally, the expanding range of inositol-based products and the increasing popularity of preventive health measures contribute to this segment's accelerated growth.
Inositol Market Segmentation
By Source
Plant-based
Synthetic
By Application
Dietary Supplement
Beverage
Feed Industry
Pharmaceutical Industry
Others
Countries Analyzed
North America (US, Canada, Mexico)
Europe (Germany, UK, France, Spain, Italy, Russia, Rest of Europe)
Asia Pacific (China, India, Japan, South Korea, Australia, South East Asia, Rest of Asia)
South America (Brazil, Argentina, Rest of South America)
Middle East and Africa (Saudi Arabia, UAE, Rest of Middle East, South Africa, Egypt, Rest of Africa)
Inositol Companies Profiled in the Study
Asiamerica Group Inc
Charles Bowman & Company
Hebei Yuwei Biotechnology Co. Ltd
Jingkai Biotechnology
Koninklijke DSM NV
Mr. Bill's Pipe & Tobacco Company
Ronas Chemicals Ind. Co. Ltd
Shandong Runde Biotechnology Co.
T.J. Clark & Company
Zhucheng Haotian Pharm Co. Ltd
*- List Not Exhaustive
Chapter 1. TABLE OF CONTENTS
Chapter 2. Introduction to Inositol Market
2.1. Market Overview
2.2. Key Statistics and Report Highlights
2.3. Scope of the Comprehensive Study
2.3.1. Market Definition
2.3.2 Countries and Regions Covered
2.3.3 Research Objective
2.3.4 Units, Currency, and Conversions
2.3.5 Industry Value Chain
2.4. Key Market Segments
2.5. Key Companies
2.6. Study Period
Chapter 3. Strategic Analysis Review
3.1. Inositol Pricing Analysis and Forecast
3.2. Porter’s Five Forces
3.3. Market Ecosystem
3.4. SWOT Analysis
3.5. Regulatory Scenario
3.3. Effects of Inflation, Russia-Ukraine War, moderating economic growth, and other macroeconomic factors
Chapter 4. Competitive Landscape
4.1. Market Share Analysis
4.1.1. Global Inositol Market Share by Company, 2023
4.1.2. Product Offerings of Leading Inositol Companies
4.2. Market Entropy
4.2.1. New Product Launches in the Industry
4.2.2. Mergers, Acquisitions, Joint ventures, and Partnerships
4.3. Key Strategies and Best Practices
Chapter 5. Global Market Projections: Best, Reference, and Low Case Scenarios
5.1. Growth Analysis- Case Scenario Definitions
5.2. Low Growth Case Scenario Forecasts
5.3. Reference Growth Case Scenario Forecasts
5.4. High Growth Case Scenario Forecasts
Chapter 6. Market Dynamics
6.1. Inositol Market Drivers
6.2. Inositol Market Challenges
6.6. Inositol Market Opportunities
6.4. Inositol Market Trends
Chapter 7. Global Inositol Market Outlook Trends
7.1. Global Inositol Revenue (USD Million) and CAGR (%) by Type (2021-2032)
7.2. Global Inositol Revenue (USD Million) and CAGR (%) by Application (2021-2032)
7.3. Global Inositol Revenue (USD Million) and CAGR (%) by Product (2021-2032)
By Source
Plant-based
Synthetic
By Application
Dietary Supplement
Beverage
Feed Industry
Pharmaceutical Industry
Others
Chapter 8. Global Inositol Regional Analysis and Outlook
8.1. Global Inositol Revenue (USD Million) By Regions (2021- 2032)
8.2. North America Inositol Revenue (USD Million) by Country (2021-2032)
8.2.1. United States Inositol Regional Analysis and Outlook
8.2.2. Canada Inositol Regional Analysis and Outlook
8.2.3. Mexico Inositol Regional Analysis and Outlook
8.3. Europe Inositol Revenue (USD Million), by Country (2021-2032)
8.3.1. Germany Inositol Regional Analysis and Outlook
8.3.2. France Inositol Regional Analysis and Outlook
8.3.3. United Kingdom Inositol Regional Analysis and Outlook
8.3.4. Spain Inositol Regional Analysis and Outlook
8.3.5. Italy Inositol Regional Analysis and Outlook
8.3.6. Russia Inositol Regional Analysis and Outlook
8.3.7. Rest of Europe Inositol Regional Analysis and Outlook
8.4. Asia Pacific Inositol Revenue (USD Million) by Country (2021-2032)
8.4.1. China Inositol Regional Analysis and Outlook
8.4.2. Japan Inositol Regional Analysis and Outlook
8.4.3. India Inositol Regional Analysis and Outlook
8.4.4. South Korea Inositol Regional Analysis and Outlook
8.4.5. Australia Inositol Regional Analysis and Outlook
8.4.6. South East Asia Inositol Regional Analysis and Outlook
8.4.7. Rest of Asia Pacific Inositol Regional Analysis and Outlook
8.5. South America Inositol Revenue (USD Million), by Country (2021-2032)
8.5.1. Brazil Inositol Regional Analysis and Outlook
8.5.2. Argentina Inositol Regional Analysis and Outlook
8.5.3. Rest of South America Inositol Regional Analysis and Outlook
8.6. Middle East and Africa Inositol Revenue (USD Million) by Country (2021-2032)
8.6.1. Middle East Inositol Regional Analysis and Outlook
8.6.2. Africa Inositol Regional Analysis and Outlook
Chapter 9. North America Inositol Analysis and Outlook
9.1. North America Inositol Revenue (USD Million) by Segments (2021-2032)
9.1.1. North America Inositol Revenue (USD Million) by Type (2021-2032)
9.1.2. North America Inositol Revenue (USD Million) by Application (2021-2032)
9.1.3. North America Inositol Revenue (USD Million) by Product (2021-2032)
By Source
Plant-based
Synthetic
By Application
Dietary Supplement
Beverage
Feed Industry
Pharmaceutical Industry
Others
Chapter 10. Europe Inositol Analysis and Outlook
10.1. Europe Inositol Revenue (USD Million), by Segments (USD Million) (2021-2032)
10.1.1. Europe Inositol Revenue (USD Million) by Type (2021-2032)
10.1.2. Europe Inositol Revenue (USD Million) by Application (2021-2032)
10.1.3. Europe Inositol Revenue (USD Million) by Product (2021-2032)
By Source
Plant-based
Synthetic
By Application
Dietary Supplement
Beverage
Feed Industry
Pharmaceutical Industry
Others
Chapter 11. Asia Pacific Inositol Analysis and Outlook
11.1. Asia Pacific Inositol Revenue (USD Million), and Revenue (USD Million) by Segments (2021-2032)
11.1.1. Asia Pacific Inositol Revenue (USD Million) by Type (2021-2032)
11.1.2. Asia Pacific Inositol Revenue (USD Million) by Application (2021-2032)
11.1.3. Asia Pacific Inositol Revenue (USD Million) by Product (2021-2032)
By Source
Plant-based
Synthetic
By Application
Dietary Supplement
Beverage
Feed Industry
Pharmaceutical Industry
Others
Chapter 12. South America Inositol Analysis and Outlook
12.1. South America Inositol Revenue (USD Million), by Segments (2021-2032)
12.1.1. South America Inositol Revenue (USD Million) by Type (2021-2032)
12.1.2. South America Inositol Revenue (USD Million) by Application (2021-2032)
12.1.3. South America Inositol Revenue (USD Million) by Product (2021-2032)
By Source
Plant-based
Synthetic
By Application
Dietary Supplement
Beverage
Feed Industry
Pharmaceutical Industry
Others
Chapter 13. Middle East and Africa Inositol Analysis and Outlook
13.1. Middle East and Africa Inositol Revenue (USD Million), by Segments (2021-2032)
13.1.1. Middle East and Africa Inositol Revenue (USD Million) by Type (2021-2032)
13.1.2. Middle East and Africa Inositol Revenue (USD Million) by Application (2021-2032)
13.1.3. Middle East and Africa Inositol Revenue (USD Million) by Product (2021-2032)
By Source
Plant-based
Synthetic
By Application
Dietary Supplement
Beverage
Feed Industry
Pharmaceutical Industry
Others
Chapter 14. Inositol Company Profiles
14.1 Business Overview
14.2 Product Profiles
14.3 SWOT Profiles
14.5 Recent Developments
14.6 Financial Profile
List of Companies
Asiamerica Group Inc
Charles Bowman & Company
Hebei Yuwei Biotechnology Co. Ltd
Jingkai Biotechnology
Koninklijke DSM NV
Mr. Bill's Pipe & Tobacco Company
Ronas Chemicals Ind. Co. Ltd
Shandong Runde Biotechnology Co.
T.J. Clark & Company
Zhucheng Haotian Pharm Co. Ltd
15. Methodology and Data Sources
15.1 Customization Offerings
15.2 Subscription Services
15.3 Related Reports
15.4 Publisher Expertise
LIST OF TABLES
Table 1 Market Segmentation Analysis
Table 2 Global Inositol Market Share of Leading Companies, 2023
Table 3 Product Offerings of Leading Companies
Table 4 Low Growth Scenario Forecasts
Table 5 Reference Case Growth Scenario
Table 6 High Growth Case Scenario
Table 7 Global Inositol Revenue (USD Million) And CAGR (%) By Type (2021-2032)
Table 8 Global Inositol Revenue (USD Million) And CAGR (%) By Application (2021-2032)
Table 9 Global Inositol Revenue (USD Million) And CAGR (%) By Product (2021-2032)
Table 10 Global Inositol Market Revenue (USD Million) By Regions (2021-2032)
Table 11 Global Inositol Market Share (%) By Regions (2021-2032)
Table 12 North America Inositol Revenue (USD Million) By Country (2021-2032)
Table 13 Europe Inositol Revenue (USD Million) By Country (2021-2032)
Table 14 Asia Pacific Inositol Revenue (USD Million) By Country (2021-2032)
Table 15 South America Inositol Revenue (USD Million) By Country (2021-2032)
Table 16 Middle East and Africa Inositol Revenue (USD Million) By Region (2021-2032)
Table 17 North America Inositol Revenue (USD Million) By Type (2021-2032)
Table 18 North America Inositol Revenue (USD Million) By Application (2021-2032)
Table 19 North America Inositol Revenue (USD Million) By Product (2021-2032)
Table 20 Europe Inositol Revenue (USD Million) By Type (2021-2032)
Table 21 Europe Inositol Revenue (USD Million) By Application (2021-2032)
Table 22 Europe Inositol Revenue (USD Million) By Product (2021-2032)
Table 23 Asia Pacific Inositol Revenue (USD Million) By Type (2021-2032)
Table 24 Asia Pacific Inositol Revenue (USD Million) By Application (2021-2032)
Table 25 Asia Pacific Inositol Revenue (USD Million) By Product (2021-2032)
Table 26 South America Inositol Revenue (USD Million) By Type (2021-2032)
Table 27 South America Inositol Revenue (USD Million) By Application (2021-2032)
Table 28 South America Inositol Revenue (USD Million) By Product (2021-2032)
Table 29 Middle East and Africa Inositol Revenue (USD Million) By Type (2021-2032)
Table 30 Middle East and Africa Inositol Revenue (USD Million) By Application (2021-2032)
Table 31 Middle East and Africa Inositol Revenue (USD Million) By Product (2021-2032)
LIST OF FIGURES
Figure 1. Market Scope
Figure 2. Pricing Forecasts Per Unit, 2023- 2032
Figure 3. Porter’s Five Forces
Figure 4. Global Inositol Market Revenue (USD Million) By Regions (2021-2032)
Figure 5. Global Inositol Market Share (%) By Regions (2023)
Figure 6. North America Inositol Revenue (USD Million) By Country (2021-2032)
Figure 7. United States Inositol Revenue (USD Million) By Country (2021-2032)
Figure 8. Canada Inositol Revenue (USD Million) By Country (2021-2032)
Figure 9. Mexico Inositol Revenue (USD Million) By Country (2021-2032)
Figure 10. Europe Inositol Revenue (USD Million) By Country (2021-2032)
Figure 11. Germany Inositol Revenue (USD Million) By Country (2021-2032)
Figure 12. France Inositol Revenue (USD Million) By Country (2021-2032)
Figure 13. United Kingdom Inositol Revenue (USD Million) By Country (2021-2032)
Figure 14. Spain Inositol Revenue (USD Million) By Country (2021-2032)
Figure 15. Italy Inositol Revenue (USD Million) By Country (2021-2032)
Figure 16. Russia Inositol Revenue (USD Million) By Country (2021-2032)
Figure 17. Rest of Europe Inositol Revenue (USD Million) By Country (2021-2032)
Figure 11. Asia Pacific Inositol Revenue (USD Million) By Country (2021-2032)
Figure 12. China Inositol Revenue (USD Million) By Country (2021-2032)
Figure 13. Japan Inositol Revenue (USD Million) By Country (2021-2032)
Figure 14. India Inositol Revenue (USD Million) By Country (2021-2032)
Figure 15. South Korea Inositol Revenue (USD Million) By Country (2021-2032)
Figure 16. Australia Inositol Revenue (USD Million) By Country (2021-2032)
Figure 17. South East Asia Inositol Revenue (USD Million) By Country (2021-2032)
Figure 18. South America Inositol Revenue (USD Million) By Country (2021-2032)
Figure 19. Brazil Inositol Revenue (USD Million) By Country (2021-2032)
Figure 20. Argentina Inositol Revenue (USD Million) By Country (2021-2032)
Figure 21. Rest of Asia Pacific Inositol Revenue (USD Million) By Country (2021-2032)
Figure 22. Middle East and Africa Inositol Revenue (USD Million) By Region (2021-2032)
Figure 23. Saudi Arabia Inositol Revenue (USD Million) By Region (2021-2032)
Figure 24. The UAE Inositol Revenue (USD Million) By Region (2021-2032)
Figure 25. Rest of Middle East Inositol Revenue (USD Million) By Region (2021-2032)
Figure 26. South Africa Inositol Revenue (USD Million) By Region (2021-2032)
Figure 27. Africa Inositol Revenue (USD Million) By Region (2021-2032)
Figure 28. North America Inositol Revenue (USD Million) By Type (2021-2032)
Figure 29. North America Inositol Revenue (USD Million) By Application (2021-2032)
Figure 30. North America Inositol Revenue (USD Million) By Product (2021-2032)
Figure 31. Europe Inositol Revenue (USD Million) By Type (2021-2032)
Figure 32. Europe Inositol Revenue (USD Million) By Application (2021-2032)
Figure 33. Europe Inositol Revenue (USD Million) By Product (2021-2032)
Figure 34. Asia Pacific Inositol Revenue (USD Million) By Type (2021-2032)
Figure 35. Asia Pacific Inositol Revenue (USD Million) By Application (2021-2032)
Figure 36. Asia Pacific Inositol Revenue (USD Million) By Product (2021-2032)
Figure 37. South America Inositol Revenue (USD Million) By Type (2021-2032)
Figure 38. South America Inositol Revenue (USD Million) By Application (2021-2032)
Figure 39. South America Inositol Revenue (USD Million) By Product (2021-2032)
Figure 40. Middle East and Africa Inositol Revenue (USD Million) By Type (2021-2032)
Figure 41. Middle East and Africa Inositol Revenue (USD Million) By Application (2021-2032)
Figure 42. Middle East and Africa Inositol Revenue (USD Million) By Product (2021-2032)
By Source
Plant-based
Synthetic
By Application
Dietary Supplement
Beverage
Feed Industry
Pharmaceutical Industry
Others
Countries Analyzed
North America (US, Canada, Mexico)
Europe (Germany, UK, France, Spain, Italy, Russia, Rest of Europe)
Asia Pacific (China, India, Japan, South Korea, Australia, South East Asia, Rest of Asia)
South America (Brazil, Argentina, Rest of South America)
Middle East and Africa (Saudi Arabia, UAE, Rest of Middle East, South Africa, Egypt, Rest of Africa)
