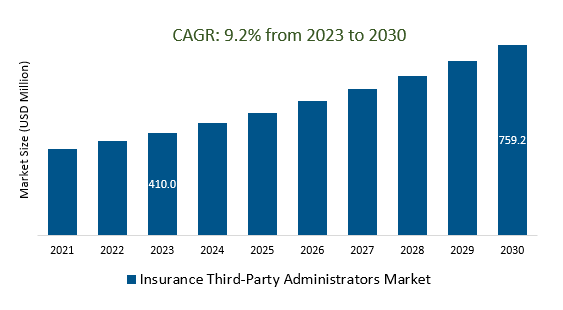
The Insurance Third-Party Administrators Market Size is estimated to register XX% growth over the forecast period from 2023 to 2030.
The market growth is driven by the increasing insurance industry and is subject to a myriad of regulations and compliance requirements. TPAs must stay updated and compliant with these regulations, which can be a driver for growth as insurance companies outsource these tasks. Leading companies that are focused on Increased Demand for Health Insurance Services, Expansion into New Markets, Focus on Customer Experience, Cybersecurity and Data Privacy, Integration with Insurtech, Regulatory Changes, and others to boost market shares in the industry.
Market Overview
The Insurance Third-Party Administrators (TPA) market encompasses independent companies offering outsourced services to insurance providers, including claims processing, policy administration, and premium collection. Major players include Sedgwick, Gallagher Bassett, York Risk Services Group, and Crawford & Company. Key market trends include digital transformation, regulatory compliance, and healthcare cost containment. Challenges involve regulatory compliance, data security, and competition. The future outlook depends on technological advancements, evolving customer demands, and regulatory changes, with adaptable TPAs expected to succeed in the evolving insurance landscape.
Market Dynamics
Market Trends - Impact of Data Analytics on the Insurance TPA Market
Data analytics has a significant impact on the Insurance Third-Party Administrators (TPA) market by improving risk assessment, fraud detection, claims processing efficiency, customer insights, cost containment, underwriting accuracy, operational efficiency, regulatory compliance, claim settlements, and market insights. TPAs leveraging data analytics gain a competitive edge in the evolving insurance landscape.
Market Driver- Digital Transformation Demand Insurance Third-Party Administrators Market
The demand for digital transformation in the Insurance Third-Party Administrators (TPA) market is rising sharply, driven by the need for operational efficiency, improved customer experiences, and competitive advantages. TPAs are increasingly adopting digital technologies such as AI, blockchain, and data analytics to streamline processes, enhance customer service, and ensure compliance. This shift positions TPAs to meet the evolving demands of insurance companies and play a key role in the modernization of the insurance industry.
Market Opportunity-Introduction of Cybersecurity Concerns
Cybersecurity concerns are critical in the Insurance Third-Party Administrators (TPA) market due to the sensitive nature of the data they handle and the increasing digitalization of processes. TPAs must prioritize robust cybersecurity measures, including data encryption, intrusion detection, and compliance with data protection regulations, to mitigate the risk of cyberattacks, financial losses, legal liabilities, and damage to their reputation.
Market Share Analysis- HealthCare Providers Insurance Third-Party Administrators Market will register the fastest growth
The Global Insurance Third-Party Administrators Market is analyzed across HealthCare Providers, Retirement Plans, Commercial General Liability Insurance, and others. Healthcare Providers are poised to register the fastest growth. Healthcare providers play a pivotal role in the Insurance Third-Party Administrators (TPA) market by partnering with TPAs to facilitate efficient health insurance claims processing, payment reimbursement, and patient care coordination. This collaboration is essential for cost control, improved patient experiences, and effective healthcare delivery within the insurance ecosystem.
Market Share Analysis- Claims Management held a significant market share in 2023
The Global Insurance Third-Party Administrators Market is analyzed across various Service types including Claims Management, Policy Management, Commission Management, and others. Of these, Claims Management held a significant market share in 2023. Claims management is a central function in the Insurance Third-Party Administrators (TPA) market, where TPAs specialize in efficiently processing and managing insurance claims on behalf of insurers, self-insured entities, and government organizations. TPAs verify claim legitimacy, assess coverage, and facilitate prompt and accurate payments to policyholders or beneficiaries.
Insurance Third-Party Administrators Market Segmentation
By Insurance Type
- Healthcare Providers
- Retirement Plans
- Commercial General Liability Insurance
- Others
By Service Type
- Claims Management
- Policy Management
- Commission Management
- Others
By End User
- Life and Health Insurance
- Property and Casualty Insurance
By Enterprise Size
By Region
- North America (United States, Canada, Mexico)
- Europe (Germany, France, United Kingdom, Spain, Italy, Others)
- Asia Pacific (China, India, Japan, South Korea, Australia, Others)
- Latin America (Brazil, Argentina, Others)
- Middle East and Africa (Saudi Arabia, UAE, Kuwait, Other Middle East, South Africa, Nigeria, Other Africa)
Insurance Third-Party Administrators Market Companies
- Sedgwick Claims Management Services Inc
- UMR Inc
- Charles Taylor
- Gallagher Bassett Services
- ExlService Holdings, Inc
- Meritain Health Inc
- CorVel Corporation
- Helmsman Management Services LLC
- ESIS Inc
- Crawford & Company
- United Healthcare Services Inc
*List not exhaustive
Insurance Third-Party Administrators Market Outlook 2023
1 Market Overview
1.1 Introduction to the Insurance Third-Party Administrators Market
1.2 Scope of the Study
1.3 Research Objective
1.3.1 Key Market Scope and Segments
1.3.2 Players Covered
1.3.3 Years Considered
2 Executive Summary
2.1 2023 Insurance Third-Party Administrators Industry- Market Statistics
3 Market Dynamics
3.1 Market Drivers
3.2 Market Challenges
3.3 Market Opportunities
3.4 Market Trends
4 Market Factor Analysis
4.1 Porter’s Five Forces
4.2 Market Entropy
4.2.1 Global Insurance Third-Party Administrators Market Companies with Area Served
4.2.2 Products Offerings Global Insurance Third-Party Administrators Market
5 COVID-19 Impact Analysis and Outlook Scenarios
5.1.1 Covid-19 Impact Analysis
5.1.2 post-COVID-19 Scenario- Low Growth Case
5.1.3 post-COVID-19 Scenario- Reference Growth Case
5.1.4 post-COVID-19 Scenario- Low Growth Case
6 Global Insurance Third-Party Administrators Market Trends
6.1 Global Insurance Third-Party Administrators Revenue (USD Million) and CAGR (%) by Type (2018-2030)
6.2 Global Insurance Third-Party Administrators Revenue (USD Million) and CAGR (%) by Applications (2018-2030)
6.3 Global Insurance Third-Party Administrators Revenue (USD Million) and CAGR (%) by regions (2018-2030)
7 Global Insurance Third-Party Administrators Market Revenue (USD Million) by Type, and Applications (2018-2022)
7.1 Global Insurance Third-Party Administrators Revenue (USD Million) by Type (2018-2022)
7.1.1 Global Insurance Third-Party Administrators Revenue (USD Million), Market Share (%) by Type (2018-2022)
7.2 Global Insurance Third-Party Administrators Revenue (USD Million) by Applications (2018-2022)
7.2.1 Global Insurance Third-Party Administrators Revenue (USD Million), Market Share (%) by Applications (2018-2022)
8 Global Insurance Third-Party Administrators Development Regional Status and Outlook
8.1 Global Insurance Third-Party Administrators Revenue (USD Million) By Regions (2018-2022)
8.2 North America Insurance Third-Party Administrators Revenue (USD Million) by Type, and Application (2018-2022)
8.2.1 North America Insurance Third-Party Administrators Revenue (USD Million) by Country (2018-2022)
8.2.2 North America Insurance Third-Party Administrators Revenue (USD Million) by Type (2018-2022)
8.2.3 North America Insurance Third-Party Administrators Revenue (USD Million) by Applications (2018-2022)
8.3 Europe Insurance Third-Party Administrators Revenue (USD Million), by Type, and Applications (USD Million) (2018-2022)
8.3.1 Europe Insurance Third-Party Administrators Revenue (USD Million), by Country (2018-2022)
8.3.2 Europe Insurance Third-Party Administrators Revenue (USD Million) by Type (2018-2022)
8.3.3 Europe Insurance Third-Party Administrators Revenue (USD Million) by Applications (2018-2022)
8.4 Asia Pacific Insurance Third-Party Administrators Revenue (USD Million), and Revenue (USD Million) by Type, and Applications (2018-2022)
8.4.1 Asia Pacific Insurance Third-Party Administrators Revenue (USD Million) by Country (2018-2022)
8.4.2 Asia Pacific Insurance Third-Party Administrators Revenue (USD Million) by Type (2018-2022)
8.4.3 Asia Pacific Insurance Third-Party Administrators Revenue (USD Million) by Applications (2018-2022)
8.5 South America Insurance Third-Party Administrators Revenue (USD Million), by Type, and Applications (2018-2022)
8.5.1 South America Insurance Third-Party Administrators Revenue (USD Million), by Country (2018-2022)
8.5.2 South America Insurance Third-Party Administrators Revenue (USD Million) by Type (2018-2022)
8.5.3 South America Insurance Third-Party Administrators Revenue (USD Million) by Applications (2018-2022)
8.6 Middle East and Africa Insurance Third-Party Administrators Revenue (USD Million), by Type, Technology, Application, Thickness (2018-2022)
8.6.1 Middle East and Africa Insurance Third-Party Administrators Revenue (USD Million) by Country (2018-2022)
8.6.2 Middle East and Africa Insurance Third-Party Administrators Revenue (USD Million) by Type (2018-2022)
8.6.3 Middle East and Africa Insurance Third-Party Administrators Revenue (USD Million) by Applications (2018-2022)
9 Company Profiles
10 Global Insurance Third-Party Administrators Market Revenue (USD Million), by Type, and Applications (2023-2030)
10.1 Global Insurance Third-Party Administrators Revenue (USD Million) and Market Share (%) by Type (2023-2030)
10.1.1 Global Insurance Third-Party Administrators Revenue (USD Million), and Market Share (%) by Type (2023-2030)
10.2 Global Insurance Third-Party Administrators Revenue (USD Million) and Market Share (%) by Applications (2023-2030)
10.2.1 Global Insurance Third-Party Administrators Revenue (USD Million), and Market Share (%) by Applications (2023-2030)
11 Global Insurance Third-Party Administrators Development Regional Status and Outlook Forecast
11.1 Global Insurance Third-Party Administrators Revenue (USD Million) By Regions (2023-2030)
11.2 North America Insurance Third-Party Administrators Revenue (USD Million) by Type, and Applications (2023-2030)
11.2.1 North America Insurance Third-Party Administrators Revenue (USD) Million by Country (2023-2030)
11.2.2 North America Insurance Third-Party Administrators Revenue (USD Million), by Type (2023-2030)
11.2.3 North America Insurance Third-Party Administrators Revenue (USD Million), Market Share (%) by Applications (2023-2030)
11.3 Europe Insurance Third-Party Administrators Revenue (USD Million), by Type, and Applications (2023-2030)
11.3.1 Europe Insurance Third-Party Administrators Revenue (USD Million), by Country (2023-2030)
11.3.2 Europe Insurance Third-Party Administrators Revenue (USD Million), by Type (2023-2030)
11.3.3 Europe Insurance Third-Party Administrators Revenue (USD Million), by Applications (2023-2030)
11.4 Asia Pacific Insurance Third-Party Administrators Revenue (USD Million) by Type, and Applications (2023-2030)
11.4.1 Asia Pacific Insurance Third-Party Administrators Revenue (USD Million), by Country (2023-2030)
11.4.2 Asia Pacific Insurance Third-Party Administrators Revenue (USD Million), by Type (2023-2030)
11.4.3 Asia Pacific Insurance Third-Party Administrators Revenue (USD Million), by Applications (2023-2030)
11.5 South America Insurance Third-Party Administrators Revenue (USD Million), by Type, and Applications (2023-2030)
11.5.1 South America Insurance Third-Party Administrators Revenue (USD Million), by Country (2023-2030)
11.5.2 South America Insurance Third-Party Administrators Revenue (USD Million), by Type (2023-2030)
11.5.3 South America Insurance Third-Party Administrators Revenue (USD Million), by Applications (2023-2030)
11.6 Middle East and Africa Insurance Third-Party Administrators Revenue (USD Million), by Type, and Applications (2023-2030)
11.6.1 Middle East and Africa Insurance Third-Party Administrators Revenue (USD Million), by region (2023-2030)
11.6.2 Middle East and Africa Insurance Third-Party Administrators Revenue (USD Million), by Type (2023-2030)
11.6.3 Middle East and Africa Insurance Third-Party Administrators Revenue (USD Million), by Applications (2023-2030)
12 Methodology and Data Sources
12.1 Methodology/Research Approach
12.1.1 Research Programs/Design
12.1.2 Market Size Estimation
12.1.3 Market Breakdown and Data Triangulation
12.2 Data Sources
12.2.1 Secondary Sources
12.2.2 Primary Sources
12.3 Disclaimer
List of Tables
Table 1 Market Segmentation Analysis
Table 2 Global Insurance Third-Party Administrators Market Companies with Areas Served
Table 3 Products Offerings Global Insurance Third-Party Administrators Market
Table 4 Low Growth Scenario Forecasts
Table 5 Reference Case Growth Scenario
Table 6 High Growth Case Scenario
Table 7 Global Insurance Third-Party Administrators Revenue (USD Million) And CAGR (%) By Type (2018-2030)
Table 8 Global Insurance Third-Party Administrators Revenue (USD Million) And CAGR (%) By Applications (2018-2030)
Table 9 Global Insurance Third-Party Administrators Revenue (USD Million) And CAGR (%) By Regions (2018-2030)
Table 10 Global Insurance Third-Party Administrators Revenue (USD Million) By Type (2018-2022)
Table 11 Global Insurance Third-Party Administrators Revenue Market Share (%) By Type (2018-2022)
Table 12 Global Insurance Third-Party Administrators Revenue (USD Million) By Applications (2018-2022)
Table 13 Global Insurance Third-Party Administrators Revenue Market Share (%) By Applications (2018-2022)
Table 14 Global Insurance Third-Party Administrators Market Revenue (USD Million) By Regions (2018-2022)
Table 15 Global Insurance Third-Party Administrators Market Share (%) By Regions (2018-2022)
Table 16 North America Insurance Third-Party Administrators Revenue (USD Million) By Country (2018-2022)
Table 17 North America Insurance Third-Party Administrators Revenue (USD Million) By Type (2018-2022)
Table 18 North America Insurance Third-Party Administrators Revenue (USD Million) By Applications (2018-2022)
Table 19 Europe Insurance Third-Party Administrators Revenue (USD Million) By Country (2018-2022)
Table 20 Europe Insurance Third-Party Administrators Revenue (USD Million) By Type (2018-2022)
Table 21 Europe Insurance Third-Party Administrators Revenue (USD Million) By Applications (2018-2022)
Table 22 Asia Pacific Insurance Third-Party Administrators Revenue (USD Million) By Country (2018-2022)
Table 23 Asia Pacific Insurance Third-Party Administrators Revenue (USD Million) By Type (2018-2022)
Table 24 Asia Pacific Insurance Third-Party Administrators Revenue (USD Million) By Applications (2018-2022)
Table 25 South America Insurance Third-Party Administrators Revenue (USD Million) By Country (2018-2022)
Table 26 South America Insurance Third-Party Administrators Revenue (USD Million) By Type (2018-2022)
Table 27 South America Insurance Third-Party Administrators Revenue (USD Million) By Applications (2018-2022)
Table 28 Middle East and Africa Insurance Third-Party Administrators Revenue (USD Million) By Region (2018-2022)
Table 29 Middle East and Africa Insurance Third-Party Administrators Revenue (USD Million) By Type (2018-2022)
Table 30 Middle East and Africa Insurance Third-Party Administrators Revenue (USD Million) By Applications (2018-2022)
Table 31 Financial Analysis
Table 32 Global Insurance Third-Party Administrators Revenue (USD Million) By Type (2023-2030)
Table 33 Global Insurance Third-Party Administrators Revenue Market Share (%) By Type (2023-2030)
Table 34 Global Insurance Third-Party Administrators Revenue (USD Million) By Applications (2023-2030)
Table 35 Global Insurance Third-Party Administrators Revenue Market Share (%) By Applications (2023-2030)
Table 36 Global Insurance Third-Party Administrators Market Revenue (USD Million), And Revenue (USD Million) By Regions (2023-2030)
Table 37 North America Insurance Third-Party Administrators Revenue (USD)By Country (2023-2030)
Table 38 North America Insurance Third-Party Administrators Revenue (USD Million) By Type (2023-2030)
Table 39 North America Insurance Third-Party Administrators Revenue (USD Million) By Applications (2023-2030)
Table 40 Europe Insurance Third-Party Administrators Revenue (USD Million) By Country (2023-2030)
Table 41 Europe Insurance Third-Party Administrators Revenue (USD Million) By Type (2023-2030)
Table 42 Europe Insurance Third-Party Administrators Revenue (USD Million) By Applications (2023-2030)
Table 43 Asia Pacific Insurance Third-Party Administrators Revenue (USD Million) By Country (2023-2030)
Table 44 Asia Pacific Insurance Third-Party Administrators Revenue (USD Million) By Type (2023-2030)
Table 45 Asia Pacific Insurance Third-Party Administrators Revenue (USD Million) By Applications (2023-2030)
Table 46 South America Insurance Third-Party Administrators Revenue (USD Million) By Country (2023-2030)
Table 47 South America Insurance Third-Party Administrators Revenue (USD Million) By Type (2023-2030)
Table 48 South America Insurance Third-Party Administrators Revenue (USD Million) By Applications (2023-2030)
Table 49 Middle East and Africa Insurance Third-Party Administrators Revenue (USD Million) By Region (2023-2030)
Table 50 Middle East and Africa Insurance Third-Party Administrators Revenue (USD Million) By Region (2023-2030)
Table 51 Middle East and Africa Insurance Third-Party Administrators Revenue (USD Million) By Type (2023-2030)
Table 52 Middle East and Africa Insurance Third-Party Administrators Revenue (USD Million) By Applications (2023-2030)
Table 53 Research Programs/Design for This Report
Table 54 Key Data Information from Secondary Sources
Table 55 Key Data Information from Primary Sources
List of Figures
Figure 1 Market Scope
Figure 2 Porter’s Five Forces
Figure 3 Global Insurance Third-Party Administrators Revenue (USD Million) By Type (2018-2022)
Figure 4 Global Insurance Third-Party Administrators Revenue Market Share (%) By Type (2022)
Figure 5 Global Insurance Third-Party Administrators Revenue (USD Million) By Applications (2018-2022)
Figure 6 Global Insurance Third-Party Administrators Revenue Market Share (%) By Applications (2022)
Figure 7 Global Insurance Third-Party Administrators Market Revenue (USD Million) By Regions (2018-2022)
Figure 8 Global Insurance Third-Party Administrators Market Share (%) By Regions (2022)
Figure 9 North America Insurance Third-Party Administrators Revenue (USD Million) By Country (2018-2022)
Figure 10 North America Insurance Third-Party Administrators Revenue (USD Million) By Type (2018-2022)
Figure 11 North America Insurance Third-Party Administrators Revenue (USD Million) By Applications (2018-2022)
Figure 12 Europe Insurance Third-Party Administrators Revenue (USD Million) By Country (2018-2022)
Figure 13 Europe Insurance Third-Party Administrators Revenue (USD Million) By Type (2018-2022)
Figure 14 Europe Insurance Third-Party Administrators Revenue (USD Million) By Applications (2018-2022)
Figure 15 Asia Pacific Insurance Third-Party Administrators Revenue (USD Million) By Country (2018-2022)
Figure 16 Asia Pacific Insurance Third-Party Administrators Revenue (USD Million) By Type (2018-2022)
Figure 17 Asia Pacific Insurance Third-Party Administrators Revenue (USD Million) By Applications (2018-2022)
Figure 18 South America Insurance Third-Party Administrators Revenue (USD Million) By Country (2018-2022)
Figure 19 South America Insurance Third-Party Administrators Revenue (USD Million) By Type (2018-2022)
Figure 20 South America Insurance Third-Party Administrators Revenue (USD Million) By Applications (2018-2022)
Figure 21 Middle East and Africa Insurance Third-Party Administrators Revenue (USD Million) By Region (2018-2022)
Figure 22 Middle East and Africa Insurance Third-Party Administrators Revenue (USD Million) By Type (2018-2022)
Figure 23 Middle East and Africa Insurance Third-Party Administrators Revenue (USD Million) By Applications (2018-2022)
Figure 24 Global Insurance Third-Party Administrators Revenue (USD Million) By Type (2023-2030)
Figure 25 Global Insurance Third-Party Administrators Revenue Market Share (%) By Type (2030)
Figure 26 Global Insurance Third-Party Administrators Revenue (USD Million) By Applications (2023-2030)
Figure 27 Global Insurance Third-Party Administrators Revenue Market Share (%) By Applications (2030)
Figure 28 Global Insurance Third-Party Administrators Market Revenue (USD Million) By Regions (2023-2030)
Figure 29 North America Insurance Third-Party Administrators Revenue (USD Million) By Country (2023-2030)
Figure 30 North America Insurance Third-Party Administrators Revenue (USD Million) By Type (2023-2030)
Figure 31 North America Insurance Third-Party Administrators Revenue (USD Million) By Applications (2023-2030)
Figure 32 Europe Insurance Third-Party Administrators Revenue (USD Million) By Country (2023-2030)
Figure 33 Europe Insurance Third-Party Administrators Revenue (USD Million) By Type (2023-2030)
Figure 34 Europe Insurance Third-Party Administrators Revenue (USD Million) By Applications (2023-2030)
Figure 35 Asia Pacific Insurance Third-Party Administrators Revenue (USD Million) By Country (2023-2030)
Figure 36 Asia Pacific Insurance Third-Party Administrators Revenue (USD Million) By Type (2023-2030)
Figure 37 Asia Pacific Insurance Third-Party Administrators Revenue (USD Million) By Applications (2023-2030)
Figure 38 South America Insurance Third-Party Administrators Revenue (USD Million) By Country (2023-2030)
Figure 39 South America Insurance Third-Party Administrators Revenue (USD Million) By Type (2023-2030)
Figure 40 South America Insurance Third-Party Administrators Revenue (USD Million) By Applications (2023-2030)
Figure 41 Middle East and Africa Insurance Third-Party Administrators Revenue (USD Million) By Region (2023-2030)
Figure 42 Middle East and Africa Insurance Third-Party Administrators Revenue (USD Million) By Region (2023-2030)
Figure 43 Middle East and Africa Insurance Third-Party Administrators Revenue (USD Million) By Type (2023-2030)
Figure 44 Middle East and Africa Insurance Third-Party Administrators Revenue (USD Million) By Applications (2023-2030)
Figure 45 Bottom-Up and Top-Down Approaches for This Report
Figure 46 Data Triangulation
