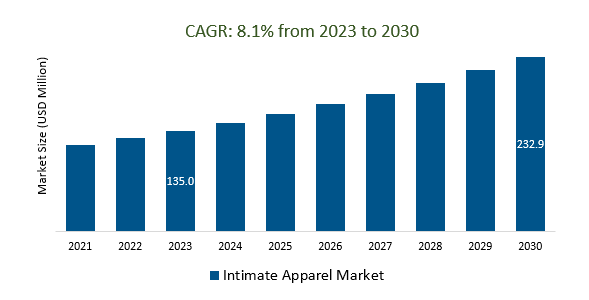
The global Intimate Apparel Market Size is estimated to be US$ 135.0 Billion in 2023 and is poised to register 8.1% growth over the forecast period from 2023 to 2030. to grow US$ 232.9 Billion in 2030.
The market growth is driven by Increasing social media platforms like Instagram and TikTok have a significant influence on fashion trends, including intimate apparel. Influencers and celebrities often promote specific brands and styles. Leading companies that are focusing on Sustainability and Eco-Friendly Practices, Innovative Materials and Technology, Customization and Personalization, Digitalization and E-commerce, Health and Wellness Focus, Digital Marketing and Influencer Collaborations, and others to boost market shares in the industry.
Market Overview
The intimate apparel market encompasses products like bras, panties, lingerie, and sleepwear, with a focus on comfort, aesthetics, and personal style. Key trends include sustainability, inclusivity, technological innovations, digital marketing, customization, health and wellness-focused designs, globalization, and a growing emphasis on comfort-driven, age-specific, and fashion-forward products. Consumer preferences, societal shifts, and online retail channels continue to shape this evolving market, which spans gender-specific segments, distribution channels, and product types.
Market Dynamics
Market Trends: Online Shopping and E-commerce Drive Growth in the Intimate Apparel Market
Online shopping and e-commerce have fueled robust growth in the intimate apparel market by offering consumers the convenience of browsing and purchasing a wide range of lingerie and undergarments online. The privacy and extensive choices provided by e-commerce platforms have driven consumer preferences, and digital marketing, particularly through social media, has played a significant role in brand promotion and influencing buying decisions. This shift to online retail has reshaped the industry, emphasizing the importance of strong online presences and seamless shopping experiences for intimate apparel businesses to meet customer expectations.
Market Driver: Consumers are demanding more comfortable and functional intimate apparel
Consumers are increasingly seeking comfortable, functional, and inclusive intimate apparel, driving industry trends toward soft materials, functional features, sustainability, technology integration, and body positivity. Brands are responding with diverse sizing, eco-friendly materials, technology-driven innovations, and personalized options to meet these evolving demands and cater to a more diverse customer base in the intimate apparel market.
Market opportunity: Introduction of Innovation in Fabrics
Innovation in fabrics for the intimate apparel market has been instrumental in meeting consumer demands for comfort, functionality, and sustainability. Brands are introducing advanced materials such as moisture-wicking fabrics, breathable textiles, and eco-friendly options like organic cotton or recycled materials to enhance the overall wearing experience. Smart textiles and 3D printing technologies are also being integrated, offering features like health monitoring or customizable designs.
Market Share Analysis: The Shapeware Intimate Apparel Market will register the fastest growth
The Global Intimate Apparel Market is analyzed across Shapewear, Bras, Underpants, Sleepwear, and others. Shapewear is poised to register significant growth. The shapewear intimate apparel market offers body-shaping garments to enhance body contours, boost confidence, and provide a slimming effect. This segment has grown due to increased consumer demand for comfortable, seamless solutions that improve appearance, with various options like bodysuits and leggings available to cater to different needs and occasions.
Market Share Analysis: Premium held a significant market share in 2023
The Global Intimate Apparel Market is analyzed across various Price Range including Economic, Luxury, Premium, and others. Of these, Premium held a significant market share in 2023. The premium intimate apparel market specializes in luxury lingerie and undergarments, emphasizing top-tier materials, craftsmanship, and exclusive designs for consumers seeking high-quality, exquisite, and exclusive intimate wear with a premium price tag.
Intimate Apparel Market Segmentation
By Type
- Bras
- Underpants
- Sleepwear
- Shapewear
- Others
By Price Range
By Sales Channels
By Region
- North America (United States, Canada, Mexico)
- Europe (Germany, France, United Kingdom, Spain, Italy, Others)
- Asia Pacific (China, India, Japan, South Korea, Australia, Others)
- Latin America (Brazil, Argentina, Others)
- Middle East and Africa (Saudi Arabia, UAE, Kuwait, Other Middle East, South Africa, Nigeria, Other Africa)
Intimate Apparel Market Companies
- H&M (Sweden)
- Jockey International (United States)
- Fashion Nova LLC (United States)
- Hanesbrands Inc (United States)
- PVH Corp (United States)
- Triumph (United States)
- The Gap Inc (United Sates)
- Calvin Klein (United States)
- Groupe Chantelle (France),
- Hunkemoller International (Netherlands)
*List not exhaustive
Intimate Apparel Market Outlook 2023
1 Market Overview
1.1 Introduction to the Intimate Apparel Market
1.2 Scope of the Study
1.3 Research Objective
1.3.1 Key Market Scope and Segments
1.3.2 Players Covered
1.3.3 Years Considered
2 Executive Summary
2.1 2023 Intimate Apparel Industry- Market Statistics
3 Market Dynamics
3.1 Market Drivers
3.2 Market Challenges
3.3 Market Opportunities
3.4 Market Trends
4 Market Factor Analysis
4.1 Porter’s Five Forces
4.2 Market Entropy
4.2.1 Global Intimate Apparel Market Companies with Area Served
4.2.2 Products Offerings Global Intimate Apparel Market
5 COVID-19 Impact Analysis and Outlook Scenarios
5.1.1 Covid-19 Impact Analysis
5.1.2 Post-COVID-19 Scenario- Low Growth Case
5.1.3 Post-COVID-19 Scenario- Reference Growth Case
5.1.4 Post-COVID-19 Scenario- Low Growth Case
6 Global Intimate Apparel Market Trends
6.1 Global Intimate Apparel Revenue (USD Million) and CAGR (%) by Type (2018-2030)
6.2 Global Intimate Apparel Revenue (USD Million) and CAGR (%) by Applications (2018-2030)
6.3 Global Intimate Apparel Revenue (USD Million) and CAGR (%) by Regions (2018-2030)
7 Global Intimate Apparel Market Revenue (USD Million) by Type, and Applications (2018-2022)
7.1 Global Intimate Apparel Revenue (USD Million) by Type (2018-2022)
7.1.1 Global Intimate Apparel Revenue (USD Million), Market Share (%) by Type (2018-2022)
7.2 Global Intimate Apparel Revenue (USD Million) by Applications (2018-2022)
7.2.1 Global Intimate Apparel Revenue (USD Million), Market Share (%) by Applications (2018-2022)
8 Global Intimate Apparel Development Regional Status and Outlook
8.1 Global Intimate Apparel Revenue (USD Million) By Regions (2018-2022)
8.2 North America Intimate Apparel Revenue (USD Million) by Type, and Application (2018-2022)
8.2.1 North America Intimate Apparel Revenue (USD Million) by Country (2018-2022)
8.2.2 North America Intimate Apparel Revenue (USD Million) by Type (2018-2022)
8.2.3 North America Intimate Apparel Revenue (USD Million) by Applications (2018-2022)
8.3 Europe Intimate Apparel Revenue (USD Million), by Type, and Applications (USD Million) (2018-2022)
8.3.1 Europe Intimate Apparel Revenue (USD Million), by Country (2018-2022)
8.3.2 Europe Intimate Apparel Revenue (USD Million) by Type (2018-2022)
8.3.3 Europe Intimate Apparel Revenue (USD Million) by Applications (2018-2022)
8.4 Asia Pacific Intimate Apparel Revenue (USD Million), and Revenue (USD Million) by Type, and Applications (2018-2022)
8.4.1 Asia Pacific Intimate Apparel Revenue (USD Million) by Country (2018-2022)
8.4.2 Asia Pacific Intimate Apparel Revenue (USD Million) by Type (2018-2022)
8.4.3 Asia Pacific Intimate Apparel Revenue (USD Million) by Applications (2018-2022)
8.5 South America Intimate Apparel Revenue (USD Million), by Type, and Applications (2018-2022)
8.5.1 South America Intimate Apparel Revenue (USD Million), by Country (2018-2022)
8.5.2 South America Intimate Apparel Revenue (USD Million) by Type (2018-2022)
8.5.3 South America Intimate Apparel Revenue (USD Million) by Applications (2018-2022)
8.6 Middle East and Africa Intimate Apparel Revenue (USD Million), by Type, Technology, Application, Thickness (2018-2022)
8.6.1 Middle East and Africa Intimate Apparel Revenue (USD Million) by Country (2018-2022)
8.6.2 Middle East and Africa Intimate Apparel Revenue (USD Million) by Type (2018-2022)
8.6.3 Middle East and Africa Intimate Apparel Revenue (USD Million) by Applications (2018-2022)
9 Company Profiles
10 Global Intimate Apparel Market Revenue (USD Million), by Type, and Applications (2023-2030)
10.1 Global Intimate Apparel Revenue (USD Million) and Market Share (%) by Type (2023-2030)
10.1.1 Global Intimate Apparel Revenue (USD Million), and Market Share (%) by Type (2023-2030)
10.2 Global Intimate Apparel Revenue (USD Million) and Market Share (%) by Applications (2023-2030)
10.2.1 Global Intimate Apparel Revenue (USD Million), and Market Share (%) by Applications (2023-2030)
11 Global Intimate Apparel Development Regional Status and Outlook Forecast
11.1 Global Intimate Apparel Revenue (USD Million) By Regions (2023-2030)
11.2 North America Intimate Apparel Revenue (USD Million) by Type, and Applications (2023-2030)
11.2.1 North America Intimate Apparel Revenue (USD) Million by Country (2023-2030)
11.2.2 North America Intimate Apparel Revenue (USD Million), by Type (2023-2030)
11.2.3 North America Intimate Apparel Revenue (USD Million), Market Share (%) by Applications (2023-2030)
11.3 Europe Intimate Apparel Revenue (USD Million), by Type, and Applications (2023-2030)
11.3.1 Europe Intimate Apparel Revenue (USD Million), by Country (2023-2030)
11.3.2 Europe Intimate Apparel Revenue (USD Million), by Type (2023-2030)
11.3.3 Europe Intimate Apparel Revenue (USD Million), by Applications (2023-2030)
11.4 Asia Pacific Intimate Apparel Revenue (USD Million) by Type, and Applications (2023-2030)
11.4.1 Asia Pacific Intimate Apparel Revenue (USD Million), by Country (2023-2030)
11.4.2 Asia Pacific Intimate Apparel Revenue (USD Million), by Type (2023-2030)
11.4.3 Asia Pacific Intimate Apparel Revenue (USD Million), by Applications (2023-2030)
11.5 South America Intimate Apparel Revenue (USD Million), by Type, and Applications (2023-2030)
11.5.1 South America Intimate Apparel Revenue (USD Million), by Country (2023-2030)
11.5.2 South America Intimate Apparel Revenue (USD Million), by Type (2023-2030)
11.5.3 South America Intimate Apparel Revenue (USD Million), by Applications (2023-2030)
11.6 Middle East and Africa Intimate Apparel Revenue (USD Million), by Type, and Applications (2023-2030)
11.6.1 Middle East and Africa Intimate Apparel Revenue (USD Million), by Region (2023-2030)
11.6.2 Middle East and Africa Intimate Apparel Revenue (USD Million), by Type (2023-2030)
11.6.3 Middle East and Africa Intimate Apparel Revenue (USD Million), by Applications (2023-2030)
12 Methodology and Data Sources
12.1 Methodology/Research Approach
12.1.1 Research Programs/Design
12.1.2 Market Size Estimation
12.1.3 Market Breakdown and Data Triangulation
12.2 Data Sources
12.2.1 Secondary Sources
12.2.2 Primary Sources
12.3 Disclaimer
List of Tables
Table 1 Market Segmentation Analysis
Table 2 Global Intimate Apparel Market Companies with Areas Served
Table 3 Products Offerings Global Intimate Apparel Market
Table 4 Low Growth Scenario Forecasts
Table 5 Reference Case Growth Scenario
Table 6 High Growth Case Scenario
Table 7 Global Intimate Apparel Revenue (USD Million) And CAGR (%) By Type (2018-2030)
Table 8 Global Intimate Apparel Revenue (USD Million) And CAGR (%) By Applications (2018-2030)
Table 9 Global Intimate Apparel Revenue (USD Million) And CAGR (%) By Regions (2018-2030)
Table 10 Global Intimate Apparel Revenue (USD Million) By Type (2018-2022)
Table 11 Global Intimate Apparel Revenue Market Share (%) By Type (2018-2022)
Table 12 Global Intimate Apparel Revenue (USD Million) By Applications (2018-2022)
Table 13 Global Intimate Apparel Revenue Market Share (%) By Applications (2018-2022)
Table 14 Global Intimate Apparel Market Revenue (USD Million) By Regions (2018-2022)
Table 15 Global Intimate Apparel Market Share (%) By Regions (2018-2022)
Table 16 North America Intimate Apparel Revenue (USD Million) By Country (2018-2022)
Table 17 North America Intimate Apparel Revenue (USD Million) By Type (2018-2022)
Table 18 North America Intimate Apparel Revenue (USD Million) By Applications (2018-2022)
Table 19 Europe Intimate Apparel Revenue (USD Million) By Country (2018-2022)
Table 20 Europe Intimate Apparel Revenue (USD Million) By Type (2018-2022)
Table 21 Europe Intimate Apparel Revenue (USD Million) By Applications (2018-2022)
Table 22 Asia Pacific Intimate Apparel Revenue (USD Million) By Country (2018-2022)
Table 23 Asia Pacific Intimate Apparel Revenue (USD Million) By Type (2018-2022)
Table 24 Asia Pacific Intimate Apparel Revenue (USD Million) By Applications (2018-2022)
Table 25 South America Intimate Apparel Revenue (USD Million) By Country (2018-2022)
Table 26 South America Intimate Apparel Revenue (USD Million) By Type (2018-2022)
Table 27 South America Intimate Apparel Revenue (USD Million) By Applications (2018-2022)
Table 28 Middle East and Africa Intimate Apparel Revenue (USD Million) By Region (2018-2022)
Table 29 Middle East and Africa Intimate Apparel Revenue (USD Million) By Type (2018-2022)
Table 30 Middle East and Africa Intimate Apparel Revenue (USD Million) By Applications (2018-2022)
Table 31 Financial Analysis
Table 32 Global Intimate Apparel Revenue (USD Million) By Type (2023-2030)
Table 33 Global Intimate Apparel Revenue Market Share (%) By Type (2023-2030)
Table 34 Global Intimate Apparel Revenue (USD Million) By Applications (2023-2030)
Table 35 Global Intimate Apparel Revenue Market Share (%) By Applications (2023-2030)
Table 36 Global Intimate Apparel Market Revenue (USD Million), And Revenue (USD Million) By Regions (2023-2030)
Table 37 North America Intimate Apparel Revenue (USD)By Country (2023-2030)
Table 38 North America Intimate Apparel Revenue (USD Million) By Type (2023-2030)
Table 39 North America Intimate Apparel Revenue (USD Million) By Applications (2023-2030)
Table 40 Europe Intimate Apparel Revenue (USD Million) By Country (2023-2030)
Table 41 Europe Intimate Apparel Revenue (USD Million) By Type (2023-2030)
Table 42 Europe Intimate Apparel Revenue (USD Million) By Applications (2023-2030)
Table 43 Asia Pacific Intimate Apparel Revenue (USD Million) By Country (2023-2030)
Table 44 Asia Pacific Intimate Apparel Revenue (USD Million) By Type (2023-2030)
Table 45 Asia Pacific Intimate Apparel Revenue (USD Million) By Applications (2023-2030)
Table 46 South America Intimate Apparel Revenue (USD Million) By Country (2023-2030)
Table 47 South America Intimate Apparel Revenue (USD Million) By Type (2023-2030)
Table 48 South America Intimate Apparel Revenue (USD Million) By Applications (2023-2030)
Table 49 Middle East and Africa Intimate Apparel Revenue (USD Million) By Region (2023-2030)
Table 50 Middle East and Africa Intimate Apparel Revenue (USD Million) By Region (2023-2030)
Table 51 Middle East and Africa Intimate Apparel Revenue (USD Million) By Type (2023-2030)
Table 52 Middle East and Africa Intimate Apparel Revenue (USD Million) By Applications (2023-2030)
Table 53 Research Programs/Design for This Report
Table 54 Key Data Information from Secondary Sources
Table 55 Key Data Information from Primary Sources
List of Figures
Figure 1 Market Scope
Figure 2 Porter’s Five Forces
Figure 3 Global Intimate Apparel Revenue (USD Million) By Type (2018-2022)
Figure 4 Global Intimate Apparel Revenue Market Share (%) By Type (2022)
Figure 5 Global Intimate Apparel Revenue (USD Million) By Applications (2018-2022)
Figure 6 Global Intimate Apparel Revenue Market Share (%) By Applications (2022)
Figure 7 Global Intimate Apparel Market Revenue (USD Million) By Regions (2018-2022)
Figure 8 Global Intimate Apparel Market Share (%) By Regions (2022)
Figure 9 North America Intimate Apparel Revenue (USD Million) By Country (2018-2022)
Figure 10 North America Intimate Apparel Revenue (USD Million) By Type (2018-2022)
Figure 11 North America Intimate Apparel Revenue (USD Million) By Applications (2018-2022)
Figure 12 Europe Intimate Apparel Revenue (USD Million) By Country (2018-2022)
Figure 13 Europe Intimate Apparel Revenue (USD Million) By Type (2018-2022)
Figure 14 Europe Intimate Apparel Revenue (USD Million) By Applications (2018-2022)
Figure 15 Asia Pacific Intimate Apparel Revenue (USD Million) By Country (2018-2022)
Figure 16 Asia Pacific Intimate Apparel Revenue (USD Million) By Type (2018-2022)
Figure 17 Asia Pacific Intimate Apparel Revenue (USD Million) By Applications (2018-2022)
Figure 18 South America Intimate Apparel Revenue (USD Million) By Country (2018-2022)
Figure 19 South America Intimate Apparel Revenue (USD Million) By Type (2018-2022)
Figure 20 South America Intimate Apparel Revenue (USD Million) By Applications (2018-2022)
Figure 21 Middle East and Africa Intimate Apparel Revenue (USD Million) By Region (2018-2022)
Figure 22 Middle East and Africa Intimate Apparel Revenue (USD Million) By Type (2018-2022)
Figure 23 Middle East and Africa Intimate Apparel Revenue (USD Million) By Applications (2018-2022)
Figure 24 Global Intimate Apparel Revenue (USD Million) By Type (2023-2030)
Figure 25 Global Intimate Apparel Revenue Market Share (%) By Type (2030)
Figure 26 Global Intimate Apparel Revenue (USD Million) By Applications (2023-2030)
Figure 27 Global Intimate Apparel Revenue Market Share (%) By Applications (2030)
Figure 28 Global Intimate Apparel Market Revenue (USD Million) By Regions (2023-2030)
Figure 29 North America Intimate Apparel Revenue (USD Million) By Country (2023-2030)
Figure 30 North America Intimate Apparel Revenue (USD Million) By Type (2023-2030)
Figure 31 North America Intimate Apparel Revenue (USD Million) By Applications (2023-2030)
Figure 32 Europe Intimate Apparel Revenue (USD Million) By Country (2023-2030)
Figure 33 Europe Intimate Apparel Revenue (USD Million) By Type (2023-2030)
Figure 34 Europe Intimate Apparel Revenue (USD Million) By Applications (2023-2030)
Figure 35 Asia Pacific Intimate Apparel Revenue (USD Million) By Country (2023-2030)
Figure 36 Asia Pacific Intimate Apparel Revenue (USD Million) By Type (2023-2030)
Figure 37 Asia Pacific Intimate Apparel Revenue (USD Million) By Applications (2023-2030)
Figure 38 South America Intimate Apparel Revenue (USD Million) By Country (2023-2030)
Figure 39 South America Intimate Apparel Revenue (USD Million) By Type (2023-2030)
Figure 40 South America Intimate Apparel Revenue (USD Million) By Applications (2023-2030)
Figure 41 Middle East and Africa Intimate Apparel Revenue (USD Million) By Region (2023-2030)
Figure 42 Middle East and Africa Intimate Apparel Revenue (USD Million) By Region (2023-2030)
Figure 43 Middle East and Africa Intimate Apparel Revenue (USD Million) By Type (2023-2030)
Figure 44 Middle East and Africa Intimate Apparel Revenue (USD Million) By Applications (2023-2030)
Figure 45 Bottom-Up and Top-Down Approaches For This Report
Figure 46 Data Triangulation
