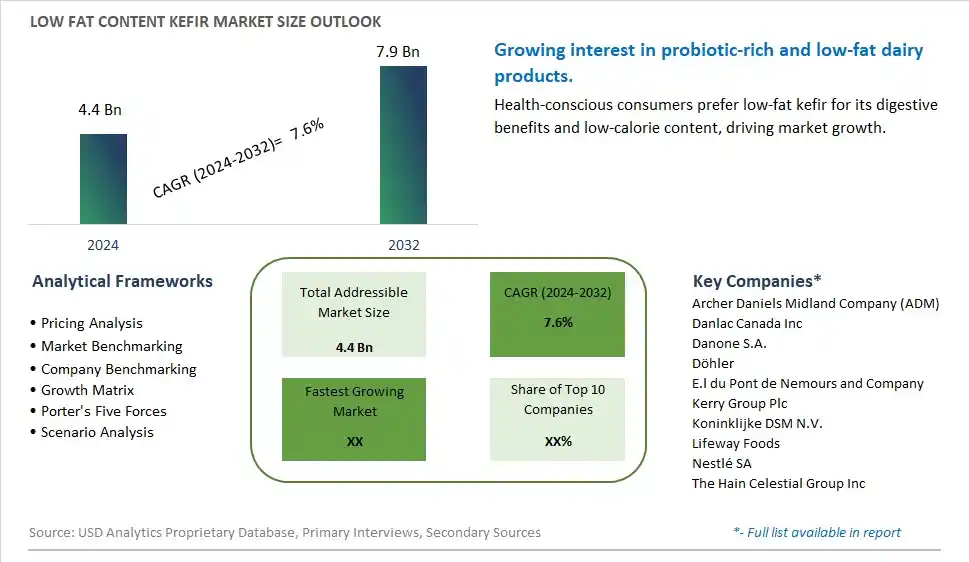
Global Low Fat Content Kefir Market Size is valued at $4.4 Billion in 2024 and is forecast to register a growth rate (CAGR) of 7.6% to reach $7.9 Billion by 2032.
The global Low Fat Content Kefir Market Comprehensive Study analyzes and forecasts the market size across 6 regions and 24 countries for diverse segments -By Type (Regular, Flavored), By Application (Dietary Supplements, Sauces and Dips, Drinks and Smoothies, Pharmaceuticals, Others)
An Introduction to Low Fat Content Kefir Market
In 2024, the low fat content kefir market is thriving, fueled by the demand for probiotic-rich dairy products that support digestive health while offering a lower fat content. Low fat kefir, made from fermented milk, provides a good source of probiotics, vitamins, and minerals. The market benefits from advancements in fermentation and dairy processing technologies that enhance taste, texture, and nutritional value. The trend towards clean label and natural ingredients is influencing product development. Increasing consumer interest in gut health and the popularity of functional dairy products are further propelling market growth.
Low Fat Content Kefir Competitive Landscape
The market report analyses the leading companies in the industry including Archer Daniels Midland Company (ADM), Danlac Canada Inc, Danone S.A., Döhler, E.l du Pont de Nemours and Company, Kerry Group Plc, Koninklijke DSM N.V., Lifeway Foods, Nestlé SA, The Hain Celestial Group Inc, and Others.
Low Fat Content Kefir Market Dynamics
Low Fat Content Kefir Market Trend: Increasing Demand for Probiotic and Functional Dairy Products
The most prominent trend in the Low Fat Content Kefir Market is the increasing demand for probiotic and functional dairy products. Consumers are seeking kefir for its probiotic benefits, which support gut health and overall wellness, while preferring low-fat options to manage their caloric intake. This trend is driven by the growing awareness of the importance of gut microbiota.
Low Fat Content Kefir Market Driver: Health Consciousness and Nutritional Benefits
A key driver in the Low Fat Content Kefir Market is health consciousness and the recognized nutritional benefits of kefir. As more individuals focus on improving their diet and incorporating probiotics, there is a rising demand for low-fat kefir that offers digestive health benefits and essential nutrients. This demand supports market growth as consumers seek functional and health-enhancing dairy products.
Low Fat Content Kefir Market Opportunity: Innovation in Flavor and Nutritional Enhancements
One significant opportunity in the Low Fat Content Kefir Market lies in innovation in flavor and nutritional enhancements. Companies can develop new kefir products that offer unique flavors, such as fruit-infused or herb-blended varieties, and include additional health benefits, such as added vitamins and minerals. By offering diverse and health-focused kefir options, manufacturers can attract a broader consumer base and drive market growth.
Low Fat Content Kefir Market Share Analysis- Largest Segment by Type
In the Low Fat Content Kefir Market, the Regular type is the largest segment. Regular low-fat kefir is favored for its traditional flavor and consistency, which appeals to a broad consumer base. It is commonly used as a nutritious beverage and a base for various recipes. The established consumer preference for the traditional taste and texture of regular kefir, coupled with its versatility and health benefits, contributes to its dominance in the market.
Low Fat Content Kefir Market Share Analysis- Poised to Grow Fastest Over the Next Five Years by Application
In the Low Fat Content Kefir Market, the Drinks and Smoothies application segment is poised to grow the fastest over the next five years. This growth is driven by the increasing consumer interest in health-conscious beverages that offer nutritional benefits without excessive calories or fat. Low-fat kefir is increasingly used in smoothies and drinks due to its probiotic content and health benefits. The trend towards functional foods and beverages that support digestive health and overall wellness fuels the expansion of this segment.
Low Fat Content Kefir Market Segmentation
By Type
Regular
Flavored
By Application
Dietary Supplements
Sauces and Dips
Drinks and Smoothies
Pharmaceuticals
Others
Countries Analyzed
North America (US, Canada, Mexico)
Europe (Germany, UK, France, Spain, Italy, Russia, Rest of Europe)
Asia Pacific (China, India, Japan, South Korea, Australia, South East Asia, Rest of Asia)
South America (Brazil, Argentina, Rest of South America)
Middle East and Africa (Saudi Arabia, UAE, Rest of Middle East, South Africa, Egypt, Rest of Africa)
Low Fat Content Kefir Companies Profiled in the Study
Archer Daniels Midland Company (ADM)
Danlac Canada Inc
Danone S.A.
Döhler
E.l du Pont de Nemours and Company
Kerry Group Plc
Koninklijke DSM N.V.
Lifeway Foods
Nestlé SA
The Hain Celestial Group Inc
*- List Not Exhaustive
Chapter 1. TABLE OF CONTENTS
Chapter 2. Introduction to Low Fat Content Kefir Market
2.1. Market Overview
2.2. Key Statistics and Report Highlights
2.3. Scope of the Comprehensive Study
2.3.1. Market Definition
2.3.2 Countries and Regions Covered
2.3.3 Research Objective
2.3.4 Units, Currency, and Conversions
2.3.5 Industry Value Chain
2.4. Key Market Segments
2.5. Key Companies
2.6. Study Period
Chapter 3. Strategic Analysis Review
3.1. Low Fat Content Kefir Pricing Analysis and Forecast
3.2. Porter’s Five Forces
3.3. Market Ecosystem
3.4. SWOT Analysis
3.5. Regulatory Scenario
3.3. Effects of Inflation, Russia-Ukraine War, moderating economic growth, and other macroeconomic factors
Chapter 4. Competitive Landscape
4.1. Market Share Analysis
4.1.1. Global Low Fat Content Kefir Market Share by Company, 2023
4.1.2. Product Offerings of Leading Low Fat Content Kefir Companies
4.2. Market Entropy
4.2.1. New Product Launches in the Industry
4.2.2. Mergers, Acquisitions, Joint ventures, and Partnerships
4.3. Key Strategies and Best Practices
Chapter 5. Global Market Projections: Best, Reference, and Low Case Scenarios
5.1. Growth Analysis- Case Scenario Definitions
5.2. Low Growth Case Scenario Forecasts
5.3. Reference Growth Case Scenario Forecasts
5.4. High Growth Case Scenario Forecasts
Chapter 6. Market Dynamics
6.1. Low Fat Content Kefir Market Drivers
6.2. Low Fat Content Kefir Market Challenges
6.6. Low Fat Content Kefir Market Opportunities
6.4. Low Fat Content Kefir Market Trends
Chapter 7. Global Low Fat Content Kefir Market Outlook Trends
7.1. Global Low Fat Content Kefir Revenue (USD Million) and CAGR (%) by Type (2021-2032)
7.2. Global Low Fat Content Kefir Revenue (USD Million) and CAGR (%) by Application (2021-2032)
7.3. Global Low Fat Content Kefir Revenue (USD Million) and CAGR (%) by Product (2021-2032)
By Type
Regular
Flavored
By Application
Dietary Supplements
Sauces and Dips
Drinks and Smoothies
Pharmaceuticals
Others
Chapter 8. Global Low Fat Content Kefir Regional Analysis and Outlook
8.1. Global Low Fat Content Kefir Revenue (USD Million) By Regions (2021- 2032)
8.2. North America Low Fat Content Kefir Revenue (USD Million) by Country (2021-2032)
8.2.1. United States Low Fat Content Kefir Regional Analysis and Outlook
8.2.2. Canada Low Fat Content Kefir Regional Analysis and Outlook
8.2.3. Mexico Low Fat Content Kefir Regional Analysis and Outlook
8.3. Europe Low Fat Content Kefir Revenue (USD Million), by Country (2021-2032)
8.3.1. Germany Low Fat Content Kefir Regional Analysis and Outlook
8.3.2. France Low Fat Content Kefir Regional Analysis and Outlook
8.3.3. United Kingdom Low Fat Content Kefir Regional Analysis and Outlook
8.3.4. Spain Low Fat Content Kefir Regional Analysis and Outlook
8.3.5. Italy Low Fat Content Kefir Regional Analysis and Outlook
8.3.6. Russia Low Fat Content Kefir Regional Analysis and Outlook
8.3.7. Rest of Europe Low Fat Content Kefir Regional Analysis and Outlook
8.4. Asia Pacific Low Fat Content Kefir Revenue (USD Million) by Country (2021-2032)
8.4.1. China Low Fat Content Kefir Regional Analysis and Outlook
8.4.2. Japan Low Fat Content Kefir Regional Analysis and Outlook
8.4.3. India Low Fat Content Kefir Regional Analysis and Outlook
8.4.4. South Korea Low Fat Content Kefir Regional Analysis and Outlook
8.4.5. Australia Low Fat Content Kefir Regional Analysis and Outlook
8.4.6. South East Asia Low Fat Content Kefir Regional Analysis and Outlook
8.4.7. Rest of Asia Pacific Low Fat Content Kefir Regional Analysis and Outlook
8.5. South America Low Fat Content Kefir Revenue (USD Million), by Country (2021-2032)
8.5.1. Brazil Low Fat Content Kefir Regional Analysis and Outlook
8.5.2. Argentina Low Fat Content Kefir Regional Analysis and Outlook
8.5.3. Rest of South America Low Fat Content Kefir Regional Analysis and Outlook
8.6. Middle East and Africa Low Fat Content Kefir Revenue (USD Million) by Country (2021-2032)
8.6.1. Middle East Low Fat Content Kefir Regional Analysis and Outlook
8.6.2. Africa Low Fat Content Kefir Regional Analysis and Outlook
Chapter 9. North America Low Fat Content Kefir Analysis and Outlook
9.1. North America Low Fat Content Kefir Revenue (USD Million) by Segments (2021-2032)
9.1.1. North America Low Fat Content Kefir Revenue (USD Million) by Type (2021-2032)
9.1.2. North America Low Fat Content Kefir Revenue (USD Million) by Application (2021-2032)
9.1.3. North America Low Fat Content Kefir Revenue (USD Million) by Product (2021-2032)
By Type
Regular
Flavored
By Application
Dietary Supplements
Sauces and Dips
Drinks and Smoothies
Pharmaceuticals
Others
Chapter 10. Europe Low Fat Content Kefir Analysis and Outlook
10.1. Europe Low Fat Content Kefir Revenue (USD Million), by Segments (USD Million) (2021-2032)
10.1.1. Europe Low Fat Content Kefir Revenue (USD Million) by Type (2021-2032)
10.1.2. Europe Low Fat Content Kefir Revenue (USD Million) by Application (2021-2032)
10.1.3. Europe Low Fat Content Kefir Revenue (USD Million) by Product (2021-2032)
By Type
Regular
Flavored
By Application
Dietary Supplements
Sauces and Dips
Drinks and Smoothies
Pharmaceuticals
Others
Chapter 11. Asia Pacific Low Fat Content Kefir Analysis and Outlook
11.1. Asia Pacific Low Fat Content Kefir Revenue (USD Million), and Revenue (USD Million) by Segments (2021-2032)
11.1.1. Asia Pacific Low Fat Content Kefir Revenue (USD Million) by Type (2021-2032)
11.1.2. Asia Pacific Low Fat Content Kefir Revenue (USD Million) by Application (2021-2032)
11.1.3. Asia Pacific Low Fat Content Kefir Revenue (USD Million) by Product (2021-2032)
By Type
Regular
Flavored
By Application
Dietary Supplements
Sauces and Dips
Drinks and Smoothies
Pharmaceuticals
Others
Chapter 12. South America Low Fat Content Kefir Analysis and Outlook
12.1. South America Low Fat Content Kefir Revenue (USD Million), by Segments (2021-2032)
12.1.1. South America Low Fat Content Kefir Revenue (USD Million) by Type (2021-2032)
12.1.2. South America Low Fat Content Kefir Revenue (USD Million) by Application (2021-2032)
12.1.3. South America Low Fat Content Kefir Revenue (USD Million) by Product (2021-2032)
By Type
Regular
Flavored
By Application
Dietary Supplements
Sauces and Dips
Drinks and Smoothies
Pharmaceuticals
Others
Chapter 13. Middle East and Africa Low Fat Content Kefir Analysis and Outlook
13.1. Middle East and Africa Low Fat Content Kefir Revenue (USD Million), by Segments (2021-2032)
13.1.1. Middle East and Africa Low Fat Content Kefir Revenue (USD Million) by Type (2021-2032)
13.1.2. Middle East and Africa Low Fat Content Kefir Revenue (USD Million) by Application (2021-2032)
13.1.3. Middle East and Africa Low Fat Content Kefir Revenue (USD Million) by Product (2021-2032)
By Type
Regular
Flavored
By Application
Dietary Supplements
Sauces and Dips
Drinks and Smoothies
Pharmaceuticals
Others
Chapter 14. Low Fat Content Kefir Company Profiles
14.1 Business Overview
14.2 Product Profiles
14.3 SWOT Profiles
14.5 Recent Developments
14.6 Financial Profile
List of Companies
Archer Daniels Midland Company (ADM)
Danlac Canada Inc
Danone S.A.
Döhler
E.l du Pont de Nemours and Company
Kerry Group Plc
Koninklijke DSM N.V.
Lifeway Foods
Nestlé SA
The Hain Celestial Group Inc
15. Methodology and Data Sources
15.1 Customization Offerings
15.2 Subscription Services
15.3 Related Reports
15.4 Publisher Expertise
LIST OF TABLES
Table 1 Market Segmentation Analysis
Table 2 Global Low Fat Content Kefir Market Share of Leading Companies, 2023
Table 3 Product Offerings of Leading Companies
Table 4 Low Growth Scenario Forecasts
Table 5 Reference Case Growth Scenario
Table 6 High Growth Case Scenario
Table 7 Global Low Fat Content Kefir Revenue (USD Million) And CAGR (%) By Type (2021-2032)
Table 8 Global Low Fat Content Kefir Revenue (USD Million) And CAGR (%) By Application (2021-2032)
Table 9 Global Low Fat Content Kefir Revenue (USD Million) And CAGR (%) By Product (2021-2032)
Table 10 Global Low Fat Content Kefir Market Revenue (USD Million) By Regions (2021-2032)
Table 11 Global Low Fat Content Kefir Market Share (%) By Regions (2021-2032)
Table 12 North America Low Fat Content Kefir Revenue (USD Million) By Country (2021-2032)
Table 13 Europe Low Fat Content Kefir Revenue (USD Million) By Country (2021-2032)
Table 14 Asia Pacific Low Fat Content Kefir Revenue (USD Million) By Country (2021-2032)
Table 15 South America Low Fat Content Kefir Revenue (USD Million) By Country (2021-2032)
Table 16 Middle East and Africa Low Fat Content Kefir Revenue (USD Million) By Region (2021-2032)
Table 17 North America Low Fat Content Kefir Revenue (USD Million) By Type (2021-2032)
Table 18 North America Low Fat Content Kefir Revenue (USD Million) By Application (2021-2032)
Table 19 North America Low Fat Content Kefir Revenue (USD Million) By Product (2021-2032)
Table 20 Europe Low Fat Content Kefir Revenue (USD Million) By Type (2021-2032)
Table 21 Europe Low Fat Content Kefir Revenue (USD Million) By Application (2021-2032)
Table 22 Europe Low Fat Content Kefir Revenue (USD Million) By Product (2021-2032)
Table 23 Asia Pacific Low Fat Content Kefir Revenue (USD Million) By Type (2021-2032)
Table 24 Asia Pacific Low Fat Content Kefir Revenue (USD Million) By Application (2021-2032)
Table 25 Asia Pacific Low Fat Content Kefir Revenue (USD Million) By Product (2021-2032)
Table 26 South America Low Fat Content Kefir Revenue (USD Million) By Type (2021-2032)
Table 27 South America Low Fat Content Kefir Revenue (USD Million) By Application (2021-2032)
Table 28 South America Low Fat Content Kefir Revenue (USD Million) By Product (2021-2032)
Table 29 Middle East and Africa Low Fat Content Kefir Revenue (USD Million) By Type (2021-2032)
Table 30 Middle East and Africa Low Fat Content Kefir Revenue (USD Million) By Application (2021-2032)
Table 31 Middle East and Africa Low Fat Content Kefir Revenue (USD Million) By Product (2021-2032)
LIST OF FIGURES
Figure 1. Market Scope
Figure 2. Pricing Forecasts Per Unit, 2023- 2032
Figure 3. Porter’s Five Forces
Figure 4. Global Low Fat Content Kefir Market Revenue (USD Million) By Regions (2021-2032)
Figure 5. Global Low Fat Content Kefir Market Share (%) By Regions (2023)
Figure 6. North America Low Fat Content Kefir Revenue (USD Million) By Country (2021-2032)
Figure 7. United States Low Fat Content Kefir Revenue (USD Million) By Country (2021-2032)
Figure 8. Canada Low Fat Content Kefir Revenue (USD Million) By Country (2021-2032)
Figure 9. Mexico Low Fat Content Kefir Revenue (USD Million) By Country (2021-2032)
Figure 10. Europe Low Fat Content Kefir Revenue (USD Million) By Country (2021-2032)
Figure 11. Germany Low Fat Content Kefir Revenue (USD Million) By Country (2021-2032)
Figure 12. France Low Fat Content Kefir Revenue (USD Million) By Country (2021-2032)
Figure 13. United Kingdom Low Fat Content Kefir Revenue (USD Million) By Country (2021-2032)
Figure 14. Spain Low Fat Content Kefir Revenue (USD Million) By Country (2021-2032)
Figure 15. Italy Low Fat Content Kefir Revenue (USD Million) By Country (2021-2032)
Figure 16. Russia Low Fat Content Kefir Revenue (USD Million) By Country (2021-2032)
Figure 17. Rest of Europe Low Fat Content Kefir Revenue (USD Million) By Country (2021-2032)
Figure 11. Asia Pacific Low Fat Content Kefir Revenue (USD Million) By Country (2021-2032)
Figure 12. China Low Fat Content Kefir Revenue (USD Million) By Country (2021-2032)
Figure 13. Japan Low Fat Content Kefir Revenue (USD Million) By Country (2021-2032)
Figure 14. India Low Fat Content Kefir Revenue (USD Million) By Country (2021-2032)
Figure 15. South Korea Low Fat Content Kefir Revenue (USD Million) By Country (2021-2032)
Figure 16. Australia Low Fat Content Kefir Revenue (USD Million) By Country (2021-2032)
Figure 17. South East Asia Low Fat Content Kefir Revenue (USD Million) By Country (2021-2032)
Figure 18. South America Low Fat Content Kefir Revenue (USD Million) By Country (2021-2032)
Figure 19. Brazil Low Fat Content Kefir Revenue (USD Million) By Country (2021-2032)
Figure 20. Argentina Low Fat Content Kefir Revenue (USD Million) By Country (2021-2032)
Figure 21. Rest of Asia Pacific Low Fat Content Kefir Revenue (USD Million) By Country (2021-2032)
Figure 22. Middle East and Africa Low Fat Content Kefir Revenue (USD Million) By Region (2021-2032)
Figure 23. Saudi Arabia Low Fat Content Kefir Revenue (USD Million) By Region (2021-2032)
Figure 24. The UAE Low Fat Content Kefir Revenue (USD Million) By Region (2021-2032)
Figure 25. Rest of Middle East Low Fat Content Kefir Revenue (USD Million) By Region (2021-2032)
Figure 26. South Africa Low Fat Content Kefir Revenue (USD Million) By Region (2021-2032)
Figure 27. Africa Low Fat Content Kefir Revenue (USD Million) By Region (2021-2032)
Figure 28. North America Low Fat Content Kefir Revenue (USD Million) By Type (2021-2032)
Figure 29. North America Low Fat Content Kefir Revenue (USD Million) By Application (2021-2032)
Figure 30. North America Low Fat Content Kefir Revenue (USD Million) By Product (2021-2032)
Figure 31. Europe Low Fat Content Kefir Revenue (USD Million) By Type (2021-2032)
Figure 32. Europe Low Fat Content Kefir Revenue (USD Million) By Application (2021-2032)
Figure 33. Europe Low Fat Content Kefir Revenue (USD Million) By Product (2021-2032)
Figure 34. Asia Pacific Low Fat Content Kefir Revenue (USD Million) By Type (2021-2032)
Figure 35. Asia Pacific Low Fat Content Kefir Revenue (USD Million) By Application (2021-2032)
Figure 36. Asia Pacific Low Fat Content Kefir Revenue (USD Million) By Product (2021-2032)
Figure 37. South America Low Fat Content Kefir Revenue (USD Million) By Type (2021-2032)
Figure 38. South America Low Fat Content Kefir Revenue (USD Million) By Application (2021-2032)
Figure 39. South America Low Fat Content Kefir Revenue (USD Million) By Product (2021-2032)
Figure 40. Middle East and Africa Low Fat Content Kefir Revenue (USD Million) By Type (2021-2032)
Figure 41. Middle East and Africa Low Fat Content Kefir Revenue (USD Million) By Application (2021-2032)
Figure 42. Middle East and Africa Low Fat Content Kefir Revenue (USD Million) By Product (2021-2032)
By Type
Regular
Flavored
By Application
Dietary Supplements
Sauces and Dips
Drinks and Smoothies
Pharmaceuticals
Others
Countries Analyzed
North America (US, Canada, Mexico)
Europe (Germany, UK, France, Spain, Italy, Russia, Rest of Europe)
Asia Pacific (China, India, Japan, South Korea, Australia, South East Asia, Rest of Asia)
South America (Brazil, Argentina, Rest of South America)
Middle East and Africa (Saudi Arabia, UAE, Rest of Middle East, South Africa, Egypt, Rest of Africa)
