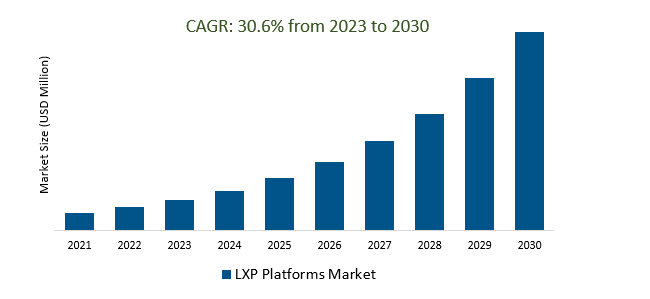
The Global LXP Platforms Market Size is estimated to register 30.6% growth over the forecast period from 2023 to 2030.
Market growth is being fueled by the rising trend of integrating Learning Experience Platforms (LXPs) with Human Resources and Talent Development systems, enabling a comprehensive approach to employee development and the alignment of learning with career advancement. Leading Companies focusing on AI-driven personalization, Continuous Learning and Upskilling, Interoperability and Ecosystem Integration, Learning Analytics and Predictive Insights, Virtual and Augmented Reality Integration, Global Expansion and Multilingual Support, and others to boost market shares in the industry.
Market Overview
The Learning Experience Platform (LXP) market is poised for growth, driven by the rising demand for personalized and adaptive learning experiences. LXPs will deepen their integration with Human Resources and Talent Development systems, promoting a holistic approach to employee development and career alignment. Content curation, user-generated content, mobile accessibility, and remote learning capabilities will remain key features. Advanced analytics, skills tracking, and multilingual support will enhance the learning experience. The integration of emerging technologies and a focus on diversity, equity, and inclusion in learning content will further shape the LXP landscape.
Market Dynamics
Market Trends- Personalization and adaptive learning are two key features of LXP platforms that enable learners to engage with content and learning experiences tailored to their individual needs and goals.
The LXP market places significant emphasis on personalization and adaptive learning. These key features are at the forefront of LXP platforms, catering to the diverse needs of contemporary learners. Personalization employs advanced algorithms to tailor learning content, pathways, and recommendations to individual users, ensuring alignment with their preferences and skill levels. Adaptive learning goes a step further, dynamically adjusting content and difficulty levels in real time based on a learner's progress, creating a highly responsive and effective learning journey.
Market Driver- The growing demand for LXP platforms is being driven by their integration with talent development and HR management systems.
The rising uptake of LXP platforms is primarily fueled by their effective incorporation into talent development and HR management systems. This integration serves to harmonize employee learning and skills enhancement with corporate objectives and workforce management tactics. LXPs are evolving into pivotal centers for ongoing learning and professional growth, fostering a comprehensive approach to employee development and career advancement. Consequently, organizations are increasingly acknowledging the substantial significance of these integrated platforms in equipping employees with the essential skills and proficiencies needed to excel in an ever-changing business environment.
Market Opportunity- LXP platforms provide learners with access to a curated library of high-quality content, as well as the ability to create and share their content, fostering a collaborative and engaging learning environment.
LXP platforms in 2023 offer learners access to a thoughtfully curated repository of premium learning materials. Additionally, they empower users to generate and distribute their content, cultivating a collaborative and interactive educational atmosphere. This dual approach encourages engagement and knowledge-sharing among learners, facilitating a dynamic and enriched learning experience that adapts to the individual needs and preferences of users.
Market Share Analysis- Self-paced LXP Platforms Market will register the fastest growth
The Global LXP Platforms Market is analyzed across Self-paced, Instructor-led, and others. Self-paced is poised to register the fastest growth. Self-paced Learning Experience Platform (LXP) solutions in 2023 offer flexible and convenient learning experiences that empower individuals to control their own learning pace and schedules. These platforms provide personalized learning, skill development, performance tracking, and cost-effective training options, making them a valuable choice for organizations and learners seeking scalability and on-demand resources. They accommodate diverse learning preferences and global accessibility, serving remote or dispersed learners, and are particularly suitable for compliance training and certification in regulated industries.
Market Share Analysis- Cloud-based held a significant market share in 2023
The Global LXP Platforms Market is analyzed across various Deployments including On-premise, Cloud-based, and others. Of these, Cloud-based held a significant market share in 2023. In 2023, the cloud-based Learning Experience Platform (LXP) market remains prominent, offering organizations scalable, accessible, and cost-efficient solutions for employee development and training. These platforms, hosted on the cloud, provide ease of maintenance, automatic updates, robust data security, and the ability to support remote and distributed learning. They foster collaborative learning, offer integration with other cloud-based tools, and feature real-time analytics to track learner progress and program effectiveness, making them essential in the modern digital work environment.
LXP Platforms Market News
Market Simplified Unveils Nitro XP, a Low-Code Application Platform for Financial Services, During the Fintech Festival India 2023.
In 2023, 13 Promising Crypto Launches Worth Considering for Investment. While the blockchain landscape is crowded with numerous crypto projects, only a select few truly offer substantial value to investors. Our analysts have carefully assessed a range of newly launched cryptocurrencies that not only deliver proven benefits to investors but also exhibit strong long-term potential.
LXP Platforms Market Segmentation
By Type
· Self-paced
· Instructor-led
By Deployment
· On-premise
· Cloud-based
By Enterprise Size
· SMEs
· Large Enterprise
By End User
· Academic
· Corporate
By Region
- North America (United States, Canada, Mexico)
- Europe (Germany, France, United Kingdom, Spain, Italy, Others)
- Asia Pacific (China, India, Japan, South Korea, Australia, Others)
- Latin America (Brazil, Argentina, Others)
- Middle East and Africa (Saudi Arabia, UAE, Kuwait, Other Middle East, South Africa, Nigeria, Other Africa)
LXP Platforms Market Companies
- 360Learning (France)
- Cornerstone OnDemand (United States)
- TalentLMS (United Kingdom)
- Docebo (Canada)
- Bridge by Instructure (United States)
- EdCast (United States)
- Pathgather (United States)
- Continu (United States)
- Fuse Universal (United Kingdom)
- EdApp (Australia)
- LearnUpon (Ireland)
*List not exhaustive
LXP Platforms Market Outlook 2023
1 Market Overview
1.1 Introduction to the LXP Platforms Market
1.2 Scope of the Study
1.3 Research Objective
1.3.1 Key Market Scope and Segments
1.3.2 Players Covered
1.3.3 Years Considered
2 Executive Summary
2.1 2023 LXP Platforms Industry- Market Statistics
3 Market Dynamics
3.1 Market Drivers
3.2 Market Challenges
3.3 Market Opportunities
3.4 Market Trends
4 Market Factor Analysis
4.1 Porter’s Five Forces
4.2 Market Entropy
4.2.1 Global LXP Platforms Market Companies with Area Served
4.2.2 Products Offerings Global LXP Platforms Market
5 COVID-19 Impact Analysis and Outlook Scenarios
5.1.1 Covid-19 Impact Analysis
5.1.2 post-COVID-19 Scenario- Low Growth Case
5.1.3 post-COVID-19 Scenario- Reference Growth Case
5.1.4 post-COVID-19 Scenario- Low Growth Case
6 Global LXP Platforms Market Trends
6.1 Global LXP Platforms Revenue (USD Million) and CAGR (%) by Type (2018-2030)
6.2 Global LXP Platforms Revenue (USD Million) and CAGR (%) by Applications (2018-2030)
6.3 Global LXP Platforms Revenue (USD Million) and CAGR (%) by regions (2018-2030)
7 Global LXP Platforms Market Revenue (USD Million) by Type, and Applications (2018-2022)
7.1 Global LXP Platforms Revenue (USD Million) by Type (2018-2022)
7.1.1 Global LXP Platforms Revenue (USD Million), Market Share (%) by Type (2018-2022)
7.2 Global LXP Platforms Revenue (USD Million) by Applications (2018-2022)
7.2.1 Global LXP Platforms Revenue (USD Million), Market Share (%) by Applications (2018-2022)
8 Global LXP Platforms Development Regional Status and Outlook
8.1 Global LXP Platforms Revenue (USD Million) By Regions (2018-2022)
8.2 North America LXP Platforms Revenue (USD Million) by Type, and Application (2018-2022)
8.2.1 North America LXP Platforms Revenue (USD Million) by Country (2018-2022)
8.2.2 North America LXP Platforms Revenue (USD Million) by Type (2018-2022)
8.2.3 North America LXP Platforms Revenue (USD Million) by Applications (2018-2022)
8.3 Europe LXP Platforms Revenue (USD Million), by Type, and Applications (USD Million) (2018-2022)
8.3.1 Europe LXP Platforms Revenue (USD Million), by Country (2018-2022)
8.3.2 Europe LXP Platforms Revenue (USD Million) by Type (2018-2022)
8.3.3 Europe LXP Platforms Revenue (USD Million) by Applications (2018-2022)
8.4 Asia Pacific LXP Platforms Revenue (USD Million), and Revenue (USD Million) by Type, and Applications (2018-2022)
8.4.1 Asia Pacific LXP Platforms Revenue (USD Million) by Country (2018-2022)
8.4.2 Asia Pacific LXP Platforms Revenue (USD Million) by Type (2018-2022)
8.4.3 Asia Pacific LXP Platforms Revenue (USD Million) by Applications (2018-2022)
8.5 South America LXP Platforms Revenue (USD Million), by Type, and Applications (2018-2022)
8.5.1 South America LXP Platforms Revenue (USD Million), by Country (2018-2022)
8.5.2 South America LXP Platforms Revenue (USD Million) by Type (2018-2022)
8.5.3 South America LXP Platforms Revenue (USD Million) by Applications (2018-2022)
8.6 Middle East and Africa LXP Platforms Revenue (USD Million), by Type, Technology, Application, Thickness (2018-2022)
8.6.1 Middle East and Africa LXP Platforms Revenue (USD Million) by Country (2018-2022)
8.6.2 Middle East and Africa LXP Platforms Revenue (USD Million) by Type (2018-2022)
8.6.3 Middle East and Africa LXP Platforms Revenue (USD Million) by Applications (2018-2022)
9 Company Profiles
10 Global LXP Platforms Market Revenue (USD Million), by Type, and Applications (2023-2030)
10.1 Global LXP Platforms Revenue (USD Million) and Market Share (%) by Type (2023-2030)
10.1.1 Global LXP Platforms Revenue (USD Million), and Market Share (%) by Type (2023-2030)
10.2 Global LXP Platforms Revenue (USD Million) and Market Share (%) by Applications (2023-2030)
10.2.1 Global LXP Platforms Revenue (USD Million), and Market Share (%) by Applications (2023-2030)
11 Global LXP Platforms Development Regional Status and Outlook Forecast
11.1 Global LXP Platforms Revenue (USD Million) By Regions (2023-2030)
11.2 North America LXP Platforms Revenue (USD Million) by Type, and Applications (2023-2030)
11.2.1 North America LXP Platforms Revenue (USD) Million by Country (2023-2030)
11.2.2 North America LXP Platforms Revenue (USD Million), by Type (2023-2030)
11.2.3 North America LXP Platforms Revenue (USD Million), Market Share (%) by Applications (2023-2030)
11.3 Europe LXP Platforms Revenue (USD Million), by Type, and Applications (2023-2030)
11.3.1 Europe LXP Platforms Revenue (USD Million), by Country (2023-2030)
11.3.2 Europe LXP Platforms Revenue (USD Million), by Type (2023-2030)
11.3.3 Europe LXP Platforms Revenue (USD Million), by Applications (2023-2030)
11.4 Asia Pacific LXP Platforms Revenue (USD Million) by Type, and Applications (2023-2030)
11.4.1 Asia Pacific LXP Platforms Revenue (USD Million), by Country (2023-2030)
11.4.2 Asia Pacific LXP Platforms Revenue (USD Million), by Type (2023-2030)
11.4.3 Asia Pacific LXP Platforms Revenue (USD Million), by Applications (2023-2030)
11.5 South America LXP Platforms Revenue (USD Million), by Type, and Applications (2023-2030)
11.5.1 South America LXP Platforms Revenue (USD Million), by Country (2023-2030)
11.5.2 South America LXP Platforms Revenue (USD Million), by Type (2023-2030)
11.5.3 South America LXP Platforms Revenue (USD Million), by Applications (2023-2030)
11.6 Middle East and Africa LXP Platforms Revenue (USD Million), by Type, and Applications (2023-2030)
11.6.1 Middle East and Africa LXP Platforms Revenue (USD Million), by region (2023-2030)
11.6.2 Middle East and Africa LXP Platforms Revenue (USD Million), by Type (2023-2030)
11.6.3 Middle East and Africa LXP Platforms Revenue (USD Million), by Applications (2023-2030)
12 Methodology and Data Sources
12.1 Methodology/Research Approach
12.1.1 Research Programs/Design
12.1.2 Market Size Estimation
12.1.3 Market Breakdown and Data Triangulation
12.2 Data Sources
12.2.1 Secondary Sources
12.2.2 Primary Sources
12.3 Disclaimer
List of Tables
Table 1 Market Segmentation Analysis
Table 2 Global LXP Platforms Market Companies with Areas Served
Table 3 Products Offerings Global LXP Platforms Market
Table 4 Low Growth Scenario Forecasts
Table 5 Reference Case Growth Scenario
Table 6 High Growth Case Scenario
Table 7 Global LXP Platforms Revenue (USD Million) And CAGR (%) By Type (2018-2030)
Table 8 Global LXP Platforms Revenue (USD Million) And CAGR (%) By Applications (2018-2030)
Table 9 Global LXP Platforms Revenue (USD Million) And CAGR (%) By Regions (2018-2030)
Table 10 Global LXP Platforms Revenue (USD Million) By Type (2018-2022)
Table 11 Global LXP Platforms Revenue Market Share (%) By Type (2018-2022)
Table 12 Global LXP Platforms Revenue (USD Million) By Applications (2018-2022)
Table 13 Global LXP Platforms Revenue Market Share (%) By Applications (2018-2022)
Table 14 Global LXP Platforms Market Revenue (USD Million) By Regions (2018-2022)
Table 15 Global LXP Platforms Market Share (%) By Regions (2018-2022)
Table 16 North America LXP Platforms Revenue (USD Million) By Country (2018-2022)
Table 17 North America LXP Platforms Revenue (USD Million) By Type (2018-2022)
Table 18 North America LXP Platforms Revenue (USD Million) By Applications (2018-2022)
Table 19 Europe LXP Platforms Revenue (USD Million) By Country (2018-2022)
Table 20 Europe LXP Platforms Revenue (USD Million) By Type (2018-2022)
Table 21 Europe LXP Platforms Revenue (USD Million) By Applications (2018-2022)
Table 22 Asia Pacific LXP Platforms Revenue (USD Million) By Country (2018-2022)
Table 23 Asia Pacific LXP Platforms Revenue (USD Million) By Type (2018-2022)
Table 24 Asia Pacific LXP Platforms Revenue (USD Million) By Applications (2018-2022)
Table 25 South America LXP Platforms Revenue (USD Million) By Country (2018-2022)
Table 26 South America LXP Platforms Revenue (USD Million) By Type (2018-2022)
Table 27 South America LXP Platforms Revenue (USD Million) By Applications (2018-2022)
Table 28 Middle East and Africa LXP Platforms Revenue (USD Million) By Region (2018-2022)
Table 29 Middle East and Africa LXP Platforms Revenue (USD Million) By Type (2018-2022)
Table 30 Middle East and Africa LXP Platforms Revenue (USD Million) By Applications (2018-2022)
Table 31 Financial Analysis
Table 32 Global LXP Platforms Revenue (USD Million) By Type (2023-2030)
Table 33 Global LXP Platforms Revenue Market Share (%) By Type (2023-2030)
Table 34 Global LXP Platforms Revenue (USD Million) By Applications (2023-2030)
Table 35 Global LXP Platforms Revenue Market Share (%) By Applications (2023-2030)
Table 36 Global LXP Platforms Market Revenue (USD Million), And Revenue (USD Million) By Regions (2023-2030)
Table 37 North America LXP Platforms Revenue (USD)By Country (2023-2030)
Table 38 North America LXP Platforms Revenue (USD Million) By Type (2023-2030)
Table 39 North America LXP Platforms Revenue (USD Million) By Applications (2023-2030)
Table 40 Europe LXP Platforms Revenue (USD Million) By Country (2023-2030)
Table 41 Europe LXP Platforms Revenue (USD Million) By Type (2023-2030)
Table 42 Europe LXP Platforms Revenue (USD Million) By Applications (2023-2030)
Table 43 Asia Pacific LXP Platforms Revenue (USD Million) By Country (2023-2030)
Table 44 Asia Pacific LXP Platforms Revenue (USD Million) By Type (2023-2030)
Table 45 Asia Pacific LXP Platforms Revenue (USD Million) By Applications (2023-2030)
Table 46 South America LXP Platforms Revenue (USD Million) By Country (2023-2030)
Table 47 South America LXP Platforms Revenue (USD Million) By Type (2023-2030)
Table 48 South America LXP Platforms Revenue (USD Million) By Applications (2023-2030)
Table 49 Middle East and Africa LXP Platforms Revenue (USD Million) By Region (2023-2030)
Table 50 Middle East and Africa LXP Platforms Revenue (USD Million) By Region (2023-2030)
Table 51 Middle East and Africa LXP Platforms Revenue (USD Million) By Type (2023-2030)
Table 52 Middle East and Africa LXP Platforms Revenue (USD Million) By Applications (2023-2030)
Table 53 Research Programs/Design for This Report
Table 54 Key Data Information from Secondary Sources
Table 55 Key Data Information from Primary Sources
List of Figures
Figure 1 Market Scope
Figure 2 Porter’s Five Forces
Figure 3 Global LXP Platforms Revenue (USD Million) By Type (2018-2022)
Figure 4 Global LXP Platforms Revenue Market Share (%) By Type (2022)
Figure 5 Global LXP Platforms Revenue (USD Million) By Applications (2018-2022)
Figure 6 Global LXP Platforms Revenue Market Share (%) By Applications (2022)
Figure 7 Global LXP Platforms Market Revenue (USD Million) By Regions (2018-2022)
Figure 8 Global LXP Platforms Market Share (%) By Regions (2022)
Figure 9 North America LXP Platforms Revenue (USD Million) By Country (2018-2022)
Figure 10 North America LXP Platforms Revenue (USD Million) By Type (2018-2022)
Figure 11 North America LXP Platforms Revenue (USD Million) By Applications (2018-2022)
Figure 12 Europe LXP Platforms Revenue (USD Million) By Country (2018-2022)
Figure 13 Europe LXP Platforms Revenue (USD Million) By Type (2018-2022)
Figure 14 Europe LXP Platforms Revenue (USD Million) By Applications (2018-2022)
Figure 15 Asia Pacific LXP Platforms Revenue (USD Million) By Country (2018-2022)
Figure 16 Asia Pacific LXP Platforms Revenue (USD Million) By Type (2018-2022)
Figure 17 Asia Pacific LXP Platforms Revenue (USD Million) By Applications (2018-2022)
Figure 18 South America LXP Platforms Revenue (USD Million) By Country (2018-2022)
Figure 19 South America LXP Platforms Revenue (USD Million) By Type (2018-2022)
Figure 20 South America LXP Platforms Revenue (USD Million) By Applications (2018-2022)
Figure 21 Middle East and Africa LXP Platforms Revenue (USD Million) By Region (2018-2022)
Figure 22 Middle East and Africa LXP Platforms Revenue (USD Million) By Type (2018-2022)
Figure 23 Middle East and Africa LXP Platforms Revenue (USD Million) By Applications (2018-2022)
Figure 24 Global LXP Platforms Revenue (USD Million) By Type (2023-2030)
Figure 25 Global LXP Platforms Revenue Market Share (%) By Type (2030)
Figure 26 Global LXP Platforms Revenue (USD Million) By Applications (2023-2030)
Figure 27 Global LXP Platforms Revenue Market Share (%) By Applications (2030)
Figure 28 Global LXP Platforms Market Revenue (USD Million) By Regions (2023-2030)
Figure 29 North America LXP Platforms Revenue (USD Million) By Country (2023-2030)
Figure 30 North America LXP Platforms Revenue (USD Million) By Type (2023-2030)
Figure 31 North America LXP Platforms Revenue (USD Million) By Applications (2023-2030)
Figure 32 Europe LXP Platforms Revenue (USD Million) By Country (2023-2030)
Figure 33 Europe LXP Platforms Revenue (USD Million) By Type (2023-2030)
Figure 34 Europe LXP Platforms Revenue (USD Million) By Applications (2023-2030)
Figure 35 Asia Pacific LXP Platforms Revenue (USD Million) By Country (2023-2030)
Figure 36 Asia Pacific LXP Platforms Revenue (USD Million) By Type (2023-2030)
Figure 37 Asia Pacific LXP Platforms Revenue (USD Million) By Applications (2023-2030)
Figure 38 South America LXP Platforms Revenue (USD Million) By Country (2023-2030)
Figure 39 South America LXP Platforms Revenue (USD Million) By Type (2023-2030)
Figure 40 South America LXP Platforms Revenue (USD Million) By Applications (2023-2030)
Figure 41 Middle East and Africa LXP Platforms Revenue (USD Million) By Region (2023-2030)
Figure 42 Middle East and Africa LXP Platforms Revenue (USD Million) By Region (2023-2030)
Figure 43 Middle East and Africa LXP Platforms Revenue (USD Million) By Type (2023-2030)
Figure 44 Middle East and Africa LXP Platforms Revenue (USD Million) By Applications (2023-2030)
Figure 45 Bottom-Up and Top-Down Approaches for This Report
Figure 46 Data Triangulation
