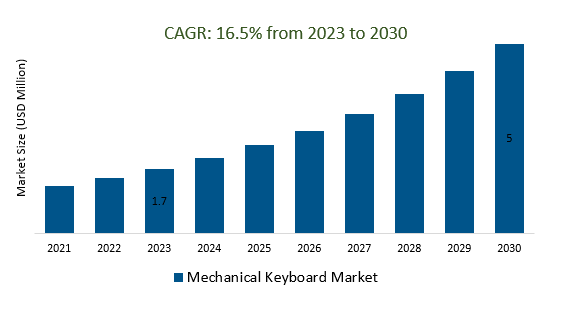
The Global Mechanical Keyboard Market size is estimated at $2.3 Billion in 2025 and is forecast to register an annual growth rate (CAGR) of 16.5% to reach $9.1 Billion by 2034
The market growth is driven by a growing demand for customizable mechanical keyboards with modular components, switch options, keycaps, and backlighting, allowing users to tailor their typing experience. Leading companies are focusing on Advanced Switch Technologies, Hybrid Keyboards, haptic feedback, AI, and Customization, Virtual Reality, and Augmented Reality, and others are boosting market shares in the industry.
Market Overview
The Mechanical Keyboard Market revolves around the production, distribution, and adoption of keyboards equipped with mechanical key switches, offering distinct tactile feedback and a satisfying typing experience. These keyboards have gained popularity due to their precise actuation, durability, and customization options. The market caters to a wide range of users, including gamers, professionals, enthusiasts, and general users seeking a premium typing solution. Key trends include advanced switch technology, customization features, ergonomic designs, wireless connectivity, and integration with other technologies. The market's growth is driven by the rise of gaming, remote work, ergonomic considerations, user demand for quality and customization, and the influence of online communities and reviews. As technology evolves and user preferences change, the Mechanical Keyboard Market continues to offer innovative solutions for improved typing experiences across various applications.
Market Dynamics
Market Trends- Companies are launching Wireless and Bluetooth to attract a consumer base
Wireless and Bluetooth technology in the Mechanical Keyboard Market pertains to the integration of wireless connectivity options into mechanical keyboards, offering users the freedom to connect and use their keyboards without physical cables. This technology enables keyboards to connect to devices such as computers, laptops, tablets, and smartphones via Bluetooth, eliminating the need for USB cables. Wireless and Bluetooth-enabled mechanical keyboards provide flexibility, portability, and a cleaner workspace setup, making them suitable for various applications, including gaming, remote work, and on-the-go typing. The trend towards wireless and Bluetooth mechanical keyboards is driven by the desire for clutter-free setups, improved mobility, and seamless connectivity with a range of devices.
The silent switches for the mechanical keyboard market, as of September 2021, is a growing niche within the broader mechanical keyboard industry. These switches aim to minimize the noise produced during typing by incorporating mechanisms like rubber dampeners and modified stem designs. They offer various levels of tactile feedback and customization options, making them suitable for quieter environments. Key players like Cherry, Gateron, and ZealPC provide a range of silent switch choices. The market is driven by the need for noise reduction in shared spaces, and users often rely on reviews and online communities for guidance.
Market Opportunity-Introduction of Gaming and eSports
The gaming and eSports segment of the mechanical keyboard market is a prominent and rapidly evolving sector. Characterized by the specific needs of gamers and professional eSports players, this market emphasizes features such as high-performance switches, customizable RGB lighting, responsive keypresses, and durable build quality. Mechanical keyboards tailored for gaming often utilize switches optimized for speed and accuracy, such as Cherry MX Red or similar variants, enabling quick actuation and reduced debounce times.
Market Share Analysis- Tactile Click Switches Mechanical Keyboard Market will register the significant growth
The global Mechanical Keyboard market is analyzed across Tactile Click Switches, Non-Tactile Linear Switches, Tactile Non-Click Switches, and Tactile Click Switches. Of these, Tactile Click Switches is poised to register the fastest growth. These switches offer a distinct tactile bump that helps users feel when a keypress has been registered, enhancing typing accuracy and speed. The auditory feedback from the click sound can also contribute to a satisfying typing experience. Tactile click switches are favored by typists who appreciate the feedback for touch typing and enthusiasts who enjoy the sensory aspect of mechanical keyboards. Brands like Cherry, Razer, and Gateron produce popular tactile click switch variants such as Cherry MX Blue and Razer Green switches. The market caters to various preferences, with different actuation forces and designs available.
Market Share Analysis- Industrial held a significant market share in 2024
The global Mechanical Keyboard market is analyzed across a wide range of applications including Gaming, and Industrial. Of these, Industrial held a significant market share in 2024. The industrial segment of the mechanical keyboard market caters to specialized requirements in professional and industrial settings. These keyboards are designed to withstand harsh environments, heavy usage, and specific use cases where durability and reliability are paramount. Industrial mechanical keyboards often feature ruggedized construction, sealed or water-resistant designs to resist dust and liquid ingress, and reinforced key switches to handle repetitive typing. They are commonly used in sectors like manufacturing, logistics, healthcare, and other industries where standard keyboards might not hold up under demanding conditions. The keys on these keyboards might be larger, more tactile, and resistant to wear. Backlit versions with adjustable brightness might be available for low-light environments. While aesthetics might take a backseat to functionality in this market segment, industrial mechanical keyboards play a crucial role in ensuring efficient operations in challenging work environments.
Mechanical Keyboard Market Segmentation
By Type
- Non-Tactile Linear Switches
- Tactile Non-Click Switches
- Tactile Click Switches
By Connectivity
- Wired Keyboards
- Wireless Keyboards
By Application
By Region
- North America (United States, Canada, Mexico)
- Europe (Germany, France, United Kingdom, Spain, Italy, Others)
- Asia Pacific (China, India, Japan, South Korea, Australia, Others)
- Latin America (Brazil, Argentina, Others)
- Middle East and Africa (Saudi Arabia, UAE, Kuwait, Other Middle East, South Africa, Nigeria, Other Africa)
Mechanical Keyboard Companies Profiled in the Study
- Corsair Components Inc
- Steel Series ApS
- Rantek Electronics Co. Ltd
- Roccat Studios Inc
- Razer Inc
- Das Keyboard
- Rapoo Corporation
- Logitech International
- Cherry AG
- OMRON Corporation
* List not exhaustive
Mechanical Keyboard Market Outlook 2025
1 Market Overview
1.1 Introduction to the Mechanical Keyboard Market
1.2 Scope of the Study
1.3 Research Objective
1.3.1 Key Market Scope and Segments
1.3.2 Players Covered
1.3.3 Years Considered
2 Executive Summary
2.1 2023 Mechanical Keyboard Industry- Market Statistics
3 Market Dynamics
3.1 Market Drivers
3.2 Market Challenges
3.3 Market Opportunities
3.4 Market Trends
4 Market Factor Analysis
4.1 Porter’s Five Forces
4.2 Market Entropy
4.2.1 Global Mechanical Keyboard Market Companies with Area Served
4.2.2 Products Offerings Global Mechanical Keyboard Market
5 COVID-19 Impact Analysis and Outlook Scenarios
5.1.1 Covid-19 Impact Analysis
5.1.2 Post-COVID-19 Scenario- Low Growth Case
5.1.3 Post-COVID-19 Scenario- Reference Growth Case
5.1.4 Post-COVID-19 Scenario- Low Growth Case
6 Global Mechanical Keyboard Market Trends
6.1 Global Mechanical Keyboard Revenue (USD Million) and CAGR (%) by Type (2018-2030)
6.2 Global Mechanical Keyboard Revenue (USD Million) and CAGR (%) by Applications (2018-2030)
6.3 Global Mechanical Keyboard Revenue (USD Million) and CAGR (%) by Regions (2018-2030)
7 Global Mechanical Keyboard Market Revenue (USD Million) by Type, and Applications (2019-2024)
7.1 Global Mechanical Keyboard Revenue (USD Million) by Type (2019-2024)
7.1.1 Global Mechanical Keyboard Revenue (USD Million), Market Share (%) by Type (2019-2024)
7.2 Global Mechanical Keyboard Revenue (USD Million) by Applications (2019-2024)
7.2.1 Global Mechanical Keyboard Revenue (USD Million), Market Share (%) by Applications (2019-2024)
8 Global Mechanical Keyboard Development Regional Status and Outlook
8.1 Global Mechanical Keyboard Revenue (USD Million) By Regions (2019-2024)
8.2 North America Mechanical Keyboard Revenue (USD Million) by Type, and Application (2019-2024)
8.2.1 North America Mechanical Keyboard Revenue (USD Million) by Country (2019-2024)
8.2.2 North America Mechanical Keyboard Revenue (USD Million) by Type (2019-2024)
8.2.3 North America Mechanical Keyboard Revenue (USD Million) by Applications (2019-2024)
8.3 Europe Mechanical Keyboard Revenue (USD Million), by Type, and Applications (USD Million) (2019-2024)
8.3.1 Europe Mechanical Keyboard Revenue (USD Million), by Country (2019-2024)
8.3.2 Europe Mechanical Keyboard Revenue (USD Million) by Type (2019-2024)
8.3.3 Europe Mechanical Keyboard Revenue (USD Million) by Applications (2019-2024)
8.4 Asia Pacific Mechanical Keyboard Revenue (USD Million), and Revenue (USD Million) by Type, and Applications (2019-2024)
8.4.1 Asia Pacific Mechanical Keyboard Revenue (USD Million) by Country (2019-2024)
8.4.2 Asia Pacific Mechanical Keyboard Revenue (USD Million) by Type (2019-2024)
8.4.3 Asia Pacific Mechanical Keyboard Revenue (USD Million) by Applications (2019-2024)
8.5 South America Mechanical Keyboard Revenue (USD Million), by Type, and Applications (2019-2024)
8.5.1 South America Mechanical Keyboard Revenue (USD Million), by Country (2019-2024)
8.5.2 South America Mechanical Keyboard Revenue (USD Million) by Type (2019-2024)
8.5.3 South America Mechanical Keyboard Revenue (USD Million) by Applications (2019-2024)
8.6 Middle East and Africa Mechanical Keyboard Revenue (USD Million), by Type, Technology, Application, Thickness (2019-2024)
8.6.1 Middle East and Africa Mechanical Keyboard Revenue (USD Million) by Country (2019-2024)
8.6.2 Middle East and Africa Mechanical Keyboard Revenue (USD Million) by Type (2019-2024)
8.6.3 Middle East and Africa Mechanical Keyboard Revenue (USD Million) by Applications (2019-2024)
9 Company Profiles
10 Global Mechanical Keyboard Market Revenue (USD Million), by Type, and Applications (2025-2034)
10.1 Global Mechanical Keyboard Revenue (USD Million) and Market Share (%) by Type (2025-2034)
10.1.1 Global Mechanical Keyboard Revenue (USD Million), and Market Share (%) by Type (2025-2034)
10.2 Global Mechanical Keyboard Revenue (USD Million) and Market Share (%) by Applications (2025-2034)
10.2.1 Global Mechanical Keyboard Revenue (USD Million), and Market Share (%) by Applications (2025-2034)
11 Global Mechanical Keyboard Development Regional Status and Outlook Forecast
11.1 Global Mechanical Keyboard Revenue (USD Million) By Regions (2025-2034)
11.2 North America Mechanical Keyboard Revenue (USD Million) by Type, and Applications (2025-2034)
11.2.1 North America Mechanical Keyboard Revenue (USD) Million by Country (2025-2034)
11.2.2 North America Mechanical Keyboard Revenue (USD Million), by Type (2025-2034)
11.2.3 North America Mechanical Keyboard Revenue (USD Million), Market Share (%) by Applications (2025-2034)
11.3 Europe Mechanical Keyboard Revenue (USD Million), by Type, and Applications (2025-2034)
11.3.1 Europe Mechanical Keyboard Revenue (USD Million), by Country (2025-2034)
11.3.2 Europe Mechanical Keyboard Revenue (USD Million), by Type (2025-2034)
11.3.3 Europe Mechanical Keyboard Revenue (USD Million), by Applications (2025-2034)
11.4 Asia Pacific Mechanical Keyboard Revenue (USD Million) by Type, and Applications (2025-2034)
11.4.1 Asia Pacific Mechanical Keyboard Revenue (USD Million), by Country (2025-2034)
11.4.2 Asia Pacific Mechanical Keyboard Revenue (USD Million), by Type (2025-2034)
11.4.3 Asia Pacific Mechanical Keyboard Revenue (USD Million), by Applications (2025-2034)
11.5 South America Mechanical Keyboard Revenue (USD Million), by Type, and Applications (2025-2034)
11.5.1 South America Mechanical Keyboard Revenue (USD Million), by Country (2025-2034)
11.5.2 South America Mechanical Keyboard Revenue (USD Million), by Type (2025-2034)
11.5.3 South America Mechanical Keyboard Revenue (USD Million), by Applications (2025-2034)
11.6 Middle East and Africa Mechanical Keyboard Revenue (USD Million), by Type, and Applications (2025-2034)
11.6.1 Middle East and Africa Mechanical Keyboard Revenue (USD Million), by Region (2025-2034)
11.6.2 Middle East and Africa Mechanical Keyboard Revenue (USD Million), by Type (2025-2034)
11.6.3 Middle East and Africa Mechanical Keyboard Revenue (USD Million), by Applications (2025-2034)
12 Methodology and Data Sources
12.1 Methodology/Research Approach
12.1.1 Research Programs/Design
12.1.2 Market Size Estimation
12.1.3 Market Breakdown and Data Triangulation
12.2 Data Sources
12.2.1 Secondary Sources
12.2.2 Primary Sources
12.3 Disclaimer
List of Tables
Table 1 Market Segmentation Analysis
Table 2 Global Mechanical Keyboard Market Companies with Areas Served
Table 3 Products Offerings Global Mechanical Keyboard Market
Table 4 Low Growth Scenario Forecasts
Table 5 Reference Case Growth Scenario
Table 6 High Growth Case Scenario
Table 7 Global Mechanical Keyboard Revenue (USD Million) And CAGR (%) By Type (2018-2030)
Table 8 Global Mechanical Keyboard Revenue (USD Million) And CAGR (%) By Applications (2018-2030)
Table 9 Global Mechanical Keyboard Revenue (USD Million) And CAGR (%) By Regions (2018-2030)
Table 10 Global Mechanical Keyboard Revenue (USD Million) By Type (2019-2024)
Table 11 Global Mechanical Keyboard Revenue Market Share (%) By Type (2019-2024)
Table 12 Global Mechanical Keyboard Revenue (USD Million) By Applications (2019-2024)
Table 13 Global Mechanical Keyboard Revenue Market Share (%) By Applications (2019-2024)
Table 14 Global Mechanical Keyboard Market Revenue (USD Million) By Regions (2019-2024)
Table 15 Global Mechanical Keyboard Market Share (%) By Regions (2019-2024)
Table 16 North America Mechanical Keyboard Revenue (USD Million) By Country (2019-2024)
Table 17 North America Mechanical Keyboard Revenue (USD Million) By Type (2019-2024)
Table 18 North America Mechanical Keyboard Revenue (USD Million) By Applications (2019-2024)
Table 19 Europe Mechanical Keyboard Revenue (USD Million) By Country (2019-2024)
Table 20 Europe Mechanical Keyboard Revenue (USD Million) By Type (2019-2024)
Table 21 Europe Mechanical Keyboard Revenue (USD Million) By Applications (2019-2024)
Table 22 Asia Pacific Mechanical Keyboard Revenue (USD Million) By Country (2019-2024)
Table 23 Asia Pacific Mechanical Keyboard Revenue (USD Million) By Type (2019-2024)
Table 24 Asia Pacific Mechanical Keyboard Revenue (USD Million) By Applications (2019-2024)
Table 25 South America Mechanical Keyboard Revenue (USD Million) By Country (2019-2024)
Table 26 South America Mechanical Keyboard Revenue (USD Million) By Type (2019-2024)
Table 27 South America Mechanical Keyboard Revenue (USD Million) By Applications (2019-2024)
Table 28 Middle East and Africa Mechanical Keyboard Revenue (USD Million) By Region (2019-2024)
Table 29 Middle East and Africa Mechanical Keyboard Revenue (USD Million) By Type (2019-2024)
Table 30 Middle East and Africa Mechanical Keyboard Revenue (USD Million) By Applications (2019-2024)
Table 31 Financial Analysis
Table 32 Global Mechanical Keyboard Revenue (USD Million) By Type (2025-2034)
Table 33 Global Mechanical Keyboard Revenue Market Share (%) By Type (2025-2034)
Table 34 Global Mechanical Keyboard Revenue (USD Million) By Applications (2025-2034)
Table 35 Global Mechanical Keyboard Revenue Market Share (%) By Applications (2025-2034)
Table 36 Global Mechanical Keyboard Market Revenue (USD Million), And Revenue (USD Million) By Regions (2025-2034)
Table 37 North America Mechanical Keyboard Revenue (USD)By Country (2025-2034)
Table 38 North America Mechanical Keyboard Revenue (USD Million) By Type (2025-2034)
Table 39 North America Mechanical Keyboard Revenue (USD Million) By Applications (2025-2034)
Table 40 Europe Mechanical Keyboard Revenue (USD Million) By Country (2025-2034)
Table 41 Europe Mechanical Keyboard Revenue (USD Million) By Type (2025-2034)
Table 42 Europe Mechanical Keyboard Revenue (USD Million) By Applications (2025-2034)
Table 43 Asia Pacific Mechanical Keyboard Revenue (USD Million) By Country (2025-2034)
Table 44 Asia Pacific Mechanical Keyboard Revenue (USD Million) By Type (2025-2034)
Table 45 Asia Pacific Mechanical Keyboard Revenue (USD Million) By Applications (2025-2034)
Table 46 South America Mechanical Keyboard Revenue (USD Million) By Country (2025-2034)
Table 47 South America Mechanical Keyboard Revenue (USD Million) By Type (2025-2034)
Table 48 South America Mechanical Keyboard Revenue (USD Million) By Applications (2025-2034)
Table 49 Middle East and Africa Mechanical Keyboard Revenue (USD Million) By Region (2025-2034)
Table 50 Middle East and Africa Mechanical Keyboard Revenue (USD Million) By Region (2025-2034)
Table 51 Middle East and Africa Mechanical Keyboard Revenue (USD Million) By Type (2025-2034)
Table 52 Middle East and Africa Mechanical Keyboard Revenue (USD Million) By Applications (2025-2034)
Table 53 Research Programs/Design for This Report
Table 54 Key Data Information from Secondary Sources
Table 55 Key Data Information from Primary Sources
List of Figures
Figure 1 Market Scope
Figure 2 Porter’s Five Forces
Figure 3 Global Mechanical Keyboard Revenue (USD Million) By Type (2019-2024)
Figure 4 Global Mechanical Keyboard Revenue Market Share (%) By Type (2022)
Figure 5 Global Mechanical Keyboard Revenue (USD Million) By Applications (2019-2024)
Figure 6 Global Mechanical Keyboard Revenue Market Share (%) By Applications (2022)
Figure 7 Global Mechanical Keyboard Market Revenue (USD Million) By Regions (2019-2024)
Figure 8 Global Mechanical Keyboard Market Share (%) By Regions (2022)
Figure 9 North America Mechanical Keyboard Revenue (USD Million) By Country (2019-2024)
Figure 10 North America Mechanical Keyboard Revenue (USD Million) By Type (2019-2024)
Figure 11 North America Mechanical Keyboard Revenue (USD Million) By Applications (2019-2024)
Figure 12 Europe Mechanical Keyboard Revenue (USD Million) By Country (2019-2024)
Figure 13 Europe Mechanical Keyboard Revenue (USD Million) By Type (2019-2024)
Figure 14 Europe Mechanical Keyboard Revenue (USD Million) By Applications (2019-2024)
Figure 15 Asia Pacific Mechanical Keyboard Revenue (USD Million) By Country (2019-2024)
Figure 16 Asia Pacific Mechanical Keyboard Revenue (USD Million) By Type (2019-2024)
Figure 17 Asia Pacific Mechanical Keyboard Revenue (USD Million) By Applications (2019-2024)
Figure 18 South America Mechanical Keyboard Revenue (USD Million) By Country (2019-2024)
Figure 19 South America Mechanical Keyboard Revenue (USD Million) By Type (2019-2024)
Figure 20 South America Mechanical Keyboard Revenue (USD Million) By Applications (2019-2024)
Figure 21 Middle East and Africa Mechanical Keyboard Revenue (USD Million) By Region (2019-2024)
Figure 22 Middle East and Africa Mechanical Keyboard Revenue (USD Million) By Type (2019-2024)
Figure 23 Middle East and Africa Mechanical Keyboard Revenue (USD Million) By Applications (2019-2024)
Figure 24 Global Mechanical Keyboard Revenue (USD Million) By Type (2025-2034)
Figure 25 Global Mechanical Keyboard Revenue Market Share (%) By Type (2030)
Figure 26 Global Mechanical Keyboard Revenue (USD Million) By Applications (2025-2034)
Figure 27 Global Mechanical Keyboard Revenue Market Share (%) By Applications (2030)
Figure 28 Global Mechanical Keyboard Market Revenue (USD Million) By Regions (2025-2034)
Figure 29 North America Mechanical Keyboard Revenue (USD Million) By Country (2025-2034)
Figure 30 North America Mechanical Keyboard Revenue (USD Million) By Type (2025-2034)
Figure 31 North America Mechanical Keyboard Revenue (USD Million) By Applications (2025-2034)
Figure 32 Europe Mechanical Keyboard Revenue (USD Million) By Country (2025-2034)
Figure 33 Europe Mechanical Keyboard Revenue (USD Million) By Type (2025-2034)
Figure 34 Europe Mechanical Keyboard Revenue (USD Million) By Applications (2025-2034)
Figure 35 Asia Pacific Mechanical Keyboard Revenue (USD Million) By Country (2025-2034)
Figure 36 Asia Pacific Mechanical Keyboard Revenue (USD Million) By Type (2025-2034)
Figure 37 Asia Pacific Mechanical Keyboard Revenue (USD Million) By Applications (2025-2034)
Figure 38 South America Mechanical Keyboard Revenue (USD Million) By Country (2025-2034)
Figure 39 South America Mechanical Keyboard Revenue (USD Million) By Type (2025-2034)
Figure 40 South America Mechanical Keyboard Revenue (USD Million) By Applications (2025-2034)
Figure 41 Middle East and Africa Mechanical Keyboard Revenue (USD Million) By Region (2025-2034)
Figure 42 Middle East and Africa Mechanical Keyboard Revenue (USD Million) By Region (2025-2034)
Figure 43 Middle East and Africa Mechanical Keyboard Revenue (USD Million) By Type (2025-2034)
Figure 44 Middle East and Africa Mechanical Keyboard Revenue (USD Million) By Applications (2025-2034)
Figure 45 Bottom-Up and Top-Down Approaches For This Report
Figure 46 Data Triangulation
