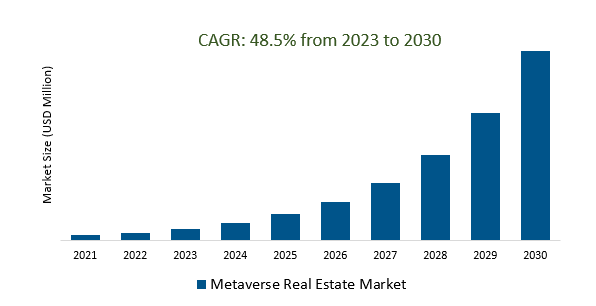
The Metaverse Real Estate Market Size is estimated to register 48.5% growth over the forecast period from 2023 to 2030.
Metaverse Real Estate Market Overview
The concept of digital ownership and the integration of blockchain technology are playing a pivotal role in driving the Metaverse Real Estate Market. Companies are increasingly recognizing the potential of virtual real estate for advertising, marketing, and creating unique brand experiences, thus driving the demand for virtual properties. As the concept of digital property ownership evolves, there is a need for regulations that define and protect virtual assets, ensuring trust and security for investors and users within the Metaverse. Content creators, artists, and developers are actively participating in designing and monetizing immersive virtual experiences, creating innovative content, virtual spaces, and engaging environments within the Metaverse, driving the demand. Efforts are being made to create seamless connections and compatibility between different virtual worlds, aiming to enable users and assets to move across diverse Metaverse environments
Metaverse Real Estate Market Dynamics
Market Trends- The Metaverse Real Estate Market is witnessing a significant trend characterized by the scarcity and increased value of virtual land.
Analogous to the principles governing physical real estate, the limited availability of premium virtual locations or unique digital assets are sparking a remarkable surge in their worth.
The scarcity-driven escalation in value is shaping a new economic paradigm within the Metaverse, where virtual land holds comparable significance to its physical counterpart, fueling the market.
Further, Prime locations or unique digital assets within virtual worlds are in high demand, leading to increased competition and rising values for these limited and sought-after properties.
Market Driver- Growing adoption of Non-Fungible Tokens (NFTs) for virtual property ownership drives Metaverse Real Estate Market.
The inherent nature of NFTs, offering indisputable proof of ownership and uniqueness for digital assets is serving as a significant driver.
Additionally, the desire for authenticity and exclusivity, providing a robust mechanism for verifying ownership rights to virtual land, buildings, and assets within the Metaverse are fueling the demand.
Further, active engagement in creating and monetizing digital assets, coupled with the potential for increased value and recognition through NFTs is acting as a catalyst for further adoption.
Market Opportunity- The Metaverse Real Estate Market is experiencing a convergence with traditional real estate, driven by heightened investor interest.
The allure of the Metaverse as an emerging frontier is attracting established real estate developers and investors, intrigued by the potential synergy between physical and digital real estate realms.
Investors are increasingly viewing virtual real estate as a viable and valuable addition to their portfolios, stimulating a surge in interest and engagement within the Metaverse Real Estate Market.
Further, the rising acceptance and recognition of virtual properties as legitimate assets are driving this convergence.
Market Share Analysis- Commercial will register the fastest growth
The Metaverse Real Estate Market is analyzed across Commercial and Residential. Commercial is poised to register the fastest growth. It encompasses a diverse array of applications and opportunities tailored for business activities within the digital realm. In this sphere, companies are establishing virtual storefronts, hosting online trade shows, conducting virtual meetings, and organizing immersive brand experiences. These digital spaces provide an avenue for businesses to transcend physical limitations, reaching global audiences and engaging with clients on a whole new level. The Metaverse's integration of cutting-edge technologies like virtual reality (VR), augmented reality (AR), and blockchain-supported Non-Fungible Tokens (NFTs) has revolutionized how commercial entities interact with customers and conduct transactions. Moreover, the Commercial segment's growth is driven by the increasing demand for novel and engaging experiences, allowing businesses to connect with consumers in innovative ways.
Market Share Analysis- Software held a significant market share in 2023
The Metaverse Real Estate Market is analyzed across various components including Hardware and Software. Of these, Software held a significant market share in 2023. Software components encompass a wide array of technologies and applications essential for constructing, managing, and enhancing virtual properties within the Metaverse. These software tools include virtual world-building platforms, 3D modeling and rendering software, augmented reality (AR) applications, blockchain technology for Non-Fungible Tokens (NFTs), and various immersive and interactive applications facilitating virtual property transactions and experiences. The evolution and innovation in Metaverse-related software play a pivotal role in shaping the realism, functionality, and user experience within virtual real estate spaces. Advanced software enables the design and customization of virtual properties, ensuring their seamless integration and interoperability across different Metaverse platforms. Moreover, the integration of sophisticated software tools facilitates the secure management of digital assets, ensuring authentication, uniqueness, and traceability of virtual properties through NFTs and blockchain technology
Metaverse Real Estate Market News
Mahindra Lifespace Developers Introduces India's First Home-Buying Experience on Metaverse with Bastion at Mahindra Citadel Phase 2 Launch.
5ire and Network Capital, in partnership with NITI Aayog, debut Blockchain Module; Square Yards Unveils Real Estate Metaverse
Metaverse Real Estate Market Segmentation
By End-User
By Component
By Region
- North America (United States, Canada, Mexico)
- Europe (Germany, France, United Kingdom, Spain, Italy, Others)
- Asia Pacific (China, India, Japan, South Korea, Australia, Others)
- Latin America (Brazil, Argentina, Others)
- Middle East and Africa (Saudi Arabia, UAE, Kuwait, Other Middle East, South Africa, Nigeria, Other Africa)
Metaverse Real Estate Market Companies
- Axie Infinity
- Cryptovoxels
- Decentraland
- Foundation
- Linden Lab
- ShibaLand LLC
- Somnium Space LTD
- SuperWorld Inc
- TandB Media Global Thailand Co LTD
- The Sandbox
- The Voxel Agents
- Tokens.com
- Uplandme Inc
*List not exhaustive
Metaverse Real Estate Market Outlook 2023
1 Market Overview
1.1 Introduction to the Metaverse Real Estate Market
1.2 Scope of the Study
1.3 Research Objective
1.3.1 Key Market Scope and Segments
1.3.2 Players Covered
1.3.3 Years Considered
2 Executive Summary
2.1 2023 Metaverse Real Estate Industry- Market Statistics
3 Market Dynamics
3.1 Market Drivers
3.2 Market Challenges
3.3 Market Opportunities
3.4 Market Trends
4 Market Factor Analysis
4.1 Porter’s Five Forces
4.2 Market Entropy
4.2.1 Global Metaverse Real Estate Market Companies with Area Served
4.2.2 Products Offerings Global Metaverse Real Estate Market
5 COVID-19 Impact Analysis and Outlook Scenarios
5.1.1 Covid-19 Impact Analysis
5.1.2 post-COVID-19 Scenario- Low Growth Case
5.1.3 post-COVID-19 Scenario- Reference Growth Case
5.1.4 post-COVID-19 Scenario- Low Growth Case
6 Global Metaverse Real Estate Market Trends
6.1 Global Metaverse Real Estate Revenue (USD Million) and CAGR (%) by Type (2018-2030)
6.2 Global Metaverse Real Estate Revenue (USD Million) and CAGR (%) by Applications (2018-2030)
6.3 Global Metaverse Real Estate Revenue (USD Million) and CAGR (%) by regions (2018-2030)
7 Global Metaverse Real Estate Market Revenue (USD Million) by Type, and Applications (2018-2022)
7.1 Global Metaverse Real Estate Revenue (USD Million) by Type (2018-2022)
7.1.1 Global Metaverse Real Estate Revenue (USD Million), Market Share (%) by Type (2018-2022)
7.2 Global Metaverse Real Estate Revenue (USD Million) by Applications (2018-2022)
7.2.1 Global Metaverse Real Estate Revenue (USD Million), Market Share (%) by Applications (2018-2022)
8 Global Metaverse Real Estate Development Regional Status and Outlook
8.1 Global Metaverse Real Estate Revenue (USD Million) By Regions (2018-2022)
8.2 North America Metaverse Real Estate Revenue (USD Million) by Type, and Application (2018-2022)
8.2.1 North America Metaverse Real Estate Revenue (USD Million) by Country (2018-2022)
8.2.2 North America Metaverse Real Estate Revenue (USD Million) by Type (2018-2022)
8.2.3 North America Metaverse Real Estate Revenue (USD Million) by Applications (2018-2022)
8.3 Europe Metaverse Real Estate Revenue (USD Million), by Type, and Applications (USD Million) (2018-2022)
8.3.1 Europe Metaverse Real Estate Revenue (USD Million), by Country (2018-2022)
8.3.2 Europe Metaverse Real Estate Revenue (USD Million) by Type (2018-2022)
8.3.3 Europe Metaverse Real Estate Revenue (USD Million) by Applications (2018-2022)
8.4 Asia Pacific Metaverse Real Estate Revenue (USD Million), and Revenue (USD Million) by Type, and Applications (2018-2022)
8.4.1 Asia Pacific Metaverse Real Estate Revenue (USD Million) by Country (2018-2022)
8.4.2 Asia Pacific Metaverse Real Estate Revenue (USD Million) by Type (2018-2022)
8.4.3 Asia Pacific Metaverse Real Estate Revenue (USD Million) by Applications (2018-2022)
8.5 South America Metaverse Real Estate Revenue (USD Million), by Type, and Applications (2018-2022)
8.5.1 South America Metaverse Real Estate Revenue (USD Million), by Country (2018-2022)
8.5.2 South America Metaverse Real Estate Revenue (USD Million) by Type (2018-2022)
8.5.3 South America Metaverse Real Estate Revenue (USD Million) by Applications (2018-2022)
8.6 Middle East and Africa Metaverse Real Estate Revenue (USD Million), by Type, Technology, Application, Thickness (2018-2022)
8.6.1 Middle East and Africa Metaverse Real Estate Revenue (USD Million) by Country (2018-2022)
8.6.2 Middle East and Africa Metaverse Real Estate Revenue (USD Million) by Type (2018-2022)
8.6.3 Middle East and Africa Metaverse Real Estate Revenue (USD Million) by Applications (2018-2022)
9 Company Profiles
10 Global Metaverse Real Estate Market Revenue (USD Million), by Type, and Applications (2023-2030)
10.1 Global Metaverse Real Estate Revenue (USD Million) and Market Share (%) by Type (2023-2030)
10.1.1 Global Metaverse Real Estate Revenue (USD Million), and Market Share (%) by Type (2023-2030)
10.2 Global Metaverse Real Estate Revenue (USD Million) and Market Share (%) by Applications (2023-2030)
10.2.1 Global Metaverse Real Estate Revenue (USD Million), and Market Share (%) by Applications (2023-2030)
11 Global Metaverse Real Estate Development Regional Status and Outlook Forecast
11.1 Global Metaverse Real Estate Revenue (USD Million) By Regions (2023-2030)
11.2 North America Metaverse Real Estate Revenue (USD Million) by Type, and Applications (2023-2030)
11.2.1 North America Metaverse Real Estate Revenue (USD) Million by Country (2023-2030)
11.2.2 North America Metaverse Real Estate Revenue (USD Million), by Type (2023-2030)
11.2.3 North America Metaverse Real Estate Revenue (USD Million), Market Share (%) by Applications (2023-2030)
11.3 Europe Metaverse Real Estate Revenue (USD Million), by Type, and Applications (2023-2030)
11.3.1 Europe Metaverse Real Estate Revenue (USD Million), by Country (2023-2030)
11.3.2 Europe Metaverse Real Estate Revenue (USD Million), by Type (2023-2030)
11.3.3 Europe Metaverse Real Estate Revenue (USD Million), by Applications (2023-2030)
11.4 Asia Pacific Metaverse Real Estate Revenue (USD Million) by Type, and Applications (2023-2030)
11.4.1 Asia Pacific Metaverse Real Estate Revenue (USD Million), by Country (2023-2030)
11.4.2 Asia Pacific Metaverse Real Estate Revenue (USD Million), by Type (2023-2030)
11.4.3 Asia Pacific Metaverse Real Estate Revenue (USD Million), by Applications (2023-2030)
11.5 South America Metaverse Real Estate Revenue (USD Million), by Type, and Applications (2023-2030)
11.5.1 South America Metaverse Real Estate Revenue (USD Million), by Country (2023-2030)
11.5.2 South America Metaverse Real Estate Revenue (USD Million), by Type (2023-2030)
11.5.3 South America Metaverse Real Estate Revenue (USD Million), by Applications (2023-2030)
11.6 Middle East and Africa Metaverse Real Estate Revenue (USD Million), by Type, and Applications (2023-2030)
11.6.1 Middle East and Africa Metaverse Real Estate Revenue (USD Million), by region (2023-2030)
11.6.2 Middle East and Africa Metaverse Real Estate Revenue (USD Million), by Type (2023-2030)
11.6.3 Middle East and Africa Metaverse Real Estate Revenue (USD Million), by Applications (2023-2030)
12 Methodology and Data Sources
12.1 Methodology/Research Approach
12.1.1 Research Programs/Design
12.1.2 Market Size Estimation
12.1.3 Market Breakdown and Data Triangulation
12.2 Data Sources
12.2.1 Secondary Sources
12.2.2 Primary Sources
12.3 Disclaimer
List of Tables
Table 1 Market Segmentation Analysis
Table 2 Global Metaverse Real Estate Market Companies with Areas Served
Table 3 Products Offerings Global Metaverse Real Estate Market
Table 4 Low Growth Scenario Forecasts
Table 5 Reference Case Growth Scenario
Table 6 High Growth Case Scenario
Table 7 Global Metaverse Real Estate Revenue (USD Million) And CAGR (%) By Type (2018-2030)
Table 8 Global Metaverse Real Estate Revenue (USD Million) And CAGR (%) By Applications (2018-2030)
Table 9 Global Metaverse Real Estate Revenue (USD Million) And CAGR (%) By Regions (2018-2030)
Table 10 Global Metaverse Real Estate Revenue (USD Million) By Type (2018-2022)
Table 11 Global Metaverse Real Estate Revenue Market Share (%) By Type (2018-2022)
Table 12 Global Metaverse Real Estate Revenue (USD Million) By Applications (2018-2022)
Table 13 Global Metaverse Real Estate Revenue Market Share (%) By Applications (2018-2022)
Table 14 Global Metaverse Real Estate Market Revenue (USD Million) By Regions (2018-2022)
Table 15 Global Metaverse Real Estate Market Share (%) By Regions (2018-2022)
Table 16 North America Metaverse Real Estate Revenue (USD Million) By Country (2018-2022)
Table 17 North America Metaverse Real Estate Revenue (USD Million) By Type (2018-2022)
Table 18 North America Metaverse Real Estate Revenue (USD Million) By Applications (2018-2022)
Table 19 Europe Metaverse Real Estate Revenue (USD Million) By Country (2018-2022)
Table 20 Europe Metaverse Real Estate Revenue (USD Million) By Type (2018-2022)
Table 21 Europe Metaverse Real Estate Revenue (USD Million) By Applications (2018-2022)
Table 22 Asia Pacific Metaverse Real Estate Revenue (USD Million) By Country (2018-2022)
Table 23 Asia Pacific Metaverse Real Estate Revenue (USD Million) By Type (2018-2022)
Table 24 Asia Pacific Metaverse Real Estate Revenue (USD Million) By Applications (2018-2022)
Table 25 South America Metaverse Real Estate Revenue (USD Million) By Country (2018-2022)
Table 26 South America Metaverse Real Estate Revenue (USD Million) By Type (2018-2022)
Table 27 South America Metaverse Real Estate Revenue (USD Million) By Applications (2018-2022)
Table 28 Middle East and Africa Metaverse Real Estate Revenue (USD Million) By Region (2018-2022)
Table 29 Middle East and Africa Metaverse Real Estate Revenue (USD Million) By Type (2018-2022)
Table 30 Middle East and Africa Metaverse Real Estate Revenue (USD Million) By Applications (2018-2022)
Table 31 Financial Analysis
Table 32 Global Metaverse Real Estate Revenue (USD Million) By Type (2023-2030)
Table 33 Global Metaverse Real Estate Revenue Market Share (%) By Type (2023-2030)
Table 34 Global Metaverse Real Estate Revenue (USD Million) By Applications (2023-2030)
Table 35 Global Metaverse Real Estate Revenue Market Share (%) By Applications (2023-2030)
Table 36 Global Metaverse Real Estate Market Revenue (USD Million), And Revenue (USD Million) By Regions (2023-2030)
Table 37 North America Metaverse Real Estate Revenue (USD)By Country (2023-2030)
Table 38 North America Metaverse Real Estate Revenue (USD Million) By Type (2023-2030)
Table 39 North America Metaverse Real Estate Revenue (USD Million) By Applications (2023-2030)
Table 40 Europe Metaverse Real Estate Revenue (USD Million) By Country (2023-2030)
Table 41 Europe Metaverse Real Estate Revenue (USD Million) By Type (2023-2030)
Table 42 Europe Metaverse Real Estate Revenue (USD Million) By Applications (2023-2030)
Table 43 Asia Pacific Metaverse Real Estate Revenue (USD Million) By Country (2023-2030)
Table 44 Asia Pacific Metaverse Real Estate Revenue (USD Million) By Type (2023-2030)
Table 45 Asia Pacific Metaverse Real Estate Revenue (USD Million) By Applications (2023-2030)
Table 46 South America Metaverse Real Estate Revenue (USD Million) By Country (2023-2030)
Table 47 South America Metaverse Real Estate Revenue (USD Million) By Type (2023-2030)
Table 48 South America Metaverse Real Estate Revenue (USD Million) By Applications (2023-2030)
Table 49 Middle East and Africa Metaverse Real Estate Revenue (USD Million) By Region (2023-2030)
Table 50 Middle East and Africa Metaverse Real Estate Revenue (USD Million) By Region (2023-2030)
Table 51 Middle East and Africa Metaverse Real Estate Revenue (USD Million) By Type (2023-2030)
Table 52 Middle East and Africa Metaverse Real Estate Revenue (USD Million) By Applications (2023-2030)
Table 53 Research Programs/Design for This Report
Table 54 Key Data Information from Secondary Sources
Table 55 Key Data Information from Primary Sources
List of Figures
Figure 1 Market Scope
Figure 2 Porter’s Five Forces
Figure 3 Global Metaverse Real Estate Revenue (USD Million) By Type (2018-2022)
Figure 4 Global Metaverse Real Estate Revenue Market Share (%) By Type (2022)
Figure 5 Global Metaverse Real Estate Revenue (USD Million) By Applications (2018-2022)
Figure 6 Global Metaverse Real Estate Revenue Market Share (%) By Applications (2022)
Figure 7 Global Metaverse Real Estate Market Revenue (USD Million) By Regions (2018-2022)
Figure 8 Global Metaverse Real Estate Market Share (%) By Regions (2022)
Figure 9 North America Metaverse Real Estate Revenue (USD Million) By Country (2018-2022)
Figure 10 North America Metaverse Real Estate Revenue (USD Million) By Type (2018-2022)
Figure 11 North America Metaverse Real Estate Revenue (USD Million) By Applications (2018-2022)
Figure 12 Europe Metaverse Real Estate Revenue (USD Million) By Country (2018-2022)
Figure 13 Europe Metaverse Real Estate Revenue (USD Million) By Type (2018-2022)
Figure 14 Europe Metaverse Real Estate Revenue (USD Million) By Applications (2018-2022)
Figure 15 Asia Pacific Metaverse Real Estate Revenue (USD Million) By Country (2018-2022)
Figure 16 Asia Pacific Metaverse Real Estate Revenue (USD Million) By Type (2018-2022)
Figure 17 Asia Pacific Metaverse Real Estate Revenue (USD Million) By Applications (2018-2022)
Figure 18 South America Metaverse Real Estate Revenue (USD Million) By Country (2018-2022)
Figure 19 South America Metaverse Real Estate Revenue (USD Million) By Type (2018-2022)
Figure 20 South America Metaverse Real Estate Revenue (USD Million) By Applications (2018-2022)
Figure 21 Middle East and Africa Metaverse Real Estate Revenue (USD Million) By Region (2018-2022)
Figure 22 Middle East and Africa Metaverse Real Estate Revenue (USD Million) By Type (2018-2022)
Figure 23 Middle East and Africa Metaverse Real Estate Revenue (USD Million) By Applications (2018-2022)
Figure 24 Global Metaverse Real Estate Revenue (USD Million) By Type (2023-2030)
Figure 25 Global Metaverse Real Estate Revenue Market Share (%) By Type (2030)
Figure 26 Global Metaverse Real Estate Revenue (USD Million) By Applications (2023-2030)
Figure 27 Global Metaverse Real Estate Revenue Market Share (%) By Applications (2030)
Figure 28 Global Metaverse Real Estate Market Revenue (USD Million) By Regions (2023-2030)
Figure 29 North America Metaverse Real Estate Revenue (USD Million) By Country (2023-2030)
Figure 30 North America Metaverse Real Estate Revenue (USD Million) By Type (2023-2030)
Figure 31 North America Metaverse Real Estate Revenue (USD Million) By Applications (2023-2030)
Figure 32 Europe Metaverse Real Estate Revenue (USD Million) By Country (2023-2030)
Figure 33 Europe Metaverse Real Estate Revenue (USD Million) By Type (2023-2030)
Figure 34 Europe Metaverse Real Estate Revenue (USD Million) By Applications (2023-2030)
Figure 35 Asia Pacific Metaverse Real Estate Revenue (USD Million) By Country (2023-2030)
Figure 36 Asia Pacific Metaverse Real Estate Revenue (USD Million) By Type (2023-2030)
Figure 37 Asia Pacific Metaverse Real Estate Revenue (USD Million) By Applications (2023-2030)
Figure 38 South America Metaverse Real Estate Revenue (USD Million) By Country (2023-2030)
Figure 39 South America Metaverse Real Estate Revenue (USD Million) By Type (2023-2030)
Figure 40 South America Metaverse Real Estate Revenue (USD Million) By Applications (2023-2030)
Figure 41 Middle East and Africa Metaverse Real Estate Revenue (USD Million) By Region (2023-2030)
Figure 42 Middle East and Africa Metaverse Real Estate Revenue (USD Million) By Region (2023-2030)
Figure 43 Middle East and Africa Metaverse Real Estate Revenue (USD Million) By Type (2023-2030)
Figure 44 Middle East and Africa Metaverse Real Estate Revenue (USD Million) By Applications (2023-2030)
Figure 45 Bottom-Up and Top-Down Approaches for This Report
Figure 46 Data Triangulation
