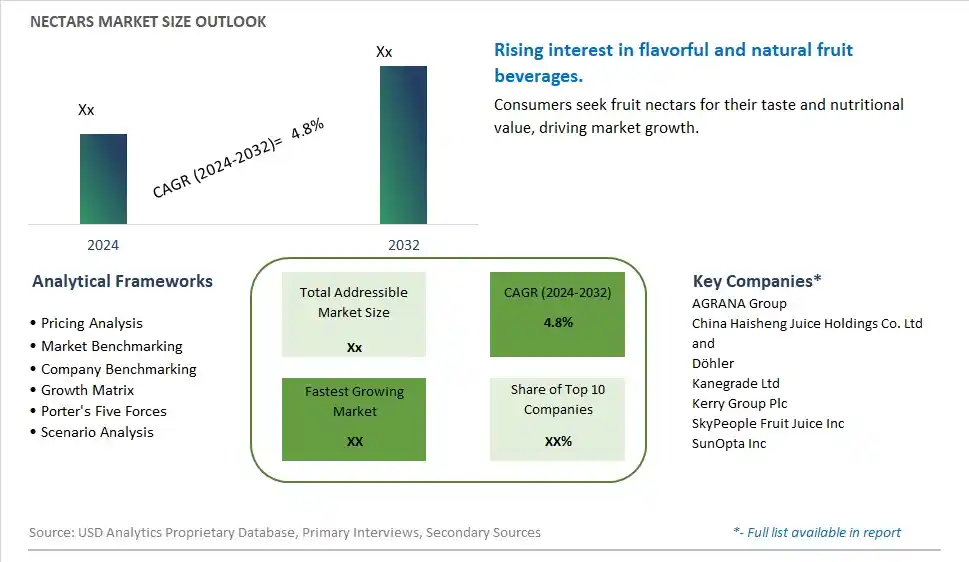
Global Nectars Market Size is valued at $XX Million in 2024 and is forecast to register a growth rate (CAGR) of 4.8% to reach $XX Million by 2032.
The global Nectars Market Comprehensive Study analyzes and forecasts the market size across 6 regions and 24 countries for diverse segments -By Type (99% juice content, 25 to 99% juice content, 25% juice content), By Application (Food and Beverages, Bakery and Confectionary, Others)
An Introduction to Nectars Market
The Nectars Market focuses on the production and sale of beverages made from fruit juice concentrates and water, with added sweeteners and flavors. These products cater to consumers seeking refreshing and flavorful drink options. The market is driven by increasing demand for convenient and natural beverages, rising awareness about the benefits of fruit-based drinks, and growing popularity of functional and fortified beverages. Additionally, innovations in beverage formulations and the expansion of distribution channels support market growth.
Nectars Competitive Landscape
The market report analyses the leading companies in the industry including AGRANA Group, China Haisheng Juice Holdings Co. Ltd and, Döhler, Kanegrade Ltd, Kerry Group Plc, SkyPeople Fruit Juice Inc, SunOpta Inc, and Others.
Nectars Market Dynamics
Nectars Market Trend: Increasing Demand for Natural and Premium Fruit Nectars
The most prominent trend in the Nectars Market is the increasing demand for natural and premium fruit nectars. Consumers are seeking high-quality nectars made with pure fruit juice and minimal additives, driven by the desire for refreshing and nutritious beverages.
Nectars Market Driver: Health Consciousness and Demand for Natural Beverages
A key driver in the Nectars Market is health consciousness and the demand for natural beverages. As more individuals focus on improving their diet and avoiding artificial additives, there is a rising demand for fruit nectars that provide natural sweetness and essential nutrients, supporting market growth.
Nectars Market Opportunity: Innovation in Flavor Combinations and Packaging
One significant opportunity in the Nectars Market lies in innovation in flavor combinations and packaging. Companies can develop new nectar products that combine different fruits and exotic flavors, offering consumers unique and delicious options, and explore sustainable and convenient packaging solutions to enhance the consumer experience. By offering diverse and high-quality options, manufacturers can attract a broader consumer base and drive market growth.
Nectars Market Share Analysis- Largest Segment by Type
In the Nectars Market, the 25 to 99% Juice Content segment is the largest. This category encompasses a broad range of products that offer a balance between natural fruit flavor and affordability. Nectars with 25 to 99% juice content are popular due to their accessibility and cost-effectiveness compared to 99% juice products. They strike a middle ground by providing a substantial fruit essence without the premium pricing of 100% juice. This segment's popularity is bolstered by consumer preferences for both value and quality, making it the dominant force in the nectars market.
Nectars Market Share Analysis- Fastest Growing Segment by Application
The Food and Beverages application segment is poised to grow the fastest in the Nectars Market over the next five years. The increasing demand for healthier, naturally flavored beverages and food products is driving this growth. Consumers are leaning towards products with natural ingredients and lower sugar content, which nectar products can fulfill effectively. Additionally, the expanding trend of integrating fruit nectars into various food applications, such as smoothies, flavored waters, and sauces, enhances their appeal. This trend is supported by the rising health consciousness among consumers, which is expected to drive significant growth in the food and beverage sector.
Nectars Market Segmentation
By Type
99% juice content
25 to 99% juice content
25% juice content
By Application
Food and Beverages
Bakery and Confectionary
Others
Countries Analyzed
North America (US, Canada, Mexico)
Europe (Germany, UK, France, Spain, Italy, Russia, Rest of Europe)
Asia Pacific (China, India, Japan, South Korea, Australia, South East Asia, Rest of Asia)
South America (Brazil, Argentina, Rest of South America)
Middle East and Africa (Saudi Arabia, UAE, Rest of Middle East, South Africa, Egypt, Rest of Africa)
Nectars Companies Profiled in the Study
AGRANA Group
China Haisheng Juice Holdings Co. Ltd and
Döhler
Kanegrade Ltd
Kerry Group Plc
SkyPeople Fruit Juice Inc
SunOpta Inc
*- List Not Exhaustive
Chapter 1. TABLE OF CONTENTS
Chapter 2. Introduction to Nectars Market
2.1. Market Overview
2.2. Key Statistics and Report Highlights
2.3. Scope of the Comprehensive Study
2.3.1. Market Definition
2.3.2 Countries and Regions Covered
2.3.3 Research Objective
2.3.4 Units, Currency, and Conversions
2.3.5 Industry Value Chain
2.4. Key Market Segments
2.5. Key Companies
2.6. Study Period
Chapter 3. Strategic Analysis Review
3.1. Nectars Pricing Analysis and Forecast
3.2. Porter’s Five Forces
3.3. Market Ecosystem
3.4. SWOT Analysis
3.5. Regulatory Scenario
3.3. Effects of Inflation, Russia-Ukraine War, moderating economic growth, and other macroeconomic factors
Chapter 4. Competitive Landscape
4.1. Market Share Analysis
4.1.1. Global Nectars Market Share by Company, 2023
4.1.2. Product Offerings of Leading Nectars Companies
4.2. Market Entropy
4.2.1. New Product Launches in the Industry
4.2.2. Mergers, Acquisitions, Joint ventures, and Partnerships
4.3. Key Strategies and Best Practices
Chapter 5. Global Market Projections: Best, Reference, and Low Case Scenarios
5.1. Growth Analysis- Case Scenario Definitions
5.2. Low Growth Case Scenario Forecasts
5.3. Reference Growth Case Scenario Forecasts
5.4. High Growth Case Scenario Forecasts
Chapter 6. Market Dynamics
6.1. Nectars Market Drivers
6.2. Nectars Market Challenges
6.6. Nectars Market Opportunities
6.4. Nectars Market Trends
Chapter 7. Global Nectars Market Outlook Trends
7.1. Global Nectars Revenue (USD Million) and CAGR (%) by Type (2021-2032)
7.2. Global Nectars Revenue (USD Million) and CAGR (%) by Application (2021-2032)
7.3. Global Nectars Revenue (USD Million) and CAGR (%) by Product (2021-2032)
By Type
99% juice content
25 to 99% juice content
25% juice content
By Application
Food and Beverages
Bakery and Confectionary
Others
Chapter 8. Global Nectars Regional Analysis and Outlook
8.1. Global Nectars Revenue (USD Million) By Regions (2021- 2032)
8.2. North America Nectars Revenue (USD Million) by Country (2021-2032)
8.2.1. United States Nectars Regional Analysis and Outlook
8.2.2. Canada Nectars Regional Analysis and Outlook
8.2.3. Mexico Nectars Regional Analysis and Outlook
8.3. Europe Nectars Revenue (USD Million), by Country (2021-2032)
8.3.1. Germany Nectars Regional Analysis and Outlook
8.3.2. France Nectars Regional Analysis and Outlook
8.3.3. United Kingdom Nectars Regional Analysis and Outlook
8.3.4. Spain Nectars Regional Analysis and Outlook
8.3.5. Italy Nectars Regional Analysis and Outlook
8.3.6. Russia Nectars Regional Analysis and Outlook
8.3.7. Rest of Europe Nectars Regional Analysis and Outlook
8.4. Asia Pacific Nectars Revenue (USD Million) by Country (2021-2032)
8.4.1. China Nectars Regional Analysis and Outlook
8.4.2. Japan Nectars Regional Analysis and Outlook
8.4.3. India Nectars Regional Analysis and Outlook
8.4.4. South Korea Nectars Regional Analysis and Outlook
8.4.5. Australia Nectars Regional Analysis and Outlook
8.4.6. South East Asia Nectars Regional Analysis and Outlook
8.4.7. Rest of Asia Pacific Nectars Regional Analysis and Outlook
8.5. South America Nectars Revenue (USD Million), by Country (2021-2032)
8.5.1. Brazil Nectars Regional Analysis and Outlook
8.5.2. Argentina Nectars Regional Analysis and Outlook
8.5.3. Rest of South America Nectars Regional Analysis and Outlook
8.6. Middle East and Africa Nectars Revenue (USD Million) by Country (2021-2032)
8.6.1. Middle East Nectars Regional Analysis and Outlook
8.6.2. Africa Nectars Regional Analysis and Outlook
Chapter 9. North America Nectars Analysis and Outlook
9.1. North America Nectars Revenue (USD Million) by Segments (2021-2032)
9.1.1. North America Nectars Revenue (USD Million) by Type (2021-2032)
9.1.2. North America Nectars Revenue (USD Million) by Application (2021-2032)
9.1.3. North America Nectars Revenue (USD Million) by Product (2021-2032)
By Type
99% juice content
25 to 99% juice content
25% juice content
By Application
Food and Beverages
Bakery and Confectionary
Others
Chapter 10. Europe Nectars Analysis and Outlook
10.1. Europe Nectars Revenue (USD Million), by Segments (USD Million) (2021-2032)
10.1.1. Europe Nectars Revenue (USD Million) by Type (2021-2032)
10.1.2. Europe Nectars Revenue (USD Million) by Application (2021-2032)
10.1.3. Europe Nectars Revenue (USD Million) by Product (2021-2032)
By Type
99% juice content
25 to 99% juice content
25% juice content
By Application
Food and Beverages
Bakery and Confectionary
Others
Chapter 11. Asia Pacific Nectars Analysis and Outlook
11.1. Asia Pacific Nectars Revenue (USD Million), and Revenue (USD Million) by Segments (2021-2032)
11.1.1. Asia Pacific Nectars Revenue (USD Million) by Type (2021-2032)
11.1.2. Asia Pacific Nectars Revenue (USD Million) by Application (2021-2032)
11.1.3. Asia Pacific Nectars Revenue (USD Million) by Product (2021-2032)
By Type
99% juice content
25 to 99% juice content
25% juice content
By Application
Food and Beverages
Bakery and Confectionary
Others
Chapter 12. South America Nectars Analysis and Outlook
12.1. South America Nectars Revenue (USD Million), by Segments (2021-2032)
12.1.1. South America Nectars Revenue (USD Million) by Type (2021-2032)
12.1.2. South America Nectars Revenue (USD Million) by Application (2021-2032)
12.1.3. South America Nectars Revenue (USD Million) by Product (2021-2032)
By Type
99% juice content
25 to 99% juice content
25% juice content
By Application
Food and Beverages
Bakery and Confectionary
Others
Chapter 13. Middle East and Africa Nectars Analysis and Outlook
13.1. Middle East and Africa Nectars Revenue (USD Million), by Segments (2021-2032)
13.1.1. Middle East and Africa Nectars Revenue (USD Million) by Type (2021-2032)
13.1.2. Middle East and Africa Nectars Revenue (USD Million) by Application (2021-2032)
13.1.3. Middle East and Africa Nectars Revenue (USD Million) by Product (2021-2032)
By Type
99% juice content
25 to 99% juice content
25% juice content
By Application
Food and Beverages
Bakery and Confectionary
Others
Chapter 14. Nectars Company Profiles
14.1 Business Overview
14.2 Product Profiles
14.3 SWOT Profiles
14.5 Recent Developments
14.6 Financial Profile
List of Companies
AGRANA Group
China Haisheng Juice Holdings Co. Ltd and
Döhler
Kanegrade Ltd
Kerry Group Plc
SkyPeople Fruit Juice Inc
SunOpta Inc
15. Methodology and Data Sources
15.1 Customization Offerings
15.2 Subscription Services
15.3 Related Reports
15.4 Publisher Expertise
LIST OF TABLES
Table 1 Market Segmentation Analysis
Table 2 Global Nectars Market Share of Leading Companies, 2023
Table 3 Product Offerings of Leading Companies
Table 4 Low Growth Scenario Forecasts
Table 5 Reference Case Growth Scenario
Table 6 High Growth Case Scenario
Table 7 Global Nectars Revenue (USD Million) And CAGR (%) By Type (2021-2032)
Table 8 Global Nectars Revenue (USD Million) And CAGR (%) By Application (2021-2032)
Table 9 Global Nectars Revenue (USD Million) And CAGR (%) By Product (2021-2032)
Table 10 Global Nectars Market Revenue (USD Million) By Regions (2021-2032)
Table 11 Global Nectars Market Share (%) By Regions (2021-2032)
Table 12 North America Nectars Revenue (USD Million) By Country (2021-2032)
Table 13 Europe Nectars Revenue (USD Million) By Country (2021-2032)
Table 14 Asia Pacific Nectars Revenue (USD Million) By Country (2021-2032)
Table 15 South America Nectars Revenue (USD Million) By Country (2021-2032)
Table 16 Middle East and Africa Nectars Revenue (USD Million) By Region (2021-2032)
Table 17 North America Nectars Revenue (USD Million) By Type (2021-2032)
Table 18 North America Nectars Revenue (USD Million) By Application (2021-2032)
Table 19 North America Nectars Revenue (USD Million) By Product (2021-2032)
Table 20 Europe Nectars Revenue (USD Million) By Type (2021-2032)
Table 21 Europe Nectars Revenue (USD Million) By Application (2021-2032)
Table 22 Europe Nectars Revenue (USD Million) By Product (2021-2032)
Table 23 Asia Pacific Nectars Revenue (USD Million) By Type (2021-2032)
Table 24 Asia Pacific Nectars Revenue (USD Million) By Application (2021-2032)
Table 25 Asia Pacific Nectars Revenue (USD Million) By Product (2021-2032)
Table 26 South America Nectars Revenue (USD Million) By Type (2021-2032)
Table 27 South America Nectars Revenue (USD Million) By Application (2021-2032)
Table 28 South America Nectars Revenue (USD Million) By Product (2021-2032)
Table 29 Middle East and Africa Nectars Revenue (USD Million) By Type (2021-2032)
Table 30 Middle East and Africa Nectars Revenue (USD Million) By Application (2021-2032)
Table 31 Middle East and Africa Nectars Revenue (USD Million) By Product (2021-2032)
LIST OF FIGURES
Figure 1. Market Scope
Figure 2. Pricing Forecasts Per Unit, 2023- 2032
Figure 3. Porter’s Five Forces
Figure 4. Global Nectars Market Revenue (USD Million) By Regions (2021-2032)
Figure 5. Global Nectars Market Share (%) By Regions (2023)
Figure 6. North America Nectars Revenue (USD Million) By Country (2021-2032)
Figure 7. United States Nectars Revenue (USD Million) By Country (2021-2032)
Figure 8. Canada Nectars Revenue (USD Million) By Country (2021-2032)
Figure 9. Mexico Nectars Revenue (USD Million) By Country (2021-2032)
Figure 10. Europe Nectars Revenue (USD Million) By Country (2021-2032)
Figure 11. Germany Nectars Revenue (USD Million) By Country (2021-2032)
Figure 12. France Nectars Revenue (USD Million) By Country (2021-2032)
Figure 13. United Kingdom Nectars Revenue (USD Million) By Country (2021-2032)
Figure 14. Spain Nectars Revenue (USD Million) By Country (2021-2032)
Figure 15. Italy Nectars Revenue (USD Million) By Country (2021-2032)
Figure 16. Russia Nectars Revenue (USD Million) By Country (2021-2032)
Figure 17. Rest of Europe Nectars Revenue (USD Million) By Country (2021-2032)
Figure 11. Asia Pacific Nectars Revenue (USD Million) By Country (2021-2032)
Figure 12. China Nectars Revenue (USD Million) By Country (2021-2032)
Figure 13. Japan Nectars Revenue (USD Million) By Country (2021-2032)
Figure 14. India Nectars Revenue (USD Million) By Country (2021-2032)
Figure 15. South Korea Nectars Revenue (USD Million) By Country (2021-2032)
Figure 16. Australia Nectars Revenue (USD Million) By Country (2021-2032)
Figure 17. South East Asia Nectars Revenue (USD Million) By Country (2021-2032)
Figure 18. South America Nectars Revenue (USD Million) By Country (2021-2032)
Figure 19. Brazil Nectars Revenue (USD Million) By Country (2021-2032)
Figure 20. Argentina Nectars Revenue (USD Million) By Country (2021-2032)
Figure 21. Rest of Asia Pacific Nectars Revenue (USD Million) By Country (2021-2032)
Figure 22. Middle East and Africa Nectars Revenue (USD Million) By Region (2021-2032)
Figure 23. Saudi Arabia Nectars Revenue (USD Million) By Region (2021-2032)
Figure 24. The UAE Nectars Revenue (USD Million) By Region (2021-2032)
Figure 25. Rest of Middle East Nectars Revenue (USD Million) By Region (2021-2032)
Figure 26. South Africa Nectars Revenue (USD Million) By Region (2021-2032)
Figure 27. Africa Nectars Revenue (USD Million) By Region (2021-2032)
Figure 28. North America Nectars Revenue (USD Million) By Type (2021-2032)
Figure 29. North America Nectars Revenue (USD Million) By Application (2021-2032)
Figure 30. North America Nectars Revenue (USD Million) By Product (2021-2032)
Figure 31. Europe Nectars Revenue (USD Million) By Type (2021-2032)
Figure 32. Europe Nectars Revenue (USD Million) By Application (2021-2032)
Figure 33. Europe Nectars Revenue (USD Million) By Product (2021-2032)
Figure 34. Asia Pacific Nectars Revenue (USD Million) By Type (2021-2032)
Figure 35. Asia Pacific Nectars Revenue (USD Million) By Application (2021-2032)
Figure 36. Asia Pacific Nectars Revenue (USD Million) By Product (2021-2032)
Figure 37. South America Nectars Revenue (USD Million) By Type (2021-2032)
Figure 38. South America Nectars Revenue (USD Million) By Application (2021-2032)
Figure 39. South America Nectars Revenue (USD Million) By Product (2021-2032)
Figure 40. Middle East and Africa Nectars Revenue (USD Million) By Type (2021-2032)
Figure 41. Middle East and Africa Nectars Revenue (USD Million) By Application (2021-2032)
Figure 42. Middle East and Africa Nectars Revenue (USD Million) By Product (2021-2032)
By Type
99% juice content
25 to 99% juice content
25% juice content
By Application
Food and Beverages
Bakery and Confectionary
Others
Countries Analyzed
North America (US, Canada, Mexico)
Europe (Germany, UK, France, Spain, Italy, Russia, Rest of Europe)
Asia Pacific (China, India, Japan, South Korea, Australia, South East Asia, Rest of Asia)
South America (Brazil, Argentina, Rest of South America)
Middle East and Africa (Saudi Arabia, UAE, Rest of Middle East, South Africa, Egypt, Rest of Africa)
