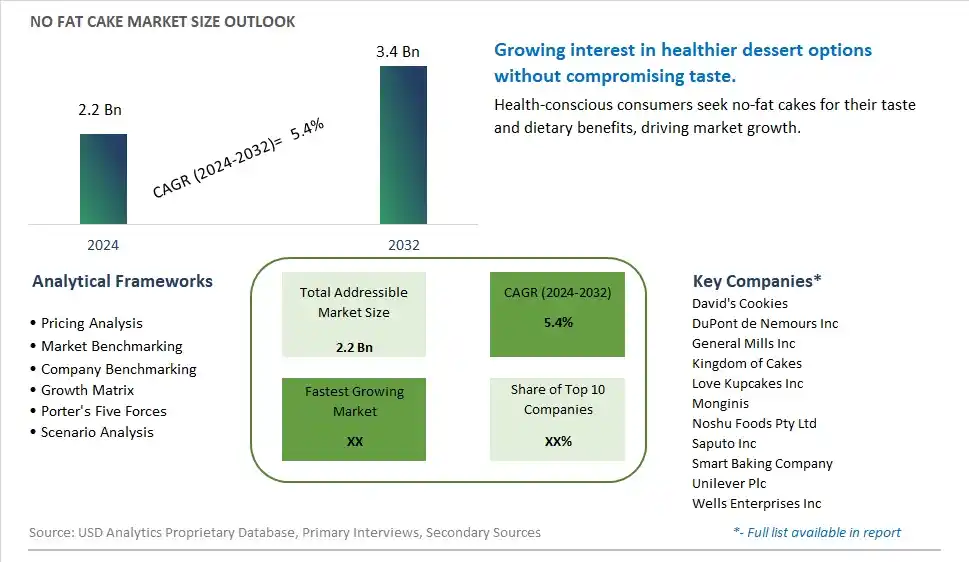
Global No Fat Cake Market Size is valued at $2.2 Billion in 2024 and is forecast to register a growth rate (CAGR) of 5.4% to reach $3.4 Billion by 2032.
The global No Fat Cake Market Comprehensive Study analyzes and forecasts the market size across 6 regions and 24 countries for diverse segments -By Nature (Organic, Conventional), By Sales Channel (Bakery & Pastry Shops, Confectionery Shops, Restaurants & Hotels, Household, Online Channels, Others), By Dietary Special Needs (Gluten-Free, Dairy-Free, Soy-Free, Wheat-Free, Cholesterol-Free, GMO-Free)
An Introduction to No Fat Cake Market
The No Fat Cake Market involves the production and sale of cakes formulated without fats, catering to health-conscious consumers seeking indulgent yet nutritious dessert options. The market is driven by increasing health consciousness, rising prevalence of obesity and related health conditions, and growing demand for fat-free and low-calorie foods. Additionally, advancements in cake formulations and the expansion of product offerings support market growth.
No fat Cake Competitive Landscape
The market report analyses the leading companies in the industry including David's Cookies, DuPont de Nemours Inc, General Mills Inc, Kingdom of Cakes, Love Kupcakes Inc, Monginis, Noshu Foods Pty Ltd, Saputo Inc, Smart Baking Company, Unilever Plc, Wells Enterprises Inc, and Others.
No fat Cake Market Dynamics
No Fat Cake Market Trend: Growing Popularity of Low-Calorie Desserts
The most prominent trend in the No Fat Cake Market is the growing popularity of low-calorie desserts. As consumers seek healthier alternatives to traditional high-calorie cakes, no fat cakes are gaining traction for their ability to offer indulgence without the guilt.
No Fat Cake Market Driver: Health Consciousness and Weight Management
A key driver in the No Fat Cake Market is health consciousness and weight management. As more individuals focus on maintaining a healthy weight and reducing fat intake, there is a rising demand for no fat cakes that align with their dietary goals, supporting market growth.
No Fat Cake Market Opportunity: Innovation in Flavors and Textures
One significant opportunity in the No Fat Cake Market lies in innovation in flavors and textures. Companies can develop new no fat cake products with diverse and appealing flavors, such as fruit-infused, chocolate, and exotic varieties, and improve the texture to ensure a satisfying eating experience. By offering diverse and tasty options, manufacturers can attract a broader consumer base and drive market growth.
No Fat Cake Market Share Analysis- Largest Segment by Nature
In the No Fat Cake Market, the Conventional segment is the largest. Conventional no-fat cakes are more prevalent due to their broader availability and lower cost compared to organic options. They cater to a wide audience looking for healthier dessert alternatives without the premium pricing associated with organic products. The conventional segment benefits from established production and distribution networks, making it more accessible to a larger consumer base. Additionally, the familiarity and lower cost of conventional no-fat cakes contribute to their dominance in the market.
No Fat Cake Market Share Analysis- Fastest Growing Segment by Sales Channel
The Online Channels segment is poised to grow the fastest in the No Fat Cake Market over the next five years. The surge in e-commerce and the increasing preference for online shopping have led to a significant rise in the purchase of specialty products like no-fat cakes through online platforms. Consumers are drawn to the convenience, variety, and the ability to easily compare products and prices online. This shift is also supported by improvements in online delivery services and the growing trend of direct-to-consumer sales models, driving rapid growth in this segment.
No Fat Cake Market Share Analysis- Largest Segment by Dietary Special Needs
The Gluten-Free segment is the largest in the No Fat Cake Market. The increasing prevalence of gluten sensitivities and celiac disease has driven significant demand for gluten-free products. No-fat cakes that cater to gluten-free dietary needs have become a major focus due to the large number of consumers seeking gluten-free options for health reasons. The market for gluten-free no-fat cakes benefits from strong consumer awareness and demand for specialty products that meet specific dietary requirements, making it the leading segment in this category.
No fat Cake Market Segmentation
By Nature
Organic
Conventional
By Sales Channel
Bakery & Pastry Shops
Confectionery Shops
Restaurants & Hotels
Household
Online Channels
Others
By Dietary Special Needs
Gluten-Free
Dairy-Free
Soy-Free
Wheat-Free
Cholesterol-Free
GMO-Free
Countries Analyzed
North America (US, Canada, Mexico)
Europe (Germany, UK, France, Spain, Italy, Russia, Rest of Europe)
Asia Pacific (China, India, Japan, South Korea, Australia, South East Asia, Rest of Asia)
South America (Brazil, Argentina, Rest of South America)
Middle East and Africa (Saudi Arabia, UAE, Rest of Middle East, South Africa, Egypt, Rest of Africa)
No fat Cake Companies Profiled in the Study
David's Cookies
DuPont de Nemours Inc
General Mills Inc
Kingdom of Cakes
Love Kupcakes Inc
Monginis
Noshu Foods Pty Ltd
Saputo Inc
Smart Baking Company
Unilever Plc
Wells Enterprises Inc
*- List Not Exhaustive
Chapter 1. TABLE OF CONTENTS
Chapter 2. Introduction to No fat Cake Market
2.1. Market Overview
2.2. Key Statistics and Report Highlights
2.3. Scope of the Comprehensive Study
2.3.1. Market Definition
2.3.2 Countries and Regions Covered
2.3.3 Research Objective
2.3.4 Units, Currency, and Conversions
2.3.5 Industry Value Chain
2.4. Key Market Segments
2.5. Key Companies
2.6. Study Period
Chapter 3. Strategic Analysis Review
3.1. No fat Cake Pricing Analysis and Forecast
3.2. Porter’s Five Forces
3.3. Market Ecosystem
3.4. SWOT Analysis
3.5. Regulatory Scenario
3.3. Effects of Inflation, Russia-Ukraine War, moderating economic growth, and other macroeconomic factors
Chapter 4. Competitive Landscape
4.1. Market Share Analysis
4.1.1. Global No fat Cake Market Share by Company, 2023
4.1.2. Product Offerings of Leading No fat Cake Companies
4.2. Market Entropy
4.2.1. New Product Launches in the Industry
4.2.2. Mergers, Acquisitions, Joint ventures, and Partnerships
4.3. Key Strategies and Best Practices
Chapter 5. Global Market Projections: Best, Reference, and Low Case Scenarios
5.1. Growth Analysis- Case Scenario Definitions
5.2. Low Growth Case Scenario Forecasts
5.3. Reference Growth Case Scenario Forecasts
5.4. High Growth Case Scenario Forecasts
Chapter 6. Market Dynamics
6.1. No fat Cake Market Drivers
6.2. No fat Cake Market Challenges
6.6. No fat Cake Market Opportunities
6.4. No fat Cake Market Trends
Chapter 7. Global No fat Cake Market Outlook Trends
7.1. Global No fat Cake Revenue (USD Million) and CAGR (%) by Type (2021-2032)
7.2. Global No fat Cake Revenue (USD Million) and CAGR (%) by Application (2021-2032)
7.3. Global No fat Cake Revenue (USD Million) and CAGR (%) by Product (2021-2032)
By Nature
Organic
Conventional
By Sales Channel
Bakery & Pastry Shops
Confectionery Shops
Restaurants & Hotels
Household
Online Channels
Others
By Dietary Special Needs
Gluten-Free
Dairy-Free
Soy-Free
Wheat-Free
Cholesterol-Free
GMO-Free
Chapter 8. Global No fat Cake Regional Analysis and Outlook
8.1. Global No fat Cake Revenue (USD Million) By Regions (2021- 2032)
8.2. North America No fat Cake Revenue (USD Million) by Country (2021-2032)
8.2.1. United States No fat Cake Regional Analysis and Outlook
8.2.2. Canada No fat Cake Regional Analysis and Outlook
8.2.3. Mexico No fat Cake Regional Analysis and Outlook
8.3. Europe No fat Cake Revenue (USD Million), by Country (2021-2032)
8.3.1. Germany No fat Cake Regional Analysis and Outlook
8.3.2. France No fat Cake Regional Analysis and Outlook
8.3.3. United Kingdom No fat Cake Regional Analysis and Outlook
8.3.4. Spain No fat Cake Regional Analysis and Outlook
8.3.5. Italy No fat Cake Regional Analysis and Outlook
8.3.6. Russia No fat Cake Regional Analysis and Outlook
8.3.7. Rest of Europe No fat Cake Regional Analysis and Outlook
8.4. Asia Pacific No fat Cake Revenue (USD Million) by Country (2021-2032)
8.4.1. China No fat Cake Regional Analysis and Outlook
8.4.2. Japan No fat Cake Regional Analysis and Outlook
8.4.3. India No fat Cake Regional Analysis and Outlook
8.4.4. South Korea No fat Cake Regional Analysis and Outlook
8.4.5. Australia No fat Cake Regional Analysis and Outlook
8.4.6. South East Asia No fat Cake Regional Analysis and Outlook
8.4.7. Rest of Asia Pacific No fat Cake Regional Analysis and Outlook
8.5. South America No fat Cake Revenue (USD Million), by Country (2021-2032)
8.5.1. Brazil No fat Cake Regional Analysis and Outlook
8.5.2. Argentina No fat Cake Regional Analysis and Outlook
8.5.3. Rest of South America No fat Cake Regional Analysis and Outlook
8.6. Middle East and Africa No fat Cake Revenue (USD Million) by Country (2021-2032)
8.6.1. Middle East No fat Cake Regional Analysis and Outlook
8.6.2. Africa No fat Cake Regional Analysis and Outlook
Chapter 9. North America No fat Cake Analysis and Outlook
9.1. North America No fat Cake Revenue (USD Million) by Segments (2021-2032)
9.1.1. North America No fat Cake Revenue (USD Million) by Type (2021-2032)
9.1.2. North America No fat Cake Revenue (USD Million) by Application (2021-2032)
9.1.3. North America No fat Cake Revenue (USD Million) by Product (2021-2032)
By Nature
Organic
Conventional
By Sales Channel
Bakery & Pastry Shops
Confectionery Shops
Restaurants & Hotels
Household
Online Channels
Others
By Dietary Special Needs
Gluten-Free
Dairy-Free
Soy-Free
Wheat-Free
Cholesterol-Free
GMO-Free
Chapter 10. Europe No fat Cake Analysis and Outlook
10.1. Europe No fat Cake Revenue (USD Million), by Segments (USD Million) (2021-2032)
10.1.1. Europe No fat Cake Revenue (USD Million) by Type (2021-2032)
10.1.2. Europe No fat Cake Revenue (USD Million) by Application (2021-2032)
10.1.3. Europe No fat Cake Revenue (USD Million) by Product (2021-2032)
By Nature
Organic
Conventional
By Sales Channel
Bakery & Pastry Shops
Confectionery Shops
Restaurants & Hotels
Household
Online Channels
Others
By Dietary Special Needs
Gluten-Free
Dairy-Free
Soy-Free
Wheat-Free
Cholesterol-Free
GMO-Free
Chapter 11. Asia Pacific No fat Cake Analysis and Outlook
11.1. Asia Pacific No fat Cake Revenue (USD Million), and Revenue (USD Million) by Segments (2021-2032)
11.1.1. Asia Pacific No fat Cake Revenue (USD Million) by Type (2021-2032)
11.1.2. Asia Pacific No fat Cake Revenue (USD Million) by Application (2021-2032)
11.1.3. Asia Pacific No fat Cake Revenue (USD Million) by Product (2021-2032)
By Nature
Organic
Conventional
By Sales Channel
Bakery & Pastry Shops
Confectionery Shops
Restaurants & Hotels
Household
Online Channels
Others
By Dietary Special Needs
Gluten-Free
Dairy-Free
Soy-Free
Wheat-Free
Cholesterol-Free
GMO-Free
Chapter 12. South America No fat Cake Analysis and Outlook
12.1. South America No fat Cake Revenue (USD Million), by Segments (2021-2032)
12.1.1. South America No fat Cake Revenue (USD Million) by Type (2021-2032)
12.1.2. South America No fat Cake Revenue (USD Million) by Application (2021-2032)
12.1.3. South America No fat Cake Revenue (USD Million) by Product (2021-2032)
By Nature
Organic
Conventional
By Sales Channel
Bakery & Pastry Shops
Confectionery Shops
Restaurants & Hotels
Household
Online Channels
Others
By Dietary Special Needs
Gluten-Free
Dairy-Free
Soy-Free
Wheat-Free
Cholesterol-Free
GMO-Free
Chapter 13. Middle East and Africa No fat Cake Analysis and Outlook
13.1. Middle East and Africa No fat Cake Revenue (USD Million), by Segments (2021-2032)
13.1.1. Middle East and Africa No fat Cake Revenue (USD Million) by Type (2021-2032)
13.1.2. Middle East and Africa No fat Cake Revenue (USD Million) by Application (2021-2032)
13.1.3. Middle East and Africa No fat Cake Revenue (USD Million) by Product (2021-2032)
By Nature
Organic
Conventional
By Sales Channel
Bakery & Pastry Shops
Confectionery Shops
Restaurants & Hotels
Household
Online Channels
Others
By Dietary Special Needs
Gluten-Free
Dairy-Free
Soy-Free
Wheat-Free
Cholesterol-Free
GMO-Free
Chapter 14. No fat Cake Company Profiles
14.1 Business Overview
14.2 Product Profiles
14.3 SWOT Profiles
14.5 Recent Developments
14.6 Financial Profile
List of Companies
David's Cookies
DuPont de Nemours Inc
General Mills Inc
Kingdom of Cakes
Love Kupcakes Inc
Monginis
Noshu Foods Pty Ltd
Saputo Inc
Smart Baking Company
Unilever Plc
Wells Enterprises Inc
15. Methodology and Data Sources
15.1 Customization Offerings
15.2 Subscription Services
15.3 Related Reports
15.4 Publisher Expertise
LIST OF TABLES
Table 1 Market Segmentation Analysis
Table 2 Global No fat Cake Market Share of Leading Companies, 2023
Table 3 Product Offerings of Leading Companies
Table 4 Low Growth Scenario Forecasts
Table 5 Reference Case Growth Scenario
Table 6 High Growth Case Scenario
Table 7 Global No fat Cake Revenue (USD Million) And CAGR (%) By Type (2021-2032)
Table 8 Global No fat Cake Revenue (USD Million) And CAGR (%) By Application (2021-2032)
Table 9 Global No fat Cake Revenue (USD Million) And CAGR (%) By Product (2021-2032)
Table 10 Global No fat Cake Market Revenue (USD Million) By Regions (2021-2032)
Table 11 Global No fat Cake Market Share (%) By Regions (2021-2032)
Table 12 North America No fat Cake Revenue (USD Million) By Country (2021-2032)
Table 13 Europe No fat Cake Revenue (USD Million) By Country (2021-2032)
Table 14 Asia Pacific No fat Cake Revenue (USD Million) By Country (2021-2032)
Table 15 South America No fat Cake Revenue (USD Million) By Country (2021-2032)
Table 16 Middle East and Africa No fat Cake Revenue (USD Million) By Region (2021-2032)
Table 17 North America No fat Cake Revenue (USD Million) By Type (2021-2032)
Table 18 North America No fat Cake Revenue (USD Million) By Application (2021-2032)
Table 19 North America No fat Cake Revenue (USD Million) By Product (2021-2032)
Table 20 Europe No fat Cake Revenue (USD Million) By Type (2021-2032)
Table 21 Europe No fat Cake Revenue (USD Million) By Application (2021-2032)
Table 22 Europe No fat Cake Revenue (USD Million) By Product (2021-2032)
Table 23 Asia Pacific No fat Cake Revenue (USD Million) By Type (2021-2032)
Table 24 Asia Pacific No fat Cake Revenue (USD Million) By Application (2021-2032)
Table 25 Asia Pacific No fat Cake Revenue (USD Million) By Product (2021-2032)
Table 26 South America No fat Cake Revenue (USD Million) By Type (2021-2032)
Table 27 South America No fat Cake Revenue (USD Million) By Application (2021-2032)
Table 28 South America No fat Cake Revenue (USD Million) By Product (2021-2032)
Table 29 Middle East and Africa No fat Cake Revenue (USD Million) By Type (2021-2032)
Table 30 Middle East and Africa No fat Cake Revenue (USD Million) By Application (2021-2032)
Table 31 Middle East and Africa No fat Cake Revenue (USD Million) By Product (2021-2032)
LIST OF FIGURES
Figure 1. Market Scope
Figure 2. Pricing Forecasts Per Unit, 2023- 2032
Figure 3. Porter’s Five Forces
Figure 4. Global No fat Cake Market Revenue (USD Million) By Regions (2021-2032)
Figure 5. Global No fat Cake Market Share (%) By Regions (2023)
Figure 6. North America No fat Cake Revenue (USD Million) By Country (2021-2032)
Figure 7. United States No fat Cake Revenue (USD Million) By Country (2021-2032)
Figure 8. Canada No fat Cake Revenue (USD Million) By Country (2021-2032)
Figure 9. Mexico No fat Cake Revenue (USD Million) By Country (2021-2032)
Figure 10. Europe No fat Cake Revenue (USD Million) By Country (2021-2032)
Figure 11. Germany No fat Cake Revenue (USD Million) By Country (2021-2032)
Figure 12. France No fat Cake Revenue (USD Million) By Country (2021-2032)
Figure 13. United Kingdom No fat Cake Revenue (USD Million) By Country (2021-2032)
Figure 14. Spain No fat Cake Revenue (USD Million) By Country (2021-2032)
Figure 15. Italy No fat Cake Revenue (USD Million) By Country (2021-2032)
Figure 16. Russia No fat Cake Revenue (USD Million) By Country (2021-2032)
Figure 17. Rest of Europe No fat Cake Revenue (USD Million) By Country (2021-2032)
Figure 11. Asia Pacific No fat Cake Revenue (USD Million) By Country (2021-2032)
Figure 12. China No fat Cake Revenue (USD Million) By Country (2021-2032)
Figure 13. Japan No fat Cake Revenue (USD Million) By Country (2021-2032)
Figure 14. India No fat Cake Revenue (USD Million) By Country (2021-2032)
Figure 15. South Korea No fat Cake Revenue (USD Million) By Country (2021-2032)
Figure 16. Australia No fat Cake Revenue (USD Million) By Country (2021-2032)
Figure 17. South East Asia No fat Cake Revenue (USD Million) By Country (2021-2032)
Figure 18. South America No fat Cake Revenue (USD Million) By Country (2021-2032)
Figure 19. Brazil No fat Cake Revenue (USD Million) By Country (2021-2032)
Figure 20. Argentina No fat Cake Revenue (USD Million) By Country (2021-2032)
Figure 21. Rest of Asia Pacific No fat Cake Revenue (USD Million) By Country (2021-2032)
Figure 22. Middle East and Africa No fat Cake Revenue (USD Million) By Region (2021-2032)
Figure 23. Saudi Arabia No fat Cake Revenue (USD Million) By Region (2021-2032)
Figure 24. The UAE No fat Cake Revenue (USD Million) By Region (2021-2032)
Figure 25. Rest of Middle East No fat Cake Revenue (USD Million) By Region (2021-2032)
Figure 26. South Africa No fat Cake Revenue (USD Million) By Region (2021-2032)
Figure 27. Africa No fat Cake Revenue (USD Million) By Region (2021-2032)
Figure 28. North America No fat Cake Revenue (USD Million) By Type (2021-2032)
Figure 29. North America No fat Cake Revenue (USD Million) By Application (2021-2032)
Figure 30. North America No fat Cake Revenue (USD Million) By Product (2021-2032)
Figure 31. Europe No fat Cake Revenue (USD Million) By Type (2021-2032)
Figure 32. Europe No fat Cake Revenue (USD Million) By Application (2021-2032)
Figure 33. Europe No fat Cake Revenue (USD Million) By Product (2021-2032)
Figure 34. Asia Pacific No fat Cake Revenue (USD Million) By Type (2021-2032)
Figure 35. Asia Pacific No fat Cake Revenue (USD Million) By Application (2021-2032)
Figure 36. Asia Pacific No fat Cake Revenue (USD Million) By Product (2021-2032)
Figure 37. South America No fat Cake Revenue (USD Million) By Type (2021-2032)
Figure 38. South America No fat Cake Revenue (USD Million) By Application (2021-2032)
Figure 39. South America No fat Cake Revenue (USD Million) By Product (2021-2032)
Figure 40. Middle East and Africa No fat Cake Revenue (USD Million) By Type (2021-2032)
Figure 41. Middle East and Africa No fat Cake Revenue (USD Million) By Application (2021-2032)
Figure 42. Middle East and Africa No fat Cake Revenue (USD Million) By Product (2021-2032)
By Nature
Organic
Conventional
By Sales Channel
Bakery & Pastry Shops
Confectionery Shops
Restaurants & Hotels
Household
Online Channels
Others
By Dietary Special Needs
Gluten-Free
Dairy-Free
Soy-Free
Wheat-Free
Cholesterol-Free
GMO-Free
Countries Analyzed
North America (US, Canada, Mexico)
Europe (Germany, UK, France, Spain, Italy, Russia, Rest of Europe)
Asia Pacific (China, India, Japan, South Korea, Australia, South East Asia, Rest of Asia)
South America (Brazil, Argentina, Rest of South America)
Middle East and Africa (Saudi Arabia, UAE, Rest of Middle East, South Africa, Egypt, Rest of Africa)
