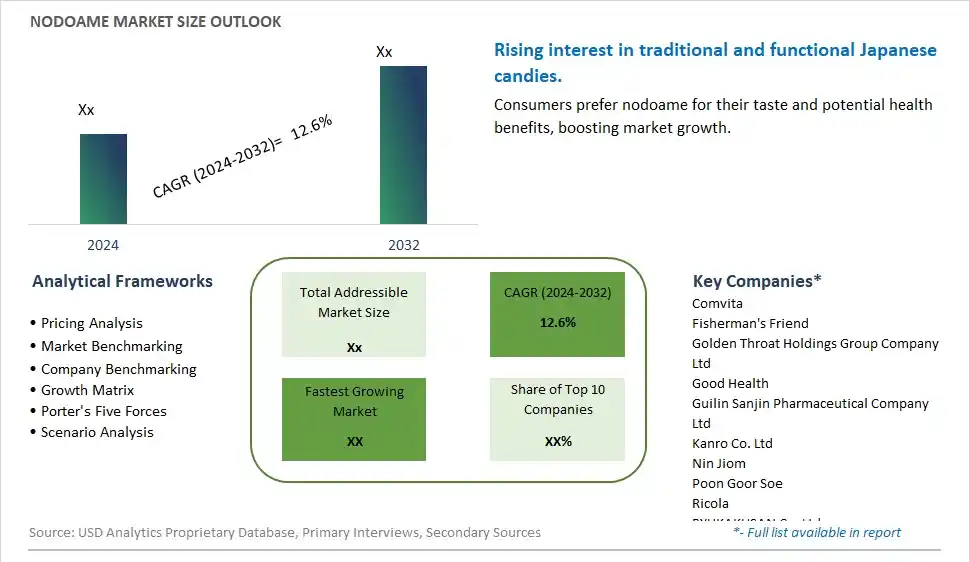
Global Nodoame Market Size is valued at $XX Million in 2024 and is forecast to register a growth rate (CAGR) of 12.6% to reach $XX Million by 2032.
The global Nodoame Market Comprehensive Study analyzes and forecasts the market size across 6 regions and 24 countries for diverse segments -By Type (Medicinal, Food), By Application (Supermarkets, Drugstores, Others)
An Introduction to Nodoame Market
The Nodoame Market focuses on the production and sale of throat lozenges and candies designed to soothe sore throats and provide relief from cough and irritation. These products cater to consumers seeking convenient and effective remedies for throat discomfort. The market is driven by increasing prevalence of respiratory and throat conditions, rising demand for over-the-counter remedies, and growing awareness about throat health. Additionally, advancements in lozenge formulations and packaging designs support market growth.
Nodoame Competitive Landscape
The market report analyses the leading companies in the industry including Comvita, Fisherman's Friend, Golden Throat Holdings Group Company Ltd, Good Health, Guilin Sanjin Pharmaceutical Company Ltd, Kanro Co. Ltd, Nin Jiom, Poon Goor Soe, Ricola, RYUKAKUSAN Co. Ltd, UHA Mikakuto Co.,Ltd, Vocalzone, Wong Lo Kat, Zirkulin, and Others.
Nodoame Market Dynamics
Nodoame Market Trend: Increasing Popularity of Traditional Japanese Confectionery
The most prominent trend in the Nodoame Market is the increasing popularity of traditional Japanese confectionery. Nodoame, known for its soothing properties and variety of flavors, is gaining traction among consumers seeking unique and culturally rich sweets. This trend is driven by the growing global interest in Japanese cuisine and the desire for authentic and artisanal candy experiences.
Nodoame Market Driver: Health Benefits and Natural Ingredients
A key driver in the Nodoame Market is the health benefits and natural ingredients associated with these traditional sweets. Nodoame, often made with natural herbs and honey, is valued for its soothing effects on the throat and overall wellness. As consumers become more health-conscious, there is a rising demand for confections that offer not only great taste but also functional health benefits, supporting market growth.
Nodoame Market Opportunity: Innovation in Flavor and Packaging
One significant opportunity in the Nodoame Market lies in innovation in flavor and packaging. Companies can develop new Nodoame products with unique and appealing flavors, such as exotic fruits, herbal blends, and contemporary twists on traditional recipes. Additionally, attractive and convenient packaging solutions can enhance the consumer experience, making Nodoame a desirable option for both local and international markets.
Nodoame Market Share Analysis- Largest Segment by Type
In the Nodoame Market, the Medicinal type is the largest segment. Nodoame, a traditional Japanese ingredient often used in herbal remedies and supplements, has a significant presence in the medicinal segment due to its recognized health benefits. It is commonly used for its purported anti-inflammatory, antioxidant, and immune-boosting properties, making it a preferred choice in the pharmaceutical and nutraceutical industries. The growing awareness of natural health products and the increasing demand for alternative medicine contribute to the dominance of medicinal nodoame in the market. Its established reputation and continued consumer interest in health and wellness support its position as the largest segment.
Nodoame Market Share Analysis- Fastest Growing Segment by Application
The Drugstores application segment of the Nodoame Market is expected to grow the fastest over the next five years. This growth can be attributed to the increasing consumer preference for health-focused and natural products, which are increasingly available in drugstores. Nodoame's use in dietary supplements and health products aligns with the trends towards natural remedies and preventative health. Drugstores are expanding their offerings to include more specialized health products, driven by consumer demand for effective and natural solutions. Additionally, the convenience of purchasing health supplements and medicinal products at drugstores supports this segment's rapid growth.
Nodoame Market Segmentation
By Type
Medicinal
Food
By Application
Supermarkets
Drugstores
Others
Countries Analyzed
North America (US, Canada, Mexico)
Europe (Germany, UK, France, Spain, Italy, Russia, Rest of Europe)
Asia Pacific (China, India, Japan, South Korea, Australia, South East Asia, Rest of Asia)
South America (Brazil, Argentina, Rest of South America)
Middle East and Africa (Saudi Arabia, UAE, Rest of Middle East, South Africa, Egypt, Rest of Africa)
Nodoame Companies Profiled in the Study
Comvita
Fisherman's Friend
Golden Throat Holdings Group Company Ltd
Good Health
Guilin Sanjin Pharmaceutical Company Ltd
Kanro Co. Ltd
Nin Jiom
Poon Goor Soe
Ricola
RYUKAKUSAN Co. Ltd
UHA Mikakuto Co.,Ltd
Vocalzone
Wong Lo Kat
Zirkulin
*- List Not Exhaustive
Chapter 1. TABLE OF CONTENTS
Chapter 2. Introduction to Nodoame Market
2.1. Market Overview
2.2. Key Statistics and Report Highlights
2.3. Scope of the Comprehensive Study
2.3.1. Market Definition
2.3.2 Countries and Regions Covered
2.3.3 Research Objective
2.3.4 Units, Currency, and Conversions
2.3.5 Industry Value Chain
2.4. Key Market Segments
2.5. Key Companies
2.6. Study Period
Chapter 3. Strategic Analysis Review
3.1. Nodoame Pricing Analysis and Forecast
3.2. Porter’s Five Forces
3.3. Market Ecosystem
3.4. SWOT Analysis
3.5. Regulatory Scenario
3.3. Effects of Inflation, Russia-Ukraine War, moderating economic growth, and other macroeconomic factors
Chapter 4. Competitive Landscape
4.1. Market Share Analysis
4.1.1. Global Nodoame Market Share by Company, 2023
4.1.2. Product Offerings of Leading Nodoame Companies
4.2. Market Entropy
4.2.1. New Product Launches in the Industry
4.2.2. Mergers, Acquisitions, Joint ventures, and Partnerships
4.3. Key Strategies and Best Practices
Chapter 5. Global Market Projections: Best, Reference, and Low Case Scenarios
5.1. Growth Analysis- Case Scenario Definitions
5.2. Low Growth Case Scenario Forecasts
5.3. Reference Growth Case Scenario Forecasts
5.4. High Growth Case Scenario Forecasts
Chapter 6. Market Dynamics
6.1. Nodoame Market Drivers
6.2. Nodoame Market Challenges
6.6. Nodoame Market Opportunities
6.4. Nodoame Market Trends
Chapter 7. Global Nodoame Market Outlook Trends
7.1. Global Nodoame Revenue (USD Million) and CAGR (%) by Type (2021-2032)
7.2. Global Nodoame Revenue (USD Million) and CAGR (%) by Application (2021-2032)
7.3. Global Nodoame Revenue (USD Million) and CAGR (%) by Product (2021-2032)
By Type
Medicinal
Food
By Application
Supermarkets
Drugstores
Others
Chapter 8. Global Nodoame Regional Analysis and Outlook
8.1. Global Nodoame Revenue (USD Million) By Regions (2021- 2032)
8.2. North America Nodoame Revenue (USD Million) by Country (2021-2032)
8.2.1. United States Nodoame Regional Analysis and Outlook
8.2.2. Canada Nodoame Regional Analysis and Outlook
8.2.3. Mexico Nodoame Regional Analysis and Outlook
8.3. Europe Nodoame Revenue (USD Million), by Country (2021-2032)
8.3.1. Germany Nodoame Regional Analysis and Outlook
8.3.2. France Nodoame Regional Analysis and Outlook
8.3.3. United Kingdom Nodoame Regional Analysis and Outlook
8.3.4. Spain Nodoame Regional Analysis and Outlook
8.3.5. Italy Nodoame Regional Analysis and Outlook
8.3.6. Russia Nodoame Regional Analysis and Outlook
8.3.7. Rest of Europe Nodoame Regional Analysis and Outlook
8.4. Asia Pacific Nodoame Revenue (USD Million) by Country (2021-2032)
8.4.1. China Nodoame Regional Analysis and Outlook
8.4.2. Japan Nodoame Regional Analysis and Outlook
8.4.3. India Nodoame Regional Analysis and Outlook
8.4.4. South Korea Nodoame Regional Analysis and Outlook
8.4.5. Australia Nodoame Regional Analysis and Outlook
8.4.6. South East Asia Nodoame Regional Analysis and Outlook
8.4.7. Rest of Asia Pacific Nodoame Regional Analysis and Outlook
8.5. South America Nodoame Revenue (USD Million), by Country (2021-2032)
8.5.1. Brazil Nodoame Regional Analysis and Outlook
8.5.2. Argentina Nodoame Regional Analysis and Outlook
8.5.3. Rest of South America Nodoame Regional Analysis and Outlook
8.6. Middle East and Africa Nodoame Revenue (USD Million) by Country (2021-2032)
8.6.1. Middle East Nodoame Regional Analysis and Outlook
8.6.2. Africa Nodoame Regional Analysis and Outlook
Chapter 9. North America Nodoame Analysis and Outlook
9.1. North America Nodoame Revenue (USD Million) by Segments (2021-2032)
9.1.1. North America Nodoame Revenue (USD Million) by Type (2021-2032)
9.1.2. North America Nodoame Revenue (USD Million) by Application (2021-2032)
9.1.3. North America Nodoame Revenue (USD Million) by Product (2021-2032)
By Type
Medicinal
Food
By Application
Supermarkets
Drugstores
Others
Chapter 10. Europe Nodoame Analysis and Outlook
10.1. Europe Nodoame Revenue (USD Million), by Segments (USD Million) (2021-2032)
10.1.1. Europe Nodoame Revenue (USD Million) by Type (2021-2032)
10.1.2. Europe Nodoame Revenue (USD Million) by Application (2021-2032)
10.1.3. Europe Nodoame Revenue (USD Million) by Product (2021-2032)
By Type
Medicinal
Food
By Application
Supermarkets
Drugstores
Others
Chapter 11. Asia Pacific Nodoame Analysis and Outlook
11.1. Asia Pacific Nodoame Revenue (USD Million), and Revenue (USD Million) by Segments (2021-2032)
11.1.1. Asia Pacific Nodoame Revenue (USD Million) by Type (2021-2032)
11.1.2. Asia Pacific Nodoame Revenue (USD Million) by Application (2021-2032)
11.1.3. Asia Pacific Nodoame Revenue (USD Million) by Product (2021-2032)
By Type
Medicinal
Food
By Application
Supermarkets
Drugstores
Others
Chapter 12. South America Nodoame Analysis and Outlook
12.1. South America Nodoame Revenue (USD Million), by Segments (2021-2032)
12.1.1. South America Nodoame Revenue (USD Million) by Type (2021-2032)
12.1.2. South America Nodoame Revenue (USD Million) by Application (2021-2032)
12.1.3. South America Nodoame Revenue (USD Million) by Product (2021-2032)
By Type
Medicinal
Food
By Application
Supermarkets
Drugstores
Others
Chapter 13. Middle East and Africa Nodoame Analysis and Outlook
13.1. Middle East and Africa Nodoame Revenue (USD Million), by Segments (2021-2032)
13.1.1. Middle East and Africa Nodoame Revenue (USD Million) by Type (2021-2032)
13.1.2. Middle East and Africa Nodoame Revenue (USD Million) by Application (2021-2032)
13.1.3. Middle East and Africa Nodoame Revenue (USD Million) by Product (2021-2032)
By Type
Medicinal
Food
By Application
Supermarkets
Drugstores
Others
Chapter 14. Nodoame Company Profiles
14.1 Business Overview
14.2 Product Profiles
14.3 SWOT Profiles
14.5 Recent Developments
14.6 Financial Profile
List of Companies
Comvita
Fisherman's Friend
Golden Throat Holdings Group Company Ltd
Good Health
Guilin Sanjin Pharmaceutical Company Ltd
Kanro Co. Ltd
Nin Jiom
Poon Goor Soe
Ricola
RYUKAKUSAN Co. Ltd
UHA Mikakuto Co.,Ltd
Vocalzone
Wong Lo Kat
Zirkulin
15. Methodology and Data Sources
15.1 Customization Offerings
15.2 Subscription Services
15.3 Related Reports
15.4 Publisher Expertise
LIST OF TABLES
Table 1 Market Segmentation Analysis
Table 2 Global Nodoame Market Share of Leading Companies, 2023
Table 3 Product Offerings of Leading Companies
Table 4 Low Growth Scenario Forecasts
Table 5 Reference Case Growth Scenario
Table 6 High Growth Case Scenario
Table 7 Global Nodoame Revenue (USD Million) And CAGR (%) By Type (2021-2032)
Table 8 Global Nodoame Revenue (USD Million) And CAGR (%) By Application (2021-2032)
Table 9 Global Nodoame Revenue (USD Million) And CAGR (%) By Product (2021-2032)
Table 10 Global Nodoame Market Revenue (USD Million) By Regions (2021-2032)
Table 11 Global Nodoame Market Share (%) By Regions (2021-2032)
Table 12 North America Nodoame Revenue (USD Million) By Country (2021-2032)
Table 13 Europe Nodoame Revenue (USD Million) By Country (2021-2032)
Table 14 Asia Pacific Nodoame Revenue (USD Million) By Country (2021-2032)
Table 15 South America Nodoame Revenue (USD Million) By Country (2021-2032)
Table 16 Middle East and Africa Nodoame Revenue (USD Million) By Region (2021-2032)
Table 17 North America Nodoame Revenue (USD Million) By Type (2021-2032)
Table 18 North America Nodoame Revenue (USD Million) By Application (2021-2032)
Table 19 North America Nodoame Revenue (USD Million) By Product (2021-2032)
Table 20 Europe Nodoame Revenue (USD Million) By Type (2021-2032)
Table 21 Europe Nodoame Revenue (USD Million) By Application (2021-2032)
Table 22 Europe Nodoame Revenue (USD Million) By Product (2021-2032)
Table 23 Asia Pacific Nodoame Revenue (USD Million) By Type (2021-2032)
Table 24 Asia Pacific Nodoame Revenue (USD Million) By Application (2021-2032)
Table 25 Asia Pacific Nodoame Revenue (USD Million) By Product (2021-2032)
Table 26 South America Nodoame Revenue (USD Million) By Type (2021-2032)
Table 27 South America Nodoame Revenue (USD Million) By Application (2021-2032)
Table 28 South America Nodoame Revenue (USD Million) By Product (2021-2032)
Table 29 Middle East and Africa Nodoame Revenue (USD Million) By Type (2021-2032)
Table 30 Middle East and Africa Nodoame Revenue (USD Million) By Application (2021-2032)
Table 31 Middle East and Africa Nodoame Revenue (USD Million) By Product (2021-2032)
LIST OF FIGURES
Figure 1. Market Scope
Figure 2. Pricing Forecasts Per Unit, 2023- 2032
Figure 3. Porter’s Five Forces
Figure 4. Global Nodoame Market Revenue (USD Million) By Regions (2021-2032)
Figure 5. Global Nodoame Market Share (%) By Regions (2023)
Figure 6. North America Nodoame Revenue (USD Million) By Country (2021-2032)
Figure 7. United States Nodoame Revenue (USD Million) By Country (2021-2032)
Figure 8. Canada Nodoame Revenue (USD Million) By Country (2021-2032)
Figure 9. Mexico Nodoame Revenue (USD Million) By Country (2021-2032)
Figure 10. Europe Nodoame Revenue (USD Million) By Country (2021-2032)
Figure 11. Germany Nodoame Revenue (USD Million) By Country (2021-2032)
Figure 12. France Nodoame Revenue (USD Million) By Country (2021-2032)
Figure 13. United Kingdom Nodoame Revenue (USD Million) By Country (2021-2032)
Figure 14. Spain Nodoame Revenue (USD Million) By Country (2021-2032)
Figure 15. Italy Nodoame Revenue (USD Million) By Country (2021-2032)
Figure 16. Russia Nodoame Revenue (USD Million) By Country (2021-2032)
Figure 17. Rest of Europe Nodoame Revenue (USD Million) By Country (2021-2032)
Figure 11. Asia Pacific Nodoame Revenue (USD Million) By Country (2021-2032)
Figure 12. China Nodoame Revenue (USD Million) By Country (2021-2032)
Figure 13. Japan Nodoame Revenue (USD Million) By Country (2021-2032)
Figure 14. India Nodoame Revenue (USD Million) By Country (2021-2032)
Figure 15. South Korea Nodoame Revenue (USD Million) By Country (2021-2032)
Figure 16. Australia Nodoame Revenue (USD Million) By Country (2021-2032)
Figure 17. South East Asia Nodoame Revenue (USD Million) By Country (2021-2032)
Figure 18. South America Nodoame Revenue (USD Million) By Country (2021-2032)
Figure 19. Brazil Nodoame Revenue (USD Million) By Country (2021-2032)
Figure 20. Argentina Nodoame Revenue (USD Million) By Country (2021-2032)
Figure 21. Rest of Asia Pacific Nodoame Revenue (USD Million) By Country (2021-2032)
Figure 22. Middle East and Africa Nodoame Revenue (USD Million) By Region (2021-2032)
Figure 23. Saudi Arabia Nodoame Revenue (USD Million) By Region (2021-2032)
Figure 24. The UAE Nodoame Revenue (USD Million) By Region (2021-2032)
Figure 25. Rest of Middle East Nodoame Revenue (USD Million) By Region (2021-2032)
Figure 26. South Africa Nodoame Revenue (USD Million) By Region (2021-2032)
Figure 27. Africa Nodoame Revenue (USD Million) By Region (2021-2032)
Figure 28. North America Nodoame Revenue (USD Million) By Type (2021-2032)
Figure 29. North America Nodoame Revenue (USD Million) By Application (2021-2032)
Figure 30. North America Nodoame Revenue (USD Million) By Product (2021-2032)
Figure 31. Europe Nodoame Revenue (USD Million) By Type (2021-2032)
Figure 32. Europe Nodoame Revenue (USD Million) By Application (2021-2032)
Figure 33. Europe Nodoame Revenue (USD Million) By Product (2021-2032)
Figure 34. Asia Pacific Nodoame Revenue (USD Million) By Type (2021-2032)
Figure 35. Asia Pacific Nodoame Revenue (USD Million) By Application (2021-2032)
Figure 36. Asia Pacific Nodoame Revenue (USD Million) By Product (2021-2032)
Figure 37. South America Nodoame Revenue (USD Million) By Type (2021-2032)
Figure 38. South America Nodoame Revenue (USD Million) By Application (2021-2032)
Figure 39. South America Nodoame Revenue (USD Million) By Product (2021-2032)
Figure 40. Middle East and Africa Nodoame Revenue (USD Million) By Type (2021-2032)
Figure 41. Middle East and Africa Nodoame Revenue (USD Million) By Application (2021-2032)
Figure 42. Middle East and Africa Nodoame Revenue (USD Million) By Product (2021-2032)
By Type
Medicinal
Food
By Application
Supermarkets
Drugstores
Others
Countries Analyzed
North America (US, Canada, Mexico)
Europe (Germany, UK, France, Spain, Italy, Russia, Rest of Europe)
Asia Pacific (China, India, Japan, South Korea, Australia, South East Asia, Rest of Asia)
South America (Brazil, Argentina, Rest of South America)
Middle East and Africa (Saudi Arabia, UAE, Rest of Middle East, South Africa, Egypt, Rest of Africa)
