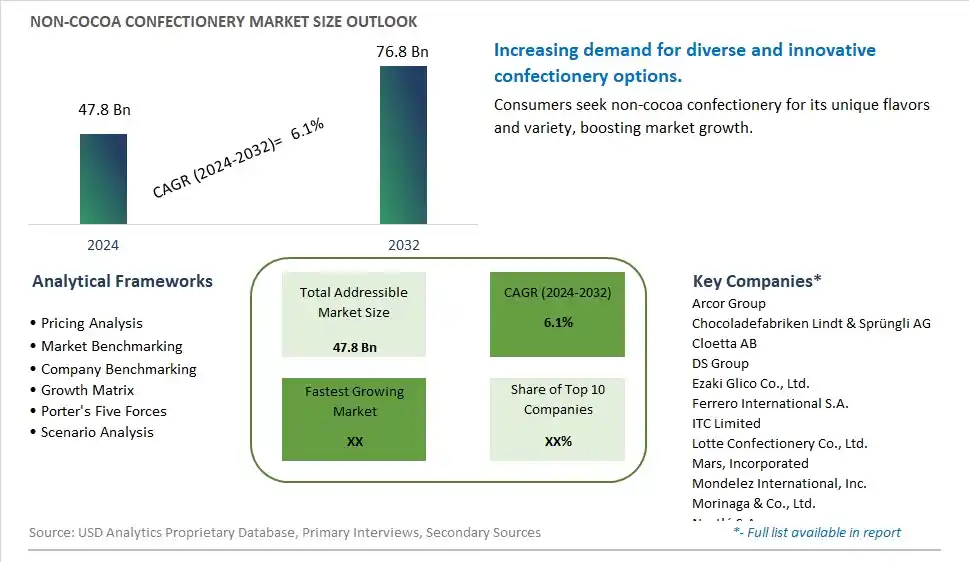
Global Non-Cocoa Confectionery Market Size is valued at $47.8 Billion in 2024 and is forecast to register a growth rate (CAGR) of 6.1% to reach $76.8 Billion by 2032.
The global Non-Cocoa Confectionery Market Comprehensive Study analyzes and forecasts the market size across 6 regions and 24 countries for diverse segments -By Type (Sugar Confectionery, Gum Confectionery), By Application (Sweetening agents, Dessert, Others)
An Introduction to Non-Cocoa Confectionery Market
The Non-Cocoa Confectionery Market focuses on the production and sale of confectionery products formulated without cocoa, catering to consumers seeking alternatives to traditional chocolate candies. These products include fruit candies, licorice, and gummies. The market is driven by increasing demand for innovative and flavorful confectionery products, rising popularity of non-chocolate candies, and growing consumer preference for natural and fruit-flavored snacks. Additionally, innovations in confectionery formulations and packaging designs support market growth.
Non Cocoa Confectionery Competitive Landscape
The market report analyses the leading companies in the industry including Arcor Group, Chocoladefabriken Lindt & Sprüngli AG, Cloetta AB, DS Group, Ezaki Glico Co., Ltd., Ferrero International S.A., ITC Limited, Lotte Confectionery Co., Ltd., Mars, Incorporated, Mondelez International, Inc., Morinaga & Co., Ltd., Nestlé S.A., Orion Corporation, The Hershey Company, and Others.
Non Cocoa Confectionery Market Dynamics
Non-Cocoa Confectionery Market Trend: Increasing Popularity of Alternative Confectioneries
The most prominent trend in the Non-Cocoa Confectionery Market is the increasing popularity of alternative confectioneries. Consumers are seeking sweets and treats that do not contain cocoa, driven by the desire for unique flavors and the need to accommodate dietary restrictions such as cocoa allergies. This trend is fueled by the growing interest in diverse and innovative confectionery options that go beyond traditional chocolate products.
Non-Cocoa Confectionery Market Driver: Health Consciousness and Dietary Preferences
A key driver in the Non-Cocoa Confectionery Market is health consciousness and changing dietary preferences. As more individuals focus on reducing their consumption of certain ingredients, such as caffeine and sugar found in traditional cocoa products, there is a rising demand for non-cocoa confectioneries that offer healthier alternatives. This demand is also driven by the growing prevalence of dietary restrictions and the desire for products that cater to specific health needs.
Non-Cocoa Confectionery Market Opportunity: Innovation in Flavor and Texture
One significant opportunity in the Non-Cocoa Confectionery Market lies in innovation in flavor and texture. Companies can develop new non-cocoa confectionery products with unique and appealing flavors, such as fruit-infused, nut-based, and exotic varieties, and improve textures to ensure a satisfying eating experience. By experimenting with different ingredients and culinary techniques, manufacturers can create non-cocoa confectioneries that cater to a wide range of consumer preferences and dietary needs, capturing a larger share of the specialty confectionery market and driving overall market growth.
Non-Cocoa Confectionery Market Share Analysis- Largest Segment by Type
In the Non-Cocoa Confectionery Market, Sugar Confectionery is the largest segment. This dominance is attributed to the broad appeal and established consumer preference for sugar-based treats such as candies, lollipops, and caramels. Sugar confectionery enjoys a larger market share due to its extensive variety and higher consumption rates across all demographics. Additionally, sugar confectionery benefits from well-established manufacturing processes and distribution networks that make it widely available and affordable. The segment's extensive product range and deep-rooted presence in both traditional and modern retail environments contribute significantly to its leading position in the market.
Non-Cocoa Confectionery Market Share Analysis- Fastest Growing Segment by Application
The Sweetening Agents segment within the Non-Cocoa Confectionery Market is poised to grow the fastest over the next five years. This growth is driven by increasing consumer demand for sugar substitutes and healthier alternatives to traditional sweeteners. Sweetening agents, including various non-cocoa sweeteners, are becoming integral to the formulation of low-sugar and sugar-free products that cater to health-conscious consumers and those with dietary restrictions. The rise in obesity rates and diabetes awareness is pushing manufacturers to innovate and expand their sweetening agent offerings, leading to accelerated growth in this segment. Moreover, the versatility of sweetening agents in various food and beverage applications supports its rapid expansion.
Non Cocoa Confectionery Market Segmentation
By Type
Sugar Confectionery
Gum Confectionery
By Application
Sweetening agents
Dessert
Others
Countries Analyzed
North America (US, Canada, Mexico)
Europe (Germany, UK, France, Spain, Italy, Russia, Rest of Europe)
Asia Pacific (China, India, Japan, South Korea, Australia, South East Asia, Rest of Asia)
South America (Brazil, Argentina, Rest of South America)
Middle East and Africa (Saudi Arabia, UAE, Rest of Middle East, South Africa, Egypt, Rest of Africa)
Non Cocoa Confectionery Companies Profiled in the Study
Arcor Group
Chocoladefabriken Lindt & Sprüngli AG
Cloetta AB
DS Group
Ezaki Glico Co., Ltd.
Ferrero International S.A.
ITC Limited
Lotte Confectionery Co., Ltd.
Mars, Incorporated
Mondelez International, Inc.
Morinaga & Co., Ltd.
Nestlé S.A.
Orion Corporation
The Hershey Company
*- List Not Exhaustive
Chapter 1. TABLE OF CONTENTS
Chapter 2. Introduction to Non Cocoa Confectionery Market
2.1. Market Overview
2.2. Key Statistics and Report Highlights
2.3. Scope of the Comprehensive Study
2.3.1. Market Definition
2.3.2 Countries and Regions Covered
2.3.3 Research Objective
2.3.4 Units, Currency, and Conversions
2.3.5 Industry Value Chain
2.4. Key Market Segments
2.5. Key Companies
2.6. Study Period
Chapter 3. Strategic Analysis Review
3.1. Non Cocoa Confectionery Pricing Analysis and Forecast
3.2. Porter’s Five Forces
3.3. Market Ecosystem
3.4. SWOT Analysis
3.5. Regulatory Scenario
3.3. Effects of Inflation, Russia-Ukraine War, moderating economic growth, and other macroeconomic factors
Chapter 4. Competitive Landscape
4.1. Market Share Analysis
4.1.1. Global Non Cocoa Confectionery Market Share by Company, 2023
4.1.2. Product Offerings of Leading Non Cocoa Confectionery Companies
4.2. Market Entropy
4.2.1. New Product Launches in the Industry
4.2.2. Mergers, Acquisitions, Joint ventures, and Partnerships
4.3. Key Strategies and Best Practices
Chapter 5. Global Market Projections: Best, Reference, and Low Case Scenarios
5.1. Growth Analysis- Case Scenario Definitions
5.2. Low Growth Case Scenario Forecasts
5.3. Reference Growth Case Scenario Forecasts
5.4. High Growth Case Scenario Forecasts
Chapter 6. Market Dynamics
6.1. Non Cocoa Confectionery Market Drivers
6.2. Non Cocoa Confectionery Market Challenges
6.6. Non Cocoa Confectionery Market Opportunities
6.4. Non Cocoa Confectionery Market Trends
Chapter 7. Global Non Cocoa Confectionery Market Outlook Trends
7.1. Global Non Cocoa Confectionery Revenue (USD Million) and CAGR (%) by Type (2021-2032)
7.2. Global Non Cocoa Confectionery Revenue (USD Million) and CAGR (%) by Application (2021-2032)
7.3. Global Non Cocoa Confectionery Revenue (USD Million) and CAGR (%) by Product (2021-2032)
By Type
Sugar Confectionery
Gum Confectionery
By Application
Sweetening agents
Dessert
Others
Chapter 8. Global Non Cocoa Confectionery Regional Analysis and Outlook
8.1. Global Non Cocoa Confectionery Revenue (USD Million) By Regions (2021- 2032)
8.2. North America Non Cocoa Confectionery Revenue (USD Million) by Country (2021-2032)
8.2.1. United States Non Cocoa Confectionery Regional Analysis and Outlook
8.2.2. Canada Non Cocoa Confectionery Regional Analysis and Outlook
8.2.3. Mexico Non Cocoa Confectionery Regional Analysis and Outlook
8.3. Europe Non Cocoa Confectionery Revenue (USD Million), by Country (2021-2032)
8.3.1. Germany Non Cocoa Confectionery Regional Analysis and Outlook
8.3.2. France Non Cocoa Confectionery Regional Analysis and Outlook
8.3.3. United Kingdom Non Cocoa Confectionery Regional Analysis and Outlook
8.3.4. Spain Non Cocoa Confectionery Regional Analysis and Outlook
8.3.5. Italy Non Cocoa Confectionery Regional Analysis and Outlook
8.3.6. Russia Non Cocoa Confectionery Regional Analysis and Outlook
8.3.7. Rest of Europe Non Cocoa Confectionery Regional Analysis and Outlook
8.4. Asia Pacific Non Cocoa Confectionery Revenue (USD Million) by Country (2021-2032)
8.4.1. China Non Cocoa Confectionery Regional Analysis and Outlook
8.4.2. Japan Non Cocoa Confectionery Regional Analysis and Outlook
8.4.3. India Non Cocoa Confectionery Regional Analysis and Outlook
8.4.4. South Korea Non Cocoa Confectionery Regional Analysis and Outlook
8.4.5. Australia Non Cocoa Confectionery Regional Analysis and Outlook
8.4.6. South East Asia Non Cocoa Confectionery Regional Analysis and Outlook
8.4.7. Rest of Asia Pacific Non Cocoa Confectionery Regional Analysis and Outlook
8.5. South America Non Cocoa Confectionery Revenue (USD Million), by Country (2021-2032)
8.5.1. Brazil Non Cocoa Confectionery Regional Analysis and Outlook
8.5.2. Argentina Non Cocoa Confectionery Regional Analysis and Outlook
8.5.3. Rest of South America Non Cocoa Confectionery Regional Analysis and Outlook
8.6. Middle East and Africa Non Cocoa Confectionery Revenue (USD Million) by Country (2021-2032)
8.6.1. Middle East Non Cocoa Confectionery Regional Analysis and Outlook
8.6.2. Africa Non Cocoa Confectionery Regional Analysis and Outlook
Chapter 9. North America Non Cocoa Confectionery Analysis and Outlook
9.1. North America Non Cocoa Confectionery Revenue (USD Million) by Segments (2021-2032)
9.1.1. North America Non Cocoa Confectionery Revenue (USD Million) by Type (2021-2032)
9.1.2. North America Non Cocoa Confectionery Revenue (USD Million) by Application (2021-2032)
9.1.3. North America Non Cocoa Confectionery Revenue (USD Million) by Product (2021-2032)
By Type
Sugar Confectionery
Gum Confectionery
By Application
Sweetening agents
Dessert
Others
Chapter 10. Europe Non Cocoa Confectionery Analysis and Outlook
10.1. Europe Non Cocoa Confectionery Revenue (USD Million), by Segments (USD Million) (2021-2032)
10.1.1. Europe Non Cocoa Confectionery Revenue (USD Million) by Type (2021-2032)
10.1.2. Europe Non Cocoa Confectionery Revenue (USD Million) by Application (2021-2032)
10.1.3. Europe Non Cocoa Confectionery Revenue (USD Million) by Product (2021-2032)
By Type
Sugar Confectionery
Gum Confectionery
By Application
Sweetening agents
Dessert
Others
Chapter 11. Asia Pacific Non Cocoa Confectionery Analysis and Outlook
11.1. Asia Pacific Non Cocoa Confectionery Revenue (USD Million), and Revenue (USD Million) by Segments (2021-2032)
11.1.1. Asia Pacific Non Cocoa Confectionery Revenue (USD Million) by Type (2021-2032)
11.1.2. Asia Pacific Non Cocoa Confectionery Revenue (USD Million) by Application (2021-2032)
11.1.3. Asia Pacific Non Cocoa Confectionery Revenue (USD Million) by Product (2021-2032)
By Type
Sugar Confectionery
Gum Confectionery
By Application
Sweetening agents
Dessert
Others
Chapter 12. South America Non Cocoa Confectionery Analysis and Outlook
12.1. South America Non Cocoa Confectionery Revenue (USD Million), by Segments (2021-2032)
12.1.1. South America Non Cocoa Confectionery Revenue (USD Million) by Type (2021-2032)
12.1.2. South America Non Cocoa Confectionery Revenue (USD Million) by Application (2021-2032)
12.1.3. South America Non Cocoa Confectionery Revenue (USD Million) by Product (2021-2032)
By Type
Sugar Confectionery
Gum Confectionery
By Application
Sweetening agents
Dessert
Others
Chapter 13. Middle East and Africa Non Cocoa Confectionery Analysis and Outlook
13.1. Middle East and Africa Non Cocoa Confectionery Revenue (USD Million), by Segments (2021-2032)
13.1.1. Middle East and Africa Non Cocoa Confectionery Revenue (USD Million) by Type (2021-2032)
13.1.2. Middle East and Africa Non Cocoa Confectionery Revenue (USD Million) by Application (2021-2032)
13.1.3. Middle East and Africa Non Cocoa Confectionery Revenue (USD Million) by Product (2021-2032)
By Type
Sugar Confectionery
Gum Confectionery
By Application
Sweetening agents
Dessert
Others
Chapter 14. Non Cocoa Confectionery Company Profiles
14.1 Business Overview
14.2 Product Profiles
14.3 SWOT Profiles
14.5 Recent Developments
14.6 Financial Profile
List of Companies
Arcor Group
Chocoladefabriken Lindt & Sprüngli AG
Cloetta AB
DS Group
Ezaki Glico Co., Ltd.
Ferrero International S.A.
ITC Limited
Lotte Confectionery Co., Ltd.
Mars, Incorporated
Mondelez International, Inc.
Morinaga & Co., Ltd.
Nestlé S.A.
Orion Corporation
The Hershey Company
15. Methodology and Data Sources
15.1 Customization Offerings
15.2 Subscription Services
15.3 Related Reports
15.4 Publisher Expertise
LIST OF TABLES
Table 1 Market Segmentation Analysis
Table 2 Global Non Cocoa Confectionery Market Share of Leading Companies, 2023
Table 3 Product Offerings of Leading Companies
Table 4 Low Growth Scenario Forecasts
Table 5 Reference Case Growth Scenario
Table 6 High Growth Case Scenario
Table 7 Global Non Cocoa Confectionery Revenue (USD Million) And CAGR (%) By Type (2021-2032)
Table 8 Global Non Cocoa Confectionery Revenue (USD Million) And CAGR (%) By Application (2021-2032)
Table 9 Global Non Cocoa Confectionery Revenue (USD Million) And CAGR (%) By Product (2021-2032)
Table 10 Global Non Cocoa Confectionery Market Revenue (USD Million) By Regions (2021-2032)
Table 11 Global Non Cocoa Confectionery Market Share (%) By Regions (2021-2032)
Table 12 North America Non Cocoa Confectionery Revenue (USD Million) By Country (2021-2032)
Table 13 Europe Non Cocoa Confectionery Revenue (USD Million) By Country (2021-2032)
Table 14 Asia Pacific Non Cocoa Confectionery Revenue (USD Million) By Country (2021-2032)
Table 15 South America Non Cocoa Confectionery Revenue (USD Million) By Country (2021-2032)
Table 16 Middle East and Africa Non Cocoa Confectionery Revenue (USD Million) By Region (2021-2032)
Table 17 North America Non Cocoa Confectionery Revenue (USD Million) By Type (2021-2032)
Table 18 North America Non Cocoa Confectionery Revenue (USD Million) By Application (2021-2032)
Table 19 North America Non Cocoa Confectionery Revenue (USD Million) By Product (2021-2032)
Table 20 Europe Non Cocoa Confectionery Revenue (USD Million) By Type (2021-2032)
Table 21 Europe Non Cocoa Confectionery Revenue (USD Million) By Application (2021-2032)
Table 22 Europe Non Cocoa Confectionery Revenue (USD Million) By Product (2021-2032)
Table 23 Asia Pacific Non Cocoa Confectionery Revenue (USD Million) By Type (2021-2032)
Table 24 Asia Pacific Non Cocoa Confectionery Revenue (USD Million) By Application (2021-2032)
Table 25 Asia Pacific Non Cocoa Confectionery Revenue (USD Million) By Product (2021-2032)
Table 26 South America Non Cocoa Confectionery Revenue (USD Million) By Type (2021-2032)
Table 27 South America Non Cocoa Confectionery Revenue (USD Million) By Application (2021-2032)
Table 28 South America Non Cocoa Confectionery Revenue (USD Million) By Product (2021-2032)
Table 29 Middle East and Africa Non Cocoa Confectionery Revenue (USD Million) By Type (2021-2032)
Table 30 Middle East and Africa Non Cocoa Confectionery Revenue (USD Million) By Application (2021-2032)
Table 31 Middle East and Africa Non Cocoa Confectionery Revenue (USD Million) By Product (2021-2032)
LIST OF FIGURES
Figure 1. Market Scope
Figure 2. Pricing Forecasts Per Unit, 2023- 2032
Figure 3. Porter’s Five Forces
Figure 4. Global Non Cocoa Confectionery Market Revenue (USD Million) By Regions (2021-2032)
Figure 5. Global Non Cocoa Confectionery Market Share (%) By Regions (2023)
Figure 6. North America Non Cocoa Confectionery Revenue (USD Million) By Country (2021-2032)
Figure 7. United States Non Cocoa Confectionery Revenue (USD Million) By Country (2021-2032)
Figure 8. Canada Non Cocoa Confectionery Revenue (USD Million) By Country (2021-2032)
Figure 9. Mexico Non Cocoa Confectionery Revenue (USD Million) By Country (2021-2032)
Figure 10. Europe Non Cocoa Confectionery Revenue (USD Million) By Country (2021-2032)
Figure 11. Germany Non Cocoa Confectionery Revenue (USD Million) By Country (2021-2032)
Figure 12. France Non Cocoa Confectionery Revenue (USD Million) By Country (2021-2032)
Figure 13. United Kingdom Non Cocoa Confectionery Revenue (USD Million) By Country (2021-2032)
Figure 14. Spain Non Cocoa Confectionery Revenue (USD Million) By Country (2021-2032)
Figure 15. Italy Non Cocoa Confectionery Revenue (USD Million) By Country (2021-2032)
Figure 16. Russia Non Cocoa Confectionery Revenue (USD Million) By Country (2021-2032)
Figure 17. Rest of Europe Non Cocoa Confectionery Revenue (USD Million) By Country (2021-2032)
Figure 11. Asia Pacific Non Cocoa Confectionery Revenue (USD Million) By Country (2021-2032)
Figure 12. China Non Cocoa Confectionery Revenue (USD Million) By Country (2021-2032)
Figure 13. Japan Non Cocoa Confectionery Revenue (USD Million) By Country (2021-2032)
Figure 14. India Non Cocoa Confectionery Revenue (USD Million) By Country (2021-2032)
Figure 15. South Korea Non Cocoa Confectionery Revenue (USD Million) By Country (2021-2032)
Figure 16. Australia Non Cocoa Confectionery Revenue (USD Million) By Country (2021-2032)
Figure 17. South East Asia Non Cocoa Confectionery Revenue (USD Million) By Country (2021-2032)
Figure 18. South America Non Cocoa Confectionery Revenue (USD Million) By Country (2021-2032)
Figure 19. Brazil Non Cocoa Confectionery Revenue (USD Million) By Country (2021-2032)
Figure 20. Argentina Non Cocoa Confectionery Revenue (USD Million) By Country (2021-2032)
Figure 21. Rest of Asia Pacific Non Cocoa Confectionery Revenue (USD Million) By Country (2021-2032)
Figure 22. Middle East and Africa Non Cocoa Confectionery Revenue (USD Million) By Region (2021-2032)
Figure 23. Saudi Arabia Non Cocoa Confectionery Revenue (USD Million) By Region (2021-2032)
Figure 24. The UAE Non Cocoa Confectionery Revenue (USD Million) By Region (2021-2032)
Figure 25. Rest of Middle East Non Cocoa Confectionery Revenue (USD Million) By Region (2021-2032)
Figure 26. South Africa Non Cocoa Confectionery Revenue (USD Million) By Region (2021-2032)
Figure 27. Africa Non Cocoa Confectionery Revenue (USD Million) By Region (2021-2032)
Figure 28. North America Non Cocoa Confectionery Revenue (USD Million) By Type (2021-2032)
Figure 29. North America Non Cocoa Confectionery Revenue (USD Million) By Application (2021-2032)
Figure 30. North America Non Cocoa Confectionery Revenue (USD Million) By Product (2021-2032)
Figure 31. Europe Non Cocoa Confectionery Revenue (USD Million) By Type (2021-2032)
Figure 32. Europe Non Cocoa Confectionery Revenue (USD Million) By Application (2021-2032)
Figure 33. Europe Non Cocoa Confectionery Revenue (USD Million) By Product (2021-2032)
Figure 34. Asia Pacific Non Cocoa Confectionery Revenue (USD Million) By Type (2021-2032)
Figure 35. Asia Pacific Non Cocoa Confectionery Revenue (USD Million) By Application (2021-2032)
Figure 36. Asia Pacific Non Cocoa Confectionery Revenue (USD Million) By Product (2021-2032)
Figure 37. South America Non Cocoa Confectionery Revenue (USD Million) By Type (2021-2032)
Figure 38. South America Non Cocoa Confectionery Revenue (USD Million) By Application (2021-2032)
Figure 39. South America Non Cocoa Confectionery Revenue (USD Million) By Product (2021-2032)
Figure 40. Middle East and Africa Non Cocoa Confectionery Revenue (USD Million) By Type (2021-2032)
Figure 41. Middle East and Africa Non Cocoa Confectionery Revenue (USD Million) By Application (2021-2032)
Figure 42. Middle East and Africa Non Cocoa Confectionery Revenue (USD Million) By Product (2021-2032)
By Type
Sugar Confectionery
Gum Confectionery
By Application
Sweetening agents
Dessert
Others
Countries Analyzed
North America (US, Canada, Mexico)
Europe (Germany, UK, France, Spain, Italy, Russia, Rest of Europe)
Asia Pacific (China, India, Japan, South Korea, Australia, South East Asia, Rest of Asia)
South America (Brazil, Argentina, Rest of South America)
Middle East and Africa (Saudi Arabia, UAE, Rest of Middle East, South Africa, Egypt, Rest of Africa)
