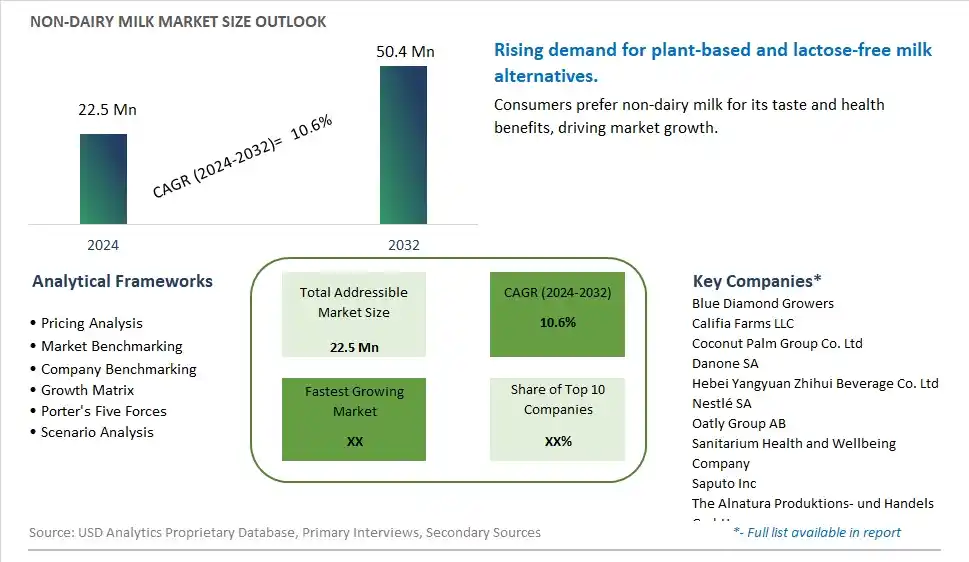
Global Non-dairy Milk Market Size is valued at $22.5 Million in 2024 and is forecast to register a growth rate (CAGR) of 10.6% to reach $50.4 Million by 2032.
The global Non-dairy Milk Market Comprehensive Study analyzes and forecasts the market size across 6 regions and 24 countries for diverse segments -By Product (Almond Milk, Cashew Milk, Coconut Milk, Hazelnut Milk, Hemp Milk, Oat Milk, Soy Milk), By Distribution Channel (Off-Trade, On-Trade)
An Introduction to Non-dairy Milk Market
The Non-Dairy Milk Market focuses on the production and sale of milk alternatives made from plant-based ingredients such as almonds, soy, oats, and coconut. These products cater to consumers seeking vegan, lactose-free, and dairy-free options. The market is driven by increasing prevalence of lactose intolerance and dairy allergies, rising popularity of vegan and plant-based diets, and growing awareness about the environmental impact of dairy production. Additionally, innovations in non-dairy milk formulations and the expansion of product offerings support market growth.
Non dairy Milk Competitive Landscape
The market report analyses the leading companies in the industry including Blue Diamond Growers, Califia Farms LLC, Coconut Palm Group Co. Ltd, Danone SA, Hebei Yangyuan Zhihui Beverage Co. Ltd, Nestlé SA, Oatly Group AB, Sanitarium Health and Wellbeing Company, Saputo Inc, The Alnatura Produktions- und Handels GmbH, The Hain Celestial Group Inc, Vitasoy International Holdings Ltd, and Others.
Non dairy Milk Market Dynamics
Non-Dairy Milk Market Trend: Growing Popularity of Plant-Based Milks
The most prominent trend in the Non-Dairy Milk Market is the growing popularity of plant-based milks. Non-dairy milks, made from ingredients such as almond, soy, oat, and coconut, are becoming a preferred choice among consumers seeking alternatives to cow's milk. This trend is driven by the increasing awareness of the health benefits of plant-based diets and the desire for sustainable and ethical food choices.
Non-Dairy Milk Market Driver: Health Consciousness and Lactose Intolerance
A key driver in the Non-Dairy Milk Market is health consciousness and lactose intolerance. As more individuals focus on improving their diet and avoiding dairy products, there is a rising demand for non-dairy milks that provide a healthy and convenient alternative to cow's milk. This demand is further fueled by the growing prevalence of lactose intolerance and dairy allergies.
Non-Dairy Milk Market Opportunity: Innovation in Flavor and Nutritional Enhancements
One significant opportunity in the Non-Dairy Milk Market lies in innovation in flavor and nutritional enhancements. Companies can develop new non-dairy milk products with unique and appealing flavors, such as chocolate, vanilla, and fruit-infused varieties, and incorporate additional nutrients like vitamins, minerals, and protein. By offering diverse and health-focused options, manufacturers can attract a broader consumer base and drive market growth.
Non-Dairy Milk Market Share Analysis- Largest Segment by Product
In the Non-Dairy Milk Market, Soy Milk is the largest segment. Soy milk has established itself as the dominant non-dairy alternative due to its long history in the market, extensive consumer acceptance, and nutritional profile. It offers a comparable protein content to cow’s milk, which appeals to those seeking plant-based protein sources. Additionally, soy milk's versatility in various culinary applications, from smoothies to cooking, contributes to its widespread use. Its availability in multiple formulations and flavors further solidifies its position as the leading non-dairy milk product. The extensive distribution network and long-standing presence in both mainstream and specialty stores reinforce its market leadership.
Non-Dairy Milk Market Share Analysis- Fastest Growing Segment by Distribution Channel
Within the Non-Dairy Milk Market, the On-Trade distribution channel is expected to grow the fastest over the next five years. This growth is fueled by the increasing number of foodservice establishments, including cafés, restaurants, and health-focused eateries, that are expanding their non-dairy milk offerings to meet consumer demand. As consumers become more health-conscious and seek out plant-based options when dining out, the foodservice sector is rapidly incorporating non-dairy milk into their menus. Additionally, the trend of customizing beverages and meals with non-dairy milk in restaurants and coffee shops drives higher on-trade consumption. This segment’s growth is further supported by the rising popularity of plant-based diets and the growing number of specialty food and beverage outlets catering to these preferences.
Non dairy Milk Market Segmentation
By Product
Almond Milk
Cashew Milk
Coconut Milk
Hazelnut Milk
Hemp Milk
Oat Milk
Soy Milk
By Distribution Channel
Off-Trade
On-Trade
Countries Analyzed
North America (US, Canada, Mexico)
Europe (Germany, UK, France, Spain, Italy, Russia, Rest of Europe)
Asia Pacific (China, India, Japan, South Korea, Australia, South East Asia, Rest of Asia)
South America (Brazil, Argentina, Rest of South America)
Middle East and Africa (Saudi Arabia, UAE, Rest of Middle East, South Africa, Egypt, Rest of Africa)
Non dairy Milk Companies Profiled in the Study
Blue Diamond Growers
Califia Farms LLC
Coconut Palm Group Co. Ltd
Danone SA
Hebei Yangyuan Zhihui Beverage Co. Ltd
Nestlé SA
Oatly Group AB
Sanitarium Health and Wellbeing Company
Saputo Inc
The Alnatura Produktions- und Handels GmbH
The Hain Celestial Group Inc
Vitasoy International Holdings Ltd
*- List Not Exhaustive
Chapter 1. TABLE OF CONTENTS
Chapter 2. Introduction to Non dairy Milk Market
2.1. Market Overview
2.2. Key Statistics and Report Highlights
2.3. Scope of the Comprehensive Study
2.3.1. Market Definition
2.3.2 Countries and Regions Covered
2.3.3 Research Objective
2.3.4 Units, Currency, and Conversions
2.3.5 Industry Value Chain
2.4. Key Market Segments
2.5. Key Companies
2.6. Study Period
Chapter 3. Strategic Analysis Review
3.1. Non dairy Milk Pricing Analysis and Forecast
3.2. Porter’s Five Forces
3.3. Market Ecosystem
3.4. SWOT Analysis
3.5. Regulatory Scenario
3.3. Effects of Inflation, Russia-Ukraine War, moderating economic growth, and other macroeconomic factors
Chapter 4. Competitive Landscape
4.1. Market Share Analysis
4.1.1. Global Non dairy Milk Market Share by Company, 2023
4.1.2. Product Offerings of Leading Non dairy Milk Companies
4.2. Market Entropy
4.2.1. New Product Launches in the Industry
4.2.2. Mergers, Acquisitions, Joint ventures, and Partnerships
4.3. Key Strategies and Best Practices
Chapter 5. Global Market Projections: Best, Reference, and Low Case Scenarios
5.1. Growth Analysis- Case Scenario Definitions
5.2. Low Growth Case Scenario Forecasts
5.3. Reference Growth Case Scenario Forecasts
5.4. High Growth Case Scenario Forecasts
Chapter 6. Market Dynamics
6.1. Non dairy Milk Market Drivers
6.2. Non dairy Milk Market Challenges
6.6. Non dairy Milk Market Opportunities
6.4. Non dairy Milk Market Trends
Chapter 7. Global Non dairy Milk Market Outlook Trends
7.1. Global Non dairy Milk Revenue (USD Million) and CAGR (%) by Type (2021-2032)
7.2. Global Non dairy Milk Revenue (USD Million) and CAGR (%) by Application (2021-2032)
7.3. Global Non dairy Milk Revenue (USD Million) and CAGR (%) by Product (2021-2032)
By Product
Almond Milk
Cashew Milk
Coconut Milk
Hazelnut Milk
Hemp Milk
Oat Milk
Soy Milk
By Distribution Channel
Off-Trade
On-Trade
Chapter 8. Global Non dairy Milk Regional Analysis and Outlook
8.1. Global Non dairy Milk Revenue (USD Million) By Regions (2021- 2032)
8.2. North America Non dairy Milk Revenue (USD Million) by Country (2021-2032)
8.2.1. United States Non dairy Milk Regional Analysis and Outlook
8.2.2. Canada Non dairy Milk Regional Analysis and Outlook
8.2.3. Mexico Non dairy Milk Regional Analysis and Outlook
8.3. Europe Non dairy Milk Revenue (USD Million), by Country (2021-2032)
8.3.1. Germany Non dairy Milk Regional Analysis and Outlook
8.3.2. France Non dairy Milk Regional Analysis and Outlook
8.3.3. United Kingdom Non dairy Milk Regional Analysis and Outlook
8.3.4. Spain Non dairy Milk Regional Analysis and Outlook
8.3.5. Italy Non dairy Milk Regional Analysis and Outlook
8.3.6. Russia Non dairy Milk Regional Analysis and Outlook
8.3.7. Rest of Europe Non dairy Milk Regional Analysis and Outlook
8.4. Asia Pacific Non dairy Milk Revenue (USD Million) by Country (2021-2032)
8.4.1. China Non dairy Milk Regional Analysis and Outlook
8.4.2. Japan Non dairy Milk Regional Analysis and Outlook
8.4.3. India Non dairy Milk Regional Analysis and Outlook
8.4.4. South Korea Non dairy Milk Regional Analysis and Outlook
8.4.5. Australia Non dairy Milk Regional Analysis and Outlook
8.4.6. South East Asia Non dairy Milk Regional Analysis and Outlook
8.4.7. Rest of Asia Pacific Non dairy Milk Regional Analysis and Outlook
8.5. South America Non dairy Milk Revenue (USD Million), by Country (2021-2032)
8.5.1. Brazil Non dairy Milk Regional Analysis and Outlook
8.5.2. Argentina Non dairy Milk Regional Analysis and Outlook
8.5.3. Rest of South America Non dairy Milk Regional Analysis and Outlook
8.6. Middle East and Africa Non dairy Milk Revenue (USD Million) by Country (2021-2032)
8.6.1. Middle East Non dairy Milk Regional Analysis and Outlook
8.6.2. Africa Non dairy Milk Regional Analysis and Outlook
Chapter 9. North America Non dairy Milk Analysis and Outlook
9.1. North America Non dairy Milk Revenue (USD Million) by Segments (2021-2032)
9.1.1. North America Non dairy Milk Revenue (USD Million) by Type (2021-2032)
9.1.2. North America Non dairy Milk Revenue (USD Million) by Application (2021-2032)
9.1.3. North America Non dairy Milk Revenue (USD Million) by Product (2021-2032)
By Product
Almond Milk
Cashew Milk
Coconut Milk
Hazelnut Milk
Hemp Milk
Oat Milk
Soy Milk
By Distribution Channel
Off-Trade
On-Trade
Chapter 10. Europe Non dairy Milk Analysis and Outlook
10.1. Europe Non dairy Milk Revenue (USD Million), by Segments (USD Million) (2021-2032)
10.1.1. Europe Non dairy Milk Revenue (USD Million) by Type (2021-2032)
10.1.2. Europe Non dairy Milk Revenue (USD Million) by Application (2021-2032)
10.1.3. Europe Non dairy Milk Revenue (USD Million) by Product (2021-2032)
By Product
Almond Milk
Cashew Milk
Coconut Milk
Hazelnut Milk
Hemp Milk
Oat Milk
Soy Milk
By Distribution Channel
Off-Trade
On-Trade
Chapter 11. Asia Pacific Non dairy Milk Analysis and Outlook
11.1. Asia Pacific Non dairy Milk Revenue (USD Million), and Revenue (USD Million) by Segments (2021-2032)
11.1.1. Asia Pacific Non dairy Milk Revenue (USD Million) by Type (2021-2032)
11.1.2. Asia Pacific Non dairy Milk Revenue (USD Million) by Application (2021-2032)
11.1.3. Asia Pacific Non dairy Milk Revenue (USD Million) by Product (2021-2032)
By Product
Almond Milk
Cashew Milk
Coconut Milk
Hazelnut Milk
Hemp Milk
Oat Milk
Soy Milk
By Distribution Channel
Off-Trade
On-Trade
Chapter 12. South America Non dairy Milk Analysis and Outlook
12.1. South America Non dairy Milk Revenue (USD Million), by Segments (2021-2032)
12.1.1. South America Non dairy Milk Revenue (USD Million) by Type (2021-2032)
12.1.2. South America Non dairy Milk Revenue (USD Million) by Application (2021-2032)
12.1.3. South America Non dairy Milk Revenue (USD Million) by Product (2021-2032)
By Product
Almond Milk
Cashew Milk
Coconut Milk
Hazelnut Milk
Hemp Milk
Oat Milk
Soy Milk
By Distribution Channel
Off-Trade
On-Trade
Chapter 13. Middle East and Africa Non dairy Milk Analysis and Outlook
13.1. Middle East and Africa Non dairy Milk Revenue (USD Million), by Segments (2021-2032)
13.1.1. Middle East and Africa Non dairy Milk Revenue (USD Million) by Type (2021-2032)
13.1.2. Middle East and Africa Non dairy Milk Revenue (USD Million) by Application (2021-2032)
13.1.3. Middle East and Africa Non dairy Milk Revenue (USD Million) by Product (2021-2032)
By Product
Almond Milk
Cashew Milk
Coconut Milk
Hazelnut Milk
Hemp Milk
Oat Milk
Soy Milk
By Distribution Channel
Off-Trade
On-Trade
Chapter 14. Non dairy Milk Company Profiles
14.1 Business Overview
14.2 Product Profiles
14.3 SWOT Profiles
14.5 Recent Developments
14.6 Financial Profile
List of Companies
Blue Diamond Growers
Califia Farms LLC
Coconut Palm Group Co. Ltd
Danone SA
Hebei Yangyuan Zhihui Beverage Co. Ltd
Nestlé SA
Oatly Group AB
Sanitarium Health and Wellbeing Company
Saputo Inc
The Alnatura Produktions- und Handels GmbH
The Hain Celestial Group Inc
Vitasoy International Holdings Ltd
15. Methodology and Data Sources
15.1 Customization Offerings
15.2 Subscription Services
15.3 Related Reports
15.4 Publisher Expertise
LIST OF TABLES
Table 1 Market Segmentation Analysis
Table 2 Global Non dairy Milk Market Share of Leading Companies, 2023
Table 3 Product Offerings of Leading Companies
Table 4 Low Growth Scenario Forecasts
Table 5 Reference Case Growth Scenario
Table 6 High Growth Case Scenario
Table 7 Global Non dairy Milk Revenue (USD Million) And CAGR (%) By Type (2021-2032)
Table 8 Global Non dairy Milk Revenue (USD Million) And CAGR (%) By Application (2021-2032)
Table 9 Global Non dairy Milk Revenue (USD Million) And CAGR (%) By Product (2021-2032)
Table 10 Global Non dairy Milk Market Revenue (USD Million) By Regions (2021-2032)
Table 11 Global Non dairy Milk Market Share (%) By Regions (2021-2032)
Table 12 North America Non dairy Milk Revenue (USD Million) By Country (2021-2032)
Table 13 Europe Non dairy Milk Revenue (USD Million) By Country (2021-2032)
Table 14 Asia Pacific Non dairy Milk Revenue (USD Million) By Country (2021-2032)
Table 15 South America Non dairy Milk Revenue (USD Million) By Country (2021-2032)
Table 16 Middle East and Africa Non dairy Milk Revenue (USD Million) By Region (2021-2032)
Table 17 North America Non dairy Milk Revenue (USD Million) By Type (2021-2032)
Table 18 North America Non dairy Milk Revenue (USD Million) By Application (2021-2032)
Table 19 North America Non dairy Milk Revenue (USD Million) By Product (2021-2032)
Table 20 Europe Non dairy Milk Revenue (USD Million) By Type (2021-2032)
Table 21 Europe Non dairy Milk Revenue (USD Million) By Application (2021-2032)
Table 22 Europe Non dairy Milk Revenue (USD Million) By Product (2021-2032)
Table 23 Asia Pacific Non dairy Milk Revenue (USD Million) By Type (2021-2032)
Table 24 Asia Pacific Non dairy Milk Revenue (USD Million) By Application (2021-2032)
Table 25 Asia Pacific Non dairy Milk Revenue (USD Million) By Product (2021-2032)
Table 26 South America Non dairy Milk Revenue (USD Million) By Type (2021-2032)
Table 27 South America Non dairy Milk Revenue (USD Million) By Application (2021-2032)
Table 28 South America Non dairy Milk Revenue (USD Million) By Product (2021-2032)
Table 29 Middle East and Africa Non dairy Milk Revenue (USD Million) By Type (2021-2032)
Table 30 Middle East and Africa Non dairy Milk Revenue (USD Million) By Application (2021-2032)
Table 31 Middle East and Africa Non dairy Milk Revenue (USD Million) By Product (2021-2032)
LIST OF FIGURES
Figure 1. Market Scope
Figure 2. Pricing Forecasts Per Unit, 2023- 2032
Figure 3. Porter’s Five Forces
Figure 4. Global Non dairy Milk Market Revenue (USD Million) By Regions (2021-2032)
Figure 5. Global Non dairy Milk Market Share (%) By Regions (2023)
Figure 6. North America Non dairy Milk Revenue (USD Million) By Country (2021-2032)
Figure 7. United States Non dairy Milk Revenue (USD Million) By Country (2021-2032)
Figure 8. Canada Non dairy Milk Revenue (USD Million) By Country (2021-2032)
Figure 9. Mexico Non dairy Milk Revenue (USD Million) By Country (2021-2032)
Figure 10. Europe Non dairy Milk Revenue (USD Million) By Country (2021-2032)
Figure 11. Germany Non dairy Milk Revenue (USD Million) By Country (2021-2032)
Figure 12. France Non dairy Milk Revenue (USD Million) By Country (2021-2032)
Figure 13. United Kingdom Non dairy Milk Revenue (USD Million) By Country (2021-2032)
Figure 14. Spain Non dairy Milk Revenue (USD Million) By Country (2021-2032)
Figure 15. Italy Non dairy Milk Revenue (USD Million) By Country (2021-2032)
Figure 16. Russia Non dairy Milk Revenue (USD Million) By Country (2021-2032)
Figure 17. Rest of Europe Non dairy Milk Revenue (USD Million) By Country (2021-2032)
Figure 11. Asia Pacific Non dairy Milk Revenue (USD Million) By Country (2021-2032)
Figure 12. China Non dairy Milk Revenue (USD Million) By Country (2021-2032)
Figure 13. Japan Non dairy Milk Revenue (USD Million) By Country (2021-2032)
Figure 14. India Non dairy Milk Revenue (USD Million) By Country (2021-2032)
Figure 15. South Korea Non dairy Milk Revenue (USD Million) By Country (2021-2032)
Figure 16. Australia Non dairy Milk Revenue (USD Million) By Country (2021-2032)
Figure 17. South East Asia Non dairy Milk Revenue (USD Million) By Country (2021-2032)
Figure 18. South America Non dairy Milk Revenue (USD Million) By Country (2021-2032)
Figure 19. Brazil Non dairy Milk Revenue (USD Million) By Country (2021-2032)
Figure 20. Argentina Non dairy Milk Revenue (USD Million) By Country (2021-2032)
Figure 21. Rest of Asia Pacific Non dairy Milk Revenue (USD Million) By Country (2021-2032)
Figure 22. Middle East and Africa Non dairy Milk Revenue (USD Million) By Region (2021-2032)
Figure 23. Saudi Arabia Non dairy Milk Revenue (USD Million) By Region (2021-2032)
Figure 24. The UAE Non dairy Milk Revenue (USD Million) By Region (2021-2032)
Figure 25. Rest of Middle East Non dairy Milk Revenue (USD Million) By Region (2021-2032)
Figure 26. South Africa Non dairy Milk Revenue (USD Million) By Region (2021-2032)
Figure 27. Africa Non dairy Milk Revenue (USD Million) By Region (2021-2032)
Figure 28. North America Non dairy Milk Revenue (USD Million) By Type (2021-2032)
Figure 29. North America Non dairy Milk Revenue (USD Million) By Application (2021-2032)
Figure 30. North America Non dairy Milk Revenue (USD Million) By Product (2021-2032)
Figure 31. Europe Non dairy Milk Revenue (USD Million) By Type (2021-2032)
Figure 32. Europe Non dairy Milk Revenue (USD Million) By Application (2021-2032)
Figure 33. Europe Non dairy Milk Revenue (USD Million) By Product (2021-2032)
Figure 34. Asia Pacific Non dairy Milk Revenue (USD Million) By Type (2021-2032)
Figure 35. Asia Pacific Non dairy Milk Revenue (USD Million) By Application (2021-2032)
Figure 36. Asia Pacific Non dairy Milk Revenue (USD Million) By Product (2021-2032)
Figure 37. South America Non dairy Milk Revenue (USD Million) By Type (2021-2032)
Figure 38. South America Non dairy Milk Revenue (USD Million) By Application (2021-2032)
Figure 39. South America Non dairy Milk Revenue (USD Million) By Product (2021-2032)
Figure 40. Middle East and Africa Non dairy Milk Revenue (USD Million) By Type (2021-2032)
Figure 41. Middle East and Africa Non dairy Milk Revenue (USD Million) By Application (2021-2032)
Figure 42. Middle East and Africa Non dairy Milk Revenue (USD Million) By Product (2021-2032)
By Product
Almond Milk
Cashew Milk
Coconut Milk
Hazelnut Milk
Hemp Milk
Oat Milk
Soy Milk
By Distribution Channel
Off-Trade
On-Trade
Countries Analyzed
North America (US, Canada, Mexico)
Europe (Germany, UK, France, Spain, Italy, Russia, Rest of Europe)
Asia Pacific (China, India, Japan, South Korea, Australia, South East Asia, Rest of Asia)
South America (Brazil, Argentina, Rest of South America)
Middle East and Africa (Saudi Arabia, UAE, Rest of Middle East, South Africa, Egypt, Rest of Africa)
