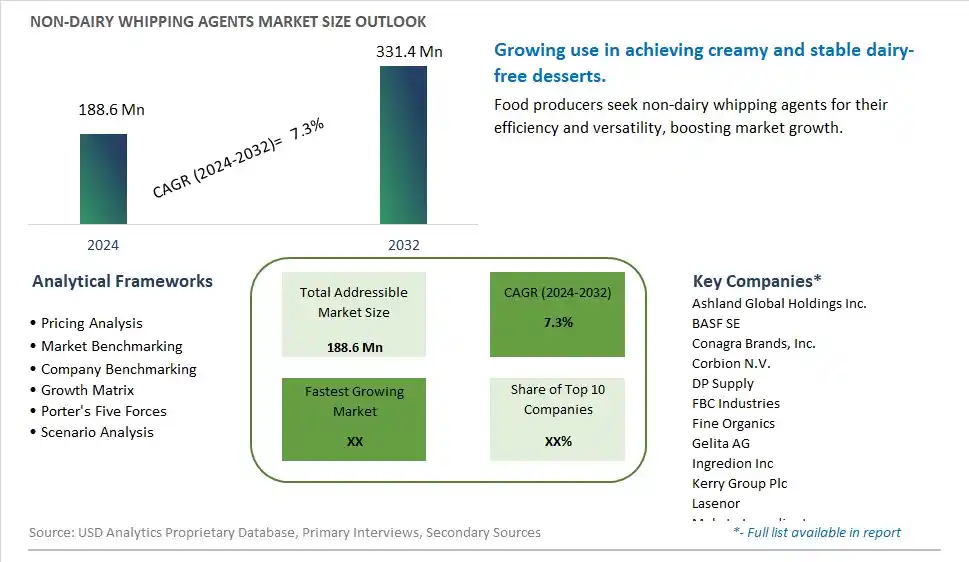
Global Non-dairy Whipping Agents Market Size is valued at $188.6 Million in 2024 and is forecast to register a growth rate (CAGR) of 7.3% to reach $331.4 Million by 2032.
The global Non-dairy Whipping Agents Market Comprehensive Study analyzes and forecasts the market size across 6 regions and 24 countries for diverse segments -By Type (Liquid Formulations, Spray Dried Powders), By Application (Confectionary, Bakery, Desserts, Others)
An Introduction to Non-dairy Whipping Agents Market
The Non-Dairy Whipping Agents Market involves the production and sale of whipping agents made from plant-based ingredients, catering to consumers seeking dairy-free and lactose-free alternatives. These agents are used in making whipped cream and other whipped toppings. The market is driven by increasing prevalence of lactose intolerance and dairy allergies, rising popularity of vegan and plant-based diets, and growing demand for convenient and high-quality dessert toppings. Additionally, advancements in whipping agent formulations and the expansion of product offerings support market growth.
Non dairy Whipping Agents Competitive Landscape
The market report analyses the leading companies in the industry including Ashland Global Holdings Inc., BASF SE, Conagra Brands, Inc., Corbion N.V., DP Supply, FBC Industries, Fine Organics, Gelita AG, Ingredion Inc, Kerry Group Plc, Lasenor, Mokate Ingredients, Molkerei MEGGLE Wasserburg, Palsgaard A/S, Real, Rich Graviss Product, Royal FrieslandCampina NV, SKM Egg Products, Wacker Chemie, and Others.
Non dairy Whipping Agents Market Dynamics
Non-Dairy Whipping Agents Market Trend: Increasing Use in Vegan and Plant-Based Desserts
The most prominent trend in the Non-Dairy Whipping Agents Market is the increasing use in vegan and plant-based desserts. Non-dairy whipping agents, made from plant-based ingredients, are gaining popularity among consumers seeking alternatives to traditional dairy-based whipping creams. This trend is driven by the rise in veganism and the desire for sustainable and ethical food choices.
Non-Dairy Whipping Agents Market Driver: Health Consciousness and Dairy Allergies
A key driver in the Non-Dairy Whipping Agents Market is health consciousness and dairy allergies. As more individuals focus on improving their diet and avoiding dairy products, there is a rising demand for non-dairy whipping agents that provide a healthy and convenient alternative to traditional whipping creams. This demand is particularly strong among consumers with dairy allergies and those following vegan diets.
Non-Dairy Whipping Agents Market Opportunity: Innovation in Formulation and Applications
One significant opportunity in the Non-Dairy Whipping Agents Market lies in innovation in formulation and applications. Companies can develop new non-dairy whipping agents with improved stability, texture, and taste, and expand their use in a variety of dessert and culinary applications, such as cakes, pastries, and mousses. By offering innovative and appealing options, manufacturers can attract a broader consumer base and drive market growth.
Non-Dairy Whipping Agents Market Share Analysis- Largest Segment by Type
The Liquid Formulations segment within the Non-Dairy Whipping Agents Market is the largest. Liquid whipping agents are preferred for their ease of use, consistency, and ability to blend seamlessly with other ingredients. They are widely used in various applications, including bakery products, desserts, and sauces, due to their superior performance in achieving the desired texture and volume. The liquid form is favored for its convenience in both commercial kitchens and home baking, where precise measurement and consistency are crucial. This widespread acceptance and versatility in usage contribute to the dominant position of liquid formulations in the market.
Non-Dairy Whipping Agents Market Share Analysis- Fastest Growing Segment by Application
The Desserts application segment is poised to grow the fastest in the Non-Dairy Whipping Agents Market. The surge in demand for plant-based and dairy-free dessert options is driving this rapid growth. As consumers increasingly seek healthier and allergen-free alternatives, non-dairy whipping agents are becoming integral to creating a wide range of vegan and lactose-free desserts. The growing popularity of desserts such as vegan cakes, mousse, and whipped toppings, along with the innovation in non-dairy formulations, supports this segment's expansion. The versatility of non-dairy whipping agents in creating desirable textures and flavors in desserts further accelerates their adoption.
Non dairy Whipping Agents Market Segmentation
By Type
Liquid Formulations
Spray Dried Powders
By Application
Confectionary
Bakery
Desserts
Others
Countries Analyzed
North America (US, Canada, Mexico)
Europe (Germany, UK, France, Spain, Italy, Russia, Rest of Europe)
Asia Pacific (China, India, Japan, South Korea, Australia, South East Asia, Rest of Asia)
South America (Brazil, Argentina, Rest of South America)
Middle East and Africa (Saudi Arabia, UAE, Rest of Middle East, South Africa, Egypt, Rest of Africa)
Non dairy Whipping Agents Companies Profiled in the Study
Ashland Global Holdings Inc.
BASF SE
Conagra Brands, Inc.
Corbion N.V.
DP Supply
FBC Industries
Fine Organics
Gelita AG
Ingredion Inc
Kerry Group Plc
Lasenor
Mokate Ingredients
Molkerei MEGGLE Wasserburg
Palsgaard A/S
Real
Rich Graviss Product
Royal FrieslandCampina NV
SKM Egg Products
Wacker Chemie
*- List Not Exhaustive
Chapter 1. TABLE OF CONTENTS
Chapter 2. Introduction to Non dairy Whipping Agents Market
2.1. Market Overview
2.2. Key Statistics and Report Highlights
2.3. Scope of the Comprehensive Study
2.3.1. Market Definition
2.3.2 Countries and Regions Covered
2.3.3 Research Objective
2.3.4 Units, Currency, and Conversions
2.3.5 Industry Value Chain
2.4. Key Market Segments
2.5. Key Companies
2.6. Study Period
Chapter 3. Strategic Analysis Review
3.1. Non dairy Whipping Agents Pricing Analysis and Forecast
3.2. Porter’s Five Forces
3.3. Market Ecosystem
3.4. SWOT Analysis
3.5. Regulatory Scenario
3.3. Effects of Inflation, Russia-Ukraine War, moderating economic growth, and other macroeconomic factors
Chapter 4. Competitive Landscape
4.1. Market Share Analysis
4.1.1. Global Non dairy Whipping Agents Market Share by Company, 2023
4.1.2. Product Offerings of Leading Non dairy Whipping Agents Companies
4.2. Market Entropy
4.2.1. New Product Launches in the Industry
4.2.2. Mergers, Acquisitions, Joint ventures, and Partnerships
4.3. Key Strategies and Best Practices
Chapter 5. Global Market Projections: Best, Reference, and Low Case Scenarios
5.1. Growth Analysis- Case Scenario Definitions
5.2. Low Growth Case Scenario Forecasts
5.3. Reference Growth Case Scenario Forecasts
5.4. High Growth Case Scenario Forecasts
Chapter 6. Market Dynamics
6.1. Non dairy Whipping Agents Market Drivers
6.2. Non dairy Whipping Agents Market Challenges
6.6. Non dairy Whipping Agents Market Opportunities
6.4. Non dairy Whipping Agents Market Trends
Chapter 7. Global Non dairy Whipping Agents Market Outlook Trends
7.1. Global Non dairy Whipping Agents Revenue (USD Million) and CAGR (%) by Type (2021-2032)
7.2. Global Non dairy Whipping Agents Revenue (USD Million) and CAGR (%) by Application (2021-2032)
7.3. Global Non dairy Whipping Agents Revenue (USD Million) and CAGR (%) by Product (2021-2032)
By Type
Liquid Formulations
Spray Dried Powders
By Application
Confectionary
Bakery
Desserts
Others
Chapter 8. Global Non dairy Whipping Agents Regional Analysis and Outlook
8.1. Global Non dairy Whipping Agents Revenue (USD Million) By Regions (2021- 2032)
8.2. North America Non dairy Whipping Agents Revenue (USD Million) by Country (2021-2032)
8.2.1. United States Non dairy Whipping Agents Regional Analysis and Outlook
8.2.2. Canada Non dairy Whipping Agents Regional Analysis and Outlook
8.2.3. Mexico Non dairy Whipping Agents Regional Analysis and Outlook
8.3. Europe Non dairy Whipping Agents Revenue (USD Million), by Country (2021-2032)
8.3.1. Germany Non dairy Whipping Agents Regional Analysis and Outlook
8.3.2. France Non dairy Whipping Agents Regional Analysis and Outlook
8.3.3. United Kingdom Non dairy Whipping Agents Regional Analysis and Outlook
8.3.4. Spain Non dairy Whipping Agents Regional Analysis and Outlook
8.3.5. Italy Non dairy Whipping Agents Regional Analysis and Outlook
8.3.6. Russia Non dairy Whipping Agents Regional Analysis and Outlook
8.3.7. Rest of Europe Non dairy Whipping Agents Regional Analysis and Outlook
8.4. Asia Pacific Non dairy Whipping Agents Revenue (USD Million) by Country (2021-2032)
8.4.1. China Non dairy Whipping Agents Regional Analysis and Outlook
8.4.2. Japan Non dairy Whipping Agents Regional Analysis and Outlook
8.4.3. India Non dairy Whipping Agents Regional Analysis and Outlook
8.4.4. South Korea Non dairy Whipping Agents Regional Analysis and Outlook
8.4.5. Australia Non dairy Whipping Agents Regional Analysis and Outlook
8.4.6. South East Asia Non dairy Whipping Agents Regional Analysis and Outlook
8.4.7. Rest of Asia Pacific Non dairy Whipping Agents Regional Analysis and Outlook
8.5. South America Non dairy Whipping Agents Revenue (USD Million), by Country (2021-2032)
8.5.1. Brazil Non dairy Whipping Agents Regional Analysis and Outlook
8.5.2. Argentina Non dairy Whipping Agents Regional Analysis and Outlook
8.5.3. Rest of South America Non dairy Whipping Agents Regional Analysis and Outlook
8.6. Middle East and Africa Non dairy Whipping Agents Revenue (USD Million) by Country (2021-2032)
8.6.1. Middle East Non dairy Whipping Agents Regional Analysis and Outlook
8.6.2. Africa Non dairy Whipping Agents Regional Analysis and Outlook
Chapter 9. North America Non dairy Whipping Agents Analysis and Outlook
9.1. North America Non dairy Whipping Agents Revenue (USD Million) by Segments (2021-2032)
9.1.1. North America Non dairy Whipping Agents Revenue (USD Million) by Type (2021-2032)
9.1.2. North America Non dairy Whipping Agents Revenue (USD Million) by Application (2021-2032)
9.1.3. North America Non dairy Whipping Agents Revenue (USD Million) by Product (2021-2032)
By Type
Liquid Formulations
Spray Dried Powders
By Application
Confectionary
Bakery
Desserts
Others
Chapter 10. Europe Non dairy Whipping Agents Analysis and Outlook
10.1. Europe Non dairy Whipping Agents Revenue (USD Million), by Segments (USD Million) (2021-2032)
10.1.1. Europe Non dairy Whipping Agents Revenue (USD Million) by Type (2021-2032)
10.1.2. Europe Non dairy Whipping Agents Revenue (USD Million) by Application (2021-2032)
10.1.3. Europe Non dairy Whipping Agents Revenue (USD Million) by Product (2021-2032)
By Type
Liquid Formulations
Spray Dried Powders
By Application
Confectionary
Bakery
Desserts
Others
Chapter 11. Asia Pacific Non dairy Whipping Agents Analysis and Outlook
11.1. Asia Pacific Non dairy Whipping Agents Revenue (USD Million), and Revenue (USD Million) by Segments (2021-2032)
11.1.1. Asia Pacific Non dairy Whipping Agents Revenue (USD Million) by Type (2021-2032)
11.1.2. Asia Pacific Non dairy Whipping Agents Revenue (USD Million) by Application (2021-2032)
11.1.3. Asia Pacific Non dairy Whipping Agents Revenue (USD Million) by Product (2021-2032)
By Type
Liquid Formulations
Spray Dried Powders
By Application
Confectionary
Bakery
Desserts
Others
Chapter 12. South America Non dairy Whipping Agents Analysis and Outlook
12.1. South America Non dairy Whipping Agents Revenue (USD Million), by Segments (2021-2032)
12.1.1. South America Non dairy Whipping Agents Revenue (USD Million) by Type (2021-2032)
12.1.2. South America Non dairy Whipping Agents Revenue (USD Million) by Application (2021-2032)
12.1.3. South America Non dairy Whipping Agents Revenue (USD Million) by Product (2021-2032)
By Type
Liquid Formulations
Spray Dried Powders
By Application
Confectionary
Bakery
Desserts
Others
Chapter 13. Middle East and Africa Non dairy Whipping Agents Analysis and Outlook
13.1. Middle East and Africa Non dairy Whipping Agents Revenue (USD Million), by Segments (2021-2032)
13.1.1. Middle East and Africa Non dairy Whipping Agents Revenue (USD Million) by Type (2021-2032)
13.1.2. Middle East and Africa Non dairy Whipping Agents Revenue (USD Million) by Application (2021-2032)
13.1.3. Middle East and Africa Non dairy Whipping Agents Revenue (USD Million) by Product (2021-2032)
By Type
Liquid Formulations
Spray Dried Powders
By Application
Confectionary
Bakery
Desserts
Others
Chapter 14. Non dairy Whipping Agents Company Profiles
14.1 Business Overview
14.2 Product Profiles
14.3 SWOT Profiles
14.5 Recent Developments
14.6 Financial Profile
List of Companies
Ashland Global Holdings Inc.
BASF SE
Conagra Brands, Inc.
Corbion N.V.
DP Supply
FBC Industries
Fine Organics
Gelita AG
Ingredion Inc
Kerry Group Plc
Lasenor
Mokate Ingredients
Molkerei MEGGLE Wasserburg
Palsgaard A/S
Real
Rich Graviss Product
Royal FrieslandCampina NV
SKM Egg Products
Wacker Chemie
15. Methodology and Data Sources
15.1 Customization Offerings
15.2 Subscription Services
15.3 Related Reports
15.4 Publisher Expertise
LIST OF TABLES
Table 1 Market Segmentation Analysis
Table 2 Global Non dairy Whipping Agents Market Share of Leading Companies, 2023
Table 3 Product Offerings of Leading Companies
Table 4 Low Growth Scenario Forecasts
Table 5 Reference Case Growth Scenario
Table 6 High Growth Case Scenario
Table 7 Global Non dairy Whipping Agents Revenue (USD Million) And CAGR (%) By Type (2021-2032)
Table 8 Global Non dairy Whipping Agents Revenue (USD Million) And CAGR (%) By Application (2021-2032)
Table 9 Global Non dairy Whipping Agents Revenue (USD Million) And CAGR (%) By Product (2021-2032)
Table 10 Global Non dairy Whipping Agents Market Revenue (USD Million) By Regions (2021-2032)
Table 11 Global Non dairy Whipping Agents Market Share (%) By Regions (2021-2032)
Table 12 North America Non dairy Whipping Agents Revenue (USD Million) By Country (2021-2032)
Table 13 Europe Non dairy Whipping Agents Revenue (USD Million) By Country (2021-2032)
Table 14 Asia Pacific Non dairy Whipping Agents Revenue (USD Million) By Country (2021-2032)
Table 15 South America Non dairy Whipping Agents Revenue (USD Million) By Country (2021-2032)
Table 16 Middle East and Africa Non dairy Whipping Agents Revenue (USD Million) By Region (2021-2032)
Table 17 North America Non dairy Whipping Agents Revenue (USD Million) By Type (2021-2032)
Table 18 North America Non dairy Whipping Agents Revenue (USD Million) By Application (2021-2032)
Table 19 North America Non dairy Whipping Agents Revenue (USD Million) By Product (2021-2032)
Table 20 Europe Non dairy Whipping Agents Revenue (USD Million) By Type (2021-2032)
Table 21 Europe Non dairy Whipping Agents Revenue (USD Million) By Application (2021-2032)
Table 22 Europe Non dairy Whipping Agents Revenue (USD Million) By Product (2021-2032)
Table 23 Asia Pacific Non dairy Whipping Agents Revenue (USD Million) By Type (2021-2032)
Table 24 Asia Pacific Non dairy Whipping Agents Revenue (USD Million) By Application (2021-2032)
Table 25 Asia Pacific Non dairy Whipping Agents Revenue (USD Million) By Product (2021-2032)
Table 26 South America Non dairy Whipping Agents Revenue (USD Million) By Type (2021-2032)
Table 27 South America Non dairy Whipping Agents Revenue (USD Million) By Application (2021-2032)
Table 28 South America Non dairy Whipping Agents Revenue (USD Million) By Product (2021-2032)
Table 29 Middle East and Africa Non dairy Whipping Agents Revenue (USD Million) By Type (2021-2032)
Table 30 Middle East and Africa Non dairy Whipping Agents Revenue (USD Million) By Application (2021-2032)
Table 31 Middle East and Africa Non dairy Whipping Agents Revenue (USD Million) By Product (2021-2032)
LIST OF FIGURES
Figure 1. Market Scope
Figure 2. Pricing Forecasts Per Unit, 2023- 2032
Figure 3. Porter’s Five Forces
Figure 4. Global Non dairy Whipping Agents Market Revenue (USD Million) By Regions (2021-2032)
Figure 5. Global Non dairy Whipping Agents Market Share (%) By Regions (2023)
Figure 6. North America Non dairy Whipping Agents Revenue (USD Million) By Country (2021-2032)
Figure 7. United States Non dairy Whipping Agents Revenue (USD Million) By Country (2021-2032)
Figure 8. Canada Non dairy Whipping Agents Revenue (USD Million) By Country (2021-2032)
Figure 9. Mexico Non dairy Whipping Agents Revenue (USD Million) By Country (2021-2032)
Figure 10. Europe Non dairy Whipping Agents Revenue (USD Million) By Country (2021-2032)
Figure 11. Germany Non dairy Whipping Agents Revenue (USD Million) By Country (2021-2032)
Figure 12. France Non dairy Whipping Agents Revenue (USD Million) By Country (2021-2032)
Figure 13. United Kingdom Non dairy Whipping Agents Revenue (USD Million) By Country (2021-2032)
Figure 14. Spain Non dairy Whipping Agents Revenue (USD Million) By Country (2021-2032)
Figure 15. Italy Non dairy Whipping Agents Revenue (USD Million) By Country (2021-2032)
Figure 16. Russia Non dairy Whipping Agents Revenue (USD Million) By Country (2021-2032)
Figure 17. Rest of Europe Non dairy Whipping Agents Revenue (USD Million) By Country (2021-2032)
Figure 11. Asia Pacific Non dairy Whipping Agents Revenue (USD Million) By Country (2021-2032)
Figure 12. China Non dairy Whipping Agents Revenue (USD Million) By Country (2021-2032)
Figure 13. Japan Non dairy Whipping Agents Revenue (USD Million) By Country (2021-2032)
Figure 14. India Non dairy Whipping Agents Revenue (USD Million) By Country (2021-2032)
Figure 15. South Korea Non dairy Whipping Agents Revenue (USD Million) By Country (2021-2032)
Figure 16. Australia Non dairy Whipping Agents Revenue (USD Million) By Country (2021-2032)
Figure 17. South East Asia Non dairy Whipping Agents Revenue (USD Million) By Country (2021-2032)
Figure 18. South America Non dairy Whipping Agents Revenue (USD Million) By Country (2021-2032)
Figure 19. Brazil Non dairy Whipping Agents Revenue (USD Million) By Country (2021-2032)
Figure 20. Argentina Non dairy Whipping Agents Revenue (USD Million) By Country (2021-2032)
Figure 21. Rest of Asia Pacific Non dairy Whipping Agents Revenue (USD Million) By Country (2021-2032)
Figure 22. Middle East and Africa Non dairy Whipping Agents Revenue (USD Million) By Region (2021-2032)
Figure 23. Saudi Arabia Non dairy Whipping Agents Revenue (USD Million) By Region (2021-2032)
Figure 24. The UAE Non dairy Whipping Agents Revenue (USD Million) By Region (2021-2032)
Figure 25. Rest of Middle East Non dairy Whipping Agents Revenue (USD Million) By Region (2021-2032)
Figure 26. South Africa Non dairy Whipping Agents Revenue (USD Million) By Region (2021-2032)
Figure 27. Africa Non dairy Whipping Agents Revenue (USD Million) By Region (2021-2032)
Figure 28. North America Non dairy Whipping Agents Revenue (USD Million) By Type (2021-2032)
Figure 29. North America Non dairy Whipping Agents Revenue (USD Million) By Application (2021-2032)
Figure 30. North America Non dairy Whipping Agents Revenue (USD Million) By Product (2021-2032)
Figure 31. Europe Non dairy Whipping Agents Revenue (USD Million) By Type (2021-2032)
Figure 32. Europe Non dairy Whipping Agents Revenue (USD Million) By Application (2021-2032)
Figure 33. Europe Non dairy Whipping Agents Revenue (USD Million) By Product (2021-2032)
Figure 34. Asia Pacific Non dairy Whipping Agents Revenue (USD Million) By Type (2021-2032)
Figure 35. Asia Pacific Non dairy Whipping Agents Revenue (USD Million) By Application (2021-2032)
Figure 36. Asia Pacific Non dairy Whipping Agents Revenue (USD Million) By Product (2021-2032)
Figure 37. South America Non dairy Whipping Agents Revenue (USD Million) By Type (2021-2032)
Figure 38. South America Non dairy Whipping Agents Revenue (USD Million) By Application (2021-2032)
Figure 39. South America Non dairy Whipping Agents Revenue (USD Million) By Product (2021-2032)
Figure 40. Middle East and Africa Non dairy Whipping Agents Revenue (USD Million) By Type (2021-2032)
Figure 41. Middle East and Africa Non dairy Whipping Agents Revenue (USD Million) By Application (2021-2032)
Figure 42. Middle East and Africa Non dairy Whipping Agents Revenue (USD Million) By Product (2021-2032)
By Type
Liquid Formulations
Spray Dried Powders
By Application
Confectionary
Bakery
Desserts
Others
Countries Analyzed
North America (US, Canada, Mexico)
Europe (Germany, UK, France, Spain, Italy, Russia, Rest of Europe)
Asia Pacific (China, India, Japan, South Korea, Australia, South East Asia, Rest of Asia)
South America (Brazil, Argentina, Rest of South America)
Middle East and Africa (Saudi Arabia, UAE, Rest of Middle East, South Africa, Egypt, Rest of Africa)
