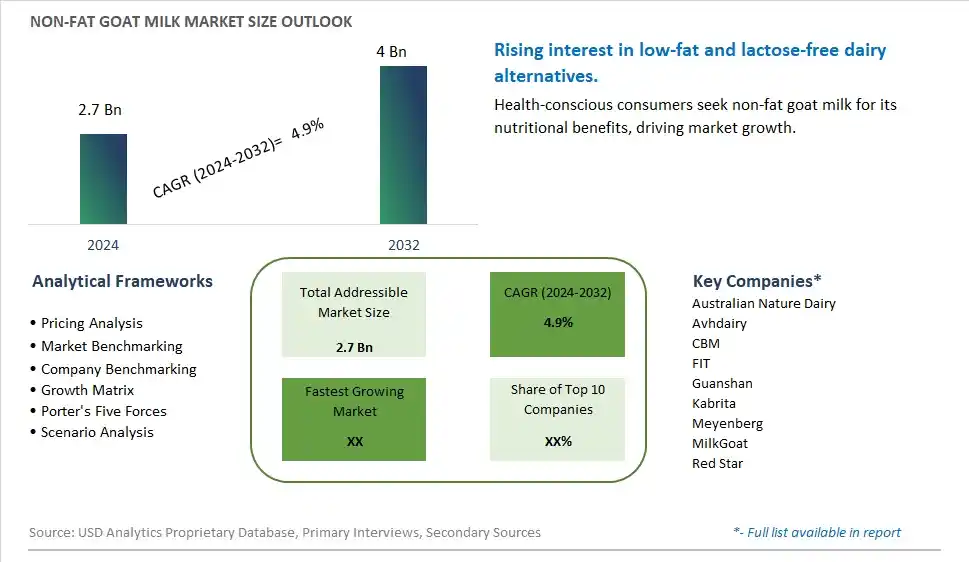
Global Non-Fat Goat Milk Market Size is valued at $2.7 Billion in 2024 and is forecast to register a growth rate (CAGR) of 4.9% to reach $4 Billion by 2032.
The global Non-Fat Goat Milk Market Comprehensive Study analyzes and forecasts the market size across 6 regions and 24 countries for diverse segments -By Form (Liquid, Powder), By Distribution Channel (Supermarkets/ Hypermarkets, Convenience Stores, Specialty Stores, Online Retail, Others)
An Introduction to Non-Fat Goat Milk Market
The Non-Fat Goat Milk Market involves the production and sale of goat milk formulated without fats, catering to consumers seeking low-fat and nutritious dairy alternatives. The market is driven by increasing awareness about the health benefits of goat milk, rising demand for low-fat and low-calorie dairy products, and growing popularity of natural and minimally processed foods. Additionally, advancements in milk processing technologies and the expansion of product offerings support market growth.
Non Fat Goat Milk Competitive Landscape
The market report analyses the leading companies in the industry including Australian Nature Dairy, Avhdairy, CBM, FIT, Guanshan, Kabrita, Meyenberg, MilkGoat, Red Star, and Others.
Non Fat Goat Milk Market Dynamics
Non-Fat Goat Milk Market Trend: Growing Popularity of Low-Fat Dairy Alternatives
The most prominent trend in the Non-Fat Goat Milk Market is the growing popularity of low-fat dairy alternatives. Non-fat goat milk, known for its nutritional benefits and digestibility, is gaining traction among consumers seeking healthier and lower-fat dairy options. This trend is driven by the increasing awareness of the health benefits of goat milk, such as its higher protein content and lower lactose levels compared to cow's milk.
Non-Fat Goat Milk Market Driver: Health Consciousness and Dietary Preferences
A key driver in the Non-Fat Goat Milk Market is health consciousness and changing dietary preferences. As more individuals focus on improving their diet and reducing fat intake, there is a rising demand for non-fat goat milk that provides a healthy alternative to traditional dairy products. This demand is particularly strong among consumers with lactose intolerance, dairy allergies, and those seeking nutrient-dense food options.
Non-Fat Goat Milk Market Opportunity: Innovation in Dairy Products and Nutritional Enhancements
One significant opportunity in the Non-Fat Goat Milk Market lies in innovation in dairy products and nutritional enhancements. Companies can develop new non-fat goat milk products, such as yogurts, cheeses, and beverages, with added vitamins, minerals, and probiotics to cater to health-conscious consumers. By offering diverse and health-focused dairy alternatives, manufacturers can attract a broader consumer base and drive market growth.
Non-Fat Goat Milk Market Share Analysis- Largest Segment by Form
In the Non-Fat Goat Milk Market, the Liquid form is the largest segment. Liquid non-fat goat milk dominates due to its convenience and versatility, making it a preferred choice for consumers and manufacturers alike. It is readily used in a variety of applications, from direct consumption to inclusion in dairy products and food preparations. The liquid form offers ease of use and incorporation into daily diets, which drives its high market share. Additionally, the liquid variant aligns well with consumer preferences for fresh and easily consumable products, contributing to its leading position in the market. The widespread availability of liquid non-fat goat milk in retail outlets further supports its dominance in this segment.
Non-Fat Goat Milk Market Share Analysis- Fastest Growing Segment by Distribution Channel
In the Non-Fat Goat Milk Market, the Online Retail distribution channel is expected to grow the fastest over the next five years. This growth is fueled by the increasing trend of online shopping and the rising consumer preference for purchasing specialty products through digital platforms. Online retail provides convenience and accessibility, allowing consumers to easily find and order non-fat goat milk products from the comfort of their homes. The expansion of e-commerce and the development of user-friendly online shopping platforms contribute to this segment's rapid growth. Additionally, online retail offers a wider range of products and brands, catering to diverse consumer preferences and dietary needs, which further accelerates its growth in the non-fat goat milk market.
Non Fat Goat Milk Market Segmentation
By Form
Liquid
Powder
By Distribution Channel
Supermarkets/ Hypermarkets
Convenience Stores
Specialty Stores
Online Retail
Others
Countries Analyzed
North America (US, Canada, Mexico)
Europe (Germany, UK, France, Spain, Italy, Russia, Rest of Europe)
Asia Pacific (China, India, Japan, South Korea, Australia, South East Asia, Rest of Asia)
South America (Brazil, Argentina, Rest of South America)
Middle East and Africa (Saudi Arabia, UAE, Rest of Middle East, South Africa, Egypt, Rest of Africa)
Non Fat Goat Milk Companies Profiled in the Study
Australian Nature Dairy
Avhdairy
CBM
FIT
Guanshan
Kabrita
Meyenberg
MilkGoat
Red Star
*- List Not Exhaustive
Chapter 1. TABLE OF CONTENTS
Chapter 2. Introduction to Non Fat Goat Milk Market
2.1. Market Overview
2.2. Key Statistics and Report Highlights
2.3. Scope of the Comprehensive Study
2.3.1. Market Definition
2.3.2 Countries and Regions Covered
2.3.3 Research Objective
2.3.4 Units, Currency, and Conversions
2.3.5 Industry Value Chain
2.4. Key Market Segments
2.5. Key Companies
2.6. Study Period
Chapter 3. Strategic Analysis Review
3.1. Non Fat Goat Milk Pricing Analysis and Forecast
3.2. Porter’s Five Forces
3.3. Market Ecosystem
3.4. SWOT Analysis
3.5. Regulatory Scenario
3.3. Effects of Inflation, Russia-Ukraine War, moderating economic growth, and other macroeconomic factors
Chapter 4. Competitive Landscape
4.1. Market Share Analysis
4.1.1. Global Non Fat Goat Milk Market Share by Company, 2023
4.1.2. Product Offerings of Leading Non Fat Goat Milk Companies
4.2. Market Entropy
4.2.1. New Product Launches in the Industry
4.2.2. Mergers, Acquisitions, Joint ventures, and Partnerships
4.3. Key Strategies and Best Practices
Chapter 5. Global Market Projections: Best, Reference, and Low Case Scenarios
5.1. Growth Analysis- Case Scenario Definitions
5.2. Low Growth Case Scenario Forecasts
5.3. Reference Growth Case Scenario Forecasts
5.4. High Growth Case Scenario Forecasts
Chapter 6. Market Dynamics
6.1. Non Fat Goat Milk Market Drivers
6.2. Non Fat Goat Milk Market Challenges
6.6. Non Fat Goat Milk Market Opportunities
6.4. Non Fat Goat Milk Market Trends
Chapter 7. Global Non Fat Goat Milk Market Outlook Trends
7.1. Global Non Fat Goat Milk Revenue (USD Million) and CAGR (%) by Type (2021-2032)
7.2. Global Non Fat Goat Milk Revenue (USD Million) and CAGR (%) by Application (2021-2032)
7.3. Global Non Fat Goat Milk Revenue (USD Million) and CAGR (%) by Product (2021-2032)
By Form
Liquid
Powder
By Distribution Channel
Supermarkets/ Hypermarkets
Convenience Stores
Specialty Stores
Online Retail
Others
Chapter 8. Global Non Fat Goat Milk Regional Analysis and Outlook
8.1. Global Non Fat Goat Milk Revenue (USD Million) By Regions (2021- 2032)
8.2. North America Non Fat Goat Milk Revenue (USD Million) by Country (2021-2032)
8.2.1. United States Non Fat Goat Milk Regional Analysis and Outlook
8.2.2. Canada Non Fat Goat Milk Regional Analysis and Outlook
8.2.3. Mexico Non Fat Goat Milk Regional Analysis and Outlook
8.3. Europe Non Fat Goat Milk Revenue (USD Million), by Country (2021-2032)
8.3.1. Germany Non Fat Goat Milk Regional Analysis and Outlook
8.3.2. France Non Fat Goat Milk Regional Analysis and Outlook
8.3.3. United Kingdom Non Fat Goat Milk Regional Analysis and Outlook
8.3.4. Spain Non Fat Goat Milk Regional Analysis and Outlook
8.3.5. Italy Non Fat Goat Milk Regional Analysis and Outlook
8.3.6. Russia Non Fat Goat Milk Regional Analysis and Outlook
8.3.7. Rest of Europe Non Fat Goat Milk Regional Analysis and Outlook
8.4. Asia Pacific Non Fat Goat Milk Revenue (USD Million) by Country (2021-2032)
8.4.1. China Non Fat Goat Milk Regional Analysis and Outlook
8.4.2. Japan Non Fat Goat Milk Regional Analysis and Outlook
8.4.3. India Non Fat Goat Milk Regional Analysis and Outlook
8.4.4. South Korea Non Fat Goat Milk Regional Analysis and Outlook
8.4.5. Australia Non Fat Goat Milk Regional Analysis and Outlook
8.4.6. South East Asia Non Fat Goat Milk Regional Analysis and Outlook
8.4.7. Rest of Asia Pacific Non Fat Goat Milk Regional Analysis and Outlook
8.5. South America Non Fat Goat Milk Revenue (USD Million), by Country (2021-2032)
8.5.1. Brazil Non Fat Goat Milk Regional Analysis and Outlook
8.5.2. Argentina Non Fat Goat Milk Regional Analysis and Outlook
8.5.3. Rest of South America Non Fat Goat Milk Regional Analysis and Outlook
8.6. Middle East and Africa Non Fat Goat Milk Revenue (USD Million) by Country (2021-2032)
8.6.1. Middle East Non Fat Goat Milk Regional Analysis and Outlook
8.6.2. Africa Non Fat Goat Milk Regional Analysis and Outlook
Chapter 9. North America Non Fat Goat Milk Analysis and Outlook
9.1. North America Non Fat Goat Milk Revenue (USD Million) by Segments (2021-2032)
9.1.1. North America Non Fat Goat Milk Revenue (USD Million) by Type (2021-2032)
9.1.2. North America Non Fat Goat Milk Revenue (USD Million) by Application (2021-2032)
9.1.3. North America Non Fat Goat Milk Revenue (USD Million) by Product (2021-2032)
By Form
Liquid
Powder
By Distribution Channel
Supermarkets/ Hypermarkets
Convenience Stores
Specialty Stores
Online Retail
Others
Chapter 10. Europe Non Fat Goat Milk Analysis and Outlook
10.1. Europe Non Fat Goat Milk Revenue (USD Million), by Segments (USD Million) (2021-2032)
10.1.1. Europe Non Fat Goat Milk Revenue (USD Million) by Type (2021-2032)
10.1.2. Europe Non Fat Goat Milk Revenue (USD Million) by Application (2021-2032)
10.1.3. Europe Non Fat Goat Milk Revenue (USD Million) by Product (2021-2032)
By Form
Liquid
Powder
By Distribution Channel
Supermarkets/ Hypermarkets
Convenience Stores
Specialty Stores
Online Retail
Others
Chapter 11. Asia Pacific Non Fat Goat Milk Analysis and Outlook
11.1. Asia Pacific Non Fat Goat Milk Revenue (USD Million), and Revenue (USD Million) by Segments (2021-2032)
11.1.1. Asia Pacific Non Fat Goat Milk Revenue (USD Million) by Type (2021-2032)
11.1.2. Asia Pacific Non Fat Goat Milk Revenue (USD Million) by Application (2021-2032)
11.1.3. Asia Pacific Non Fat Goat Milk Revenue (USD Million) by Product (2021-2032)
By Form
Liquid
Powder
By Distribution Channel
Supermarkets/ Hypermarkets
Convenience Stores
Specialty Stores
Online Retail
Others
Chapter 12. South America Non Fat Goat Milk Analysis and Outlook
12.1. South America Non Fat Goat Milk Revenue (USD Million), by Segments (2021-2032)
12.1.1. South America Non Fat Goat Milk Revenue (USD Million) by Type (2021-2032)
12.1.2. South America Non Fat Goat Milk Revenue (USD Million) by Application (2021-2032)
12.1.3. South America Non Fat Goat Milk Revenue (USD Million) by Product (2021-2032)
By Form
Liquid
Powder
By Distribution Channel
Supermarkets/ Hypermarkets
Convenience Stores
Specialty Stores
Online Retail
Others
Chapter 13. Middle East and Africa Non Fat Goat Milk Analysis and Outlook
13.1. Middle East and Africa Non Fat Goat Milk Revenue (USD Million), by Segments (2021-2032)
13.1.1. Middle East and Africa Non Fat Goat Milk Revenue (USD Million) by Type (2021-2032)
13.1.2. Middle East and Africa Non Fat Goat Milk Revenue (USD Million) by Application (2021-2032)
13.1.3. Middle East and Africa Non Fat Goat Milk Revenue (USD Million) by Product (2021-2032)
By Form
Liquid
Powder
By Distribution Channel
Supermarkets/ Hypermarkets
Convenience Stores
Specialty Stores
Online Retail
Others
Chapter 14. Non Fat Goat Milk Company Profiles
14.1 Business Overview
14.2 Product Profiles
14.3 SWOT Profiles
14.5 Recent Developments
14.6 Financial Profile
List of Companies
Australian Nature Dairy
Avhdairy
CBM
FIT
Guanshan
Kabrita
Meyenberg
MilkGoat
Red Star
15. Methodology and Data Sources
15.1 Customization Offerings
15.2 Subscription Services
15.3 Related Reports
15.4 Publisher Expertise
LIST OF TABLES
Table 1 Market Segmentation Analysis
Table 2 Global Non Fat Goat Milk Market Share of Leading Companies, 2023
Table 3 Product Offerings of Leading Companies
Table 4 Low Growth Scenario Forecasts
Table 5 Reference Case Growth Scenario
Table 6 High Growth Case Scenario
Table 7 Global Non Fat Goat Milk Revenue (USD Million) And CAGR (%) By Type (2021-2032)
Table 8 Global Non Fat Goat Milk Revenue (USD Million) And CAGR (%) By Application (2021-2032)
Table 9 Global Non Fat Goat Milk Revenue (USD Million) And CAGR (%) By Product (2021-2032)
Table 10 Global Non Fat Goat Milk Market Revenue (USD Million) By Regions (2021-2032)
Table 11 Global Non Fat Goat Milk Market Share (%) By Regions (2021-2032)
Table 12 North America Non Fat Goat Milk Revenue (USD Million) By Country (2021-2032)
Table 13 Europe Non Fat Goat Milk Revenue (USD Million) By Country (2021-2032)
Table 14 Asia Pacific Non Fat Goat Milk Revenue (USD Million) By Country (2021-2032)
Table 15 South America Non Fat Goat Milk Revenue (USD Million) By Country (2021-2032)
Table 16 Middle East and Africa Non Fat Goat Milk Revenue (USD Million) By Region (2021-2032)
Table 17 North America Non Fat Goat Milk Revenue (USD Million) By Type (2021-2032)
Table 18 North America Non Fat Goat Milk Revenue (USD Million) By Application (2021-2032)
Table 19 North America Non Fat Goat Milk Revenue (USD Million) By Product (2021-2032)
Table 20 Europe Non Fat Goat Milk Revenue (USD Million) By Type (2021-2032)
Table 21 Europe Non Fat Goat Milk Revenue (USD Million) By Application (2021-2032)
Table 22 Europe Non Fat Goat Milk Revenue (USD Million) By Product (2021-2032)
Table 23 Asia Pacific Non Fat Goat Milk Revenue (USD Million) By Type (2021-2032)
Table 24 Asia Pacific Non Fat Goat Milk Revenue (USD Million) By Application (2021-2032)
Table 25 Asia Pacific Non Fat Goat Milk Revenue (USD Million) By Product (2021-2032)
Table 26 South America Non Fat Goat Milk Revenue (USD Million) By Type (2021-2032)
Table 27 South America Non Fat Goat Milk Revenue (USD Million) By Application (2021-2032)
Table 28 South America Non Fat Goat Milk Revenue (USD Million) By Product (2021-2032)
Table 29 Middle East and Africa Non Fat Goat Milk Revenue (USD Million) By Type (2021-2032)
Table 30 Middle East and Africa Non Fat Goat Milk Revenue (USD Million) By Application (2021-2032)
Table 31 Middle East and Africa Non Fat Goat Milk Revenue (USD Million) By Product (2021-2032)
LIST OF FIGURES
Figure 1. Market Scope
Figure 2. Pricing Forecasts Per Unit, 2023- 2032
Figure 3. Porter’s Five Forces
Figure 4. Global Non Fat Goat Milk Market Revenue (USD Million) By Regions (2021-2032)
Figure 5. Global Non Fat Goat Milk Market Share (%) By Regions (2023)
Figure 6. North America Non Fat Goat Milk Revenue (USD Million) By Country (2021-2032)
Figure 7. United States Non Fat Goat Milk Revenue (USD Million) By Country (2021-2032)
Figure 8. Canada Non Fat Goat Milk Revenue (USD Million) By Country (2021-2032)
Figure 9. Mexico Non Fat Goat Milk Revenue (USD Million) By Country (2021-2032)
Figure 10. Europe Non Fat Goat Milk Revenue (USD Million) By Country (2021-2032)
Figure 11. Germany Non Fat Goat Milk Revenue (USD Million) By Country (2021-2032)
Figure 12. France Non Fat Goat Milk Revenue (USD Million) By Country (2021-2032)
Figure 13. United Kingdom Non Fat Goat Milk Revenue (USD Million) By Country (2021-2032)
Figure 14. Spain Non Fat Goat Milk Revenue (USD Million) By Country (2021-2032)
Figure 15. Italy Non Fat Goat Milk Revenue (USD Million) By Country (2021-2032)
Figure 16. Russia Non Fat Goat Milk Revenue (USD Million) By Country (2021-2032)
Figure 17. Rest of Europe Non Fat Goat Milk Revenue (USD Million) By Country (2021-2032)
Figure 11. Asia Pacific Non Fat Goat Milk Revenue (USD Million) By Country (2021-2032)
Figure 12. China Non Fat Goat Milk Revenue (USD Million) By Country (2021-2032)
Figure 13. Japan Non Fat Goat Milk Revenue (USD Million) By Country (2021-2032)
Figure 14. India Non Fat Goat Milk Revenue (USD Million) By Country (2021-2032)
Figure 15. South Korea Non Fat Goat Milk Revenue (USD Million) By Country (2021-2032)
Figure 16. Australia Non Fat Goat Milk Revenue (USD Million) By Country (2021-2032)
Figure 17. South East Asia Non Fat Goat Milk Revenue (USD Million) By Country (2021-2032)
Figure 18. South America Non Fat Goat Milk Revenue (USD Million) By Country (2021-2032)
Figure 19. Brazil Non Fat Goat Milk Revenue (USD Million) By Country (2021-2032)
Figure 20. Argentina Non Fat Goat Milk Revenue (USD Million) By Country (2021-2032)
Figure 21. Rest of Asia Pacific Non Fat Goat Milk Revenue (USD Million) By Country (2021-2032)
Figure 22. Middle East and Africa Non Fat Goat Milk Revenue (USD Million) By Region (2021-2032)
Figure 23. Saudi Arabia Non Fat Goat Milk Revenue (USD Million) By Region (2021-2032)
Figure 24. The UAE Non Fat Goat Milk Revenue (USD Million) By Region (2021-2032)
Figure 25. Rest of Middle East Non Fat Goat Milk Revenue (USD Million) By Region (2021-2032)
Figure 26. South Africa Non Fat Goat Milk Revenue (USD Million) By Region (2021-2032)
Figure 27. Africa Non Fat Goat Milk Revenue (USD Million) By Region (2021-2032)
Figure 28. North America Non Fat Goat Milk Revenue (USD Million) By Type (2021-2032)
Figure 29. North America Non Fat Goat Milk Revenue (USD Million) By Application (2021-2032)
Figure 30. North America Non Fat Goat Milk Revenue (USD Million) By Product (2021-2032)
Figure 31. Europe Non Fat Goat Milk Revenue (USD Million) By Type (2021-2032)
Figure 32. Europe Non Fat Goat Milk Revenue (USD Million) By Application (2021-2032)
Figure 33. Europe Non Fat Goat Milk Revenue (USD Million) By Product (2021-2032)
Figure 34. Asia Pacific Non Fat Goat Milk Revenue (USD Million) By Type (2021-2032)
Figure 35. Asia Pacific Non Fat Goat Milk Revenue (USD Million) By Application (2021-2032)
Figure 36. Asia Pacific Non Fat Goat Milk Revenue (USD Million) By Product (2021-2032)
Figure 37. South America Non Fat Goat Milk Revenue (USD Million) By Type (2021-2032)
Figure 38. South America Non Fat Goat Milk Revenue (USD Million) By Application (2021-2032)
Figure 39. South America Non Fat Goat Milk Revenue (USD Million) By Product (2021-2032)
Figure 40. Middle East and Africa Non Fat Goat Milk Revenue (USD Million) By Type (2021-2032)
Figure 41. Middle East and Africa Non Fat Goat Milk Revenue (USD Million) By Application (2021-2032)
Figure 42. Middle East and Africa Non Fat Goat Milk Revenue (USD Million) By Product (2021-2032)
By Form
Liquid
Powder
By Distribution Channel
Supermarkets/ Hypermarkets
Convenience Stores
Specialty Stores
Online Retail
Others
Countries Analyzed
North America (US, Canada, Mexico)
Europe (Germany, UK, France, Spain, Italy, Russia, Rest of Europe)
Asia Pacific (China, India, Japan, South Korea, Australia, South East Asia, Rest of Asia)
South America (Brazil, Argentina, Rest of South America)
Middle East and Africa (Saudi Arabia, UAE, Rest of Middle East, South Africa, Egypt, Rest of Africa)
