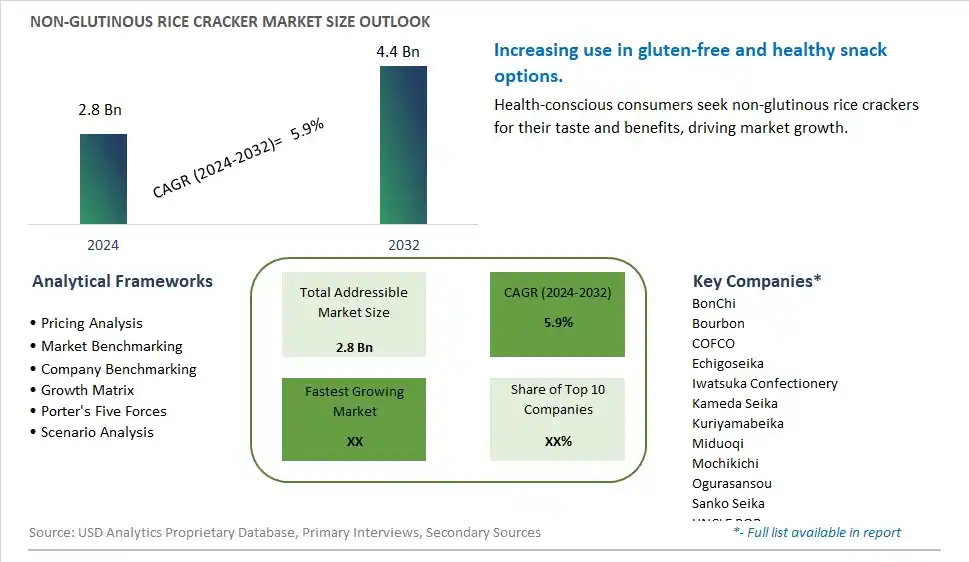
Global Non-Glutinous Rice Cracker Market Size is valued at $2.8 Billion in 2024 and is forecast to register a growth rate (CAGR) of 5.9% to reach $4.4 Billion by 2032.
The global Non-Glutinous Rice Cracker Market Comprehensive Study analyzes and forecasts the market size across 6 regions and 24 countries for diverse segments -By Type (Traditional Japanese Cracker, Regional Senbei, Others), By Application (Supermarkets/Hypermarkets, Independent Retailers, Convenience Stores, Online Retailers, Others)
An Introduction to Non-Glutinous Rice Cracker Market
The Non-Glutinous Rice Cracker Market focuses on the production and sale of rice crackers made from non-glutinous rice, catering to consumers seeking gluten-free and traditional snack options. The market is driven by increasing demand for gluten-free products, rising popularity of rice-based snacks, and growing awareness about the health benefits of non-glutinous rice. Additionally, advancements in rice cracker formulations and the expansion of product offerings support market growth.
Non Glutinous Rice Cracker Competitive Landscape
The market report analyses the leading companies in the industry including BonChi, Bourbon, COFCO, Echigoseika, Iwatsuka Confectionery, Kameda Seika, Kuriyamabeika, Miduoqi, Mochikichi, Ogurasansou, Sanko Seika, UNCLE POP, Want Want, Xiaowangzi Food, and Others.
Non Glutinous Rice Cracker Market Dynamics
Non-Glutinous Rice Cracker Market Trend: Increasing Demand for Gluten-Free Snacks
The most prominent trend in the Non-Glutinous Rice Cracker Market is the increasing demand for gluten-free snacks. Non-glutinous rice crackers, known for their crispy texture and versatility, are becoming popular among consumers seeking gluten-free snack options. This trend is driven by the rise in gluten intolerance and the growing awareness of the benefits of gluten-free diets.
Non-Glutinous Rice Cracker Market Driver: Health Consciousness and Dietary Preferences
A key driver in the Non-Glutinous Rice Cracker Market is health consciousness and dietary preferences. As more individuals focus on improving their diet and avoiding gluten, there is a rising demand for non-glutinous rice crackers that provide a healthy and convenient alternative to traditional snacks. This demand is particularly strong among consumers with celiac disease, gluten sensitivity, and those following gluten-free diets.
Non-Glutinous Rice Cracker Market Opportunity: Innovation in Flavor and Nutritional Enhancements
One significant opportunity in the Non-Glutinous Rice Cracker Market lies in innovation in flavor and nutritional enhancements. Companies can develop new non-glutinous rice cracker products with diverse and appealing flavors, such as savory, spicy, and sweet varieties, and incorporate additional nutrients like protein, fiber, and vitamins. By offering innovative and health-focused snack options, manufacturers can attract a broader consumer base and drive market growth.
Non-Glutinous Rice Cracker Market Share Analysis- Largest Segment by Type
In the Non-Glutinous Rice Cracker Market, Traditional Japanese Crackers hold the largest market share. This dominance is due to the deep-rooted cultural significance and long-standing popularity of these crackers in Japanese cuisine. Traditional Japanese crackers, such as Senbei, have been a staple snack in Japan for centuries and are renowned for their distinctive textures and flavors. Their widespread acceptance and integration into various culinary traditions, both within Japan and in international markets, contribute to their leading position. Additionally, their authentic production methods and heritage appeal enhance their market presence, making them the largest segment in the non-glutinous rice cracker market.
Non-Glutinous Rice Cracker Market Share Analysis- Fastest Growing Segment by Application
In the Non-Glutinous Rice Cracker Market, the Online Retailers application segment is poised to grow the fastest over the next five years. The rapid expansion of e-commerce platforms and increased consumer preference for online shopping are driving this growth. Online retailers offer a broader selection of rice crackers, including specialty and artisanal options that may not be available in traditional retail stores. The convenience of online shopping, combined with the ability to access global markets and niche products, is attracting a growing number of consumers. As more people turn to online shopping for a diverse range of products, including non-glutinous rice crackers, this segment is expected to see significant growth.
Non Glutinous Rice Cracker Market Segmentation
By Type
Traditional Japanese Cracker
Regional Senbei
Others
By Application
Supermarkets/Hypermarkets
Independent Retailers
Convenience Stores
Online Retailers
Others
Countries Analyzed
North America (US, Canada, Mexico)
Europe (Germany, UK, France, Spain, Italy, Russia, Rest of Europe)
Asia Pacific (China, India, Japan, South Korea, Australia, South East Asia, Rest of Asia)
South America (Brazil, Argentina, Rest of South America)
Middle East and Africa (Saudi Arabia, UAE, Rest of Middle East, South Africa, Egypt, Rest of Africa)
Non Glutinous Rice Cracker Companies Profiled in the Study
BonChi
Bourbon
COFCO
Echigoseika
Iwatsuka Confectionery
Kameda Seika
Kuriyamabeika
Miduoqi
Mochikichi
Ogurasansou
Sanko Seika
UNCLE POP
Want Want
Xiaowangzi Food
*- List Not Exhaustive
Chapter 1. TABLE OF CONTENTS
Chapter 2. Introduction to Non Glutinous Rice Cracker Market
2.1. Market Overview
2.2. Key Statistics and Report Highlights
2.3. Scope of the Comprehensive Study
2.3.1. Market Definition
2.3.2 Countries and Regions Covered
2.3.3 Research Objective
2.3.4 Units, Currency, and Conversions
2.3.5 Industry Value Chain
2.4. Key Market Segments
2.5. Key Companies
2.6. Study Period
Chapter 3. Strategic Analysis Review
3.1. Non Glutinous Rice Cracker Pricing Analysis and Forecast
3.2. Porter’s Five Forces
3.3. Market Ecosystem
3.4. SWOT Analysis
3.5. Regulatory Scenario
3.3. Effects of Inflation, Russia-Ukraine War, moderating economic growth, and other macroeconomic factors
Chapter 4. Competitive Landscape
4.1. Market Share Analysis
4.1.1. Global Non Glutinous Rice Cracker Market Share by Company, 2023
4.1.2. Product Offerings of Leading Non Glutinous Rice Cracker Companies
4.2. Market Entropy
4.2.1. New Product Launches in the Industry
4.2.2. Mergers, Acquisitions, Joint ventures, and Partnerships
4.3. Key Strategies and Best Practices
Chapter 5. Global Market Projections: Best, Reference, and Low Case Scenarios
5.1. Growth Analysis- Case Scenario Definitions
5.2. Low Growth Case Scenario Forecasts
5.3. Reference Growth Case Scenario Forecasts
5.4. High Growth Case Scenario Forecasts
Chapter 6. Market Dynamics
6.1. Non Glutinous Rice Cracker Market Drivers
6.2. Non Glutinous Rice Cracker Market Challenges
6.6. Non Glutinous Rice Cracker Market Opportunities
6.4. Non Glutinous Rice Cracker Market Trends
Chapter 7. Global Non Glutinous Rice Cracker Market Outlook Trends
7.1. Global Non Glutinous Rice Cracker Revenue (USD Million) and CAGR (%) by Type (2021-2032)
7.2. Global Non Glutinous Rice Cracker Revenue (USD Million) and CAGR (%) by Application (2021-2032)
7.3. Global Non Glutinous Rice Cracker Revenue (USD Million) and CAGR (%) by Product (2021-2032)
By Type
Traditional Japanese Cracker
Regional Senbei
Others
By Application
Supermarkets/Hypermarkets
Independent Retailers
Convenience Stores
Online Retailers
Others
Chapter 8. Global Non Glutinous Rice Cracker Regional Analysis and Outlook
8.1. Global Non Glutinous Rice Cracker Revenue (USD Million) By Regions (2021- 2032)
8.2. North America Non Glutinous Rice Cracker Revenue (USD Million) by Country (2021-2032)
8.2.1. United States Non Glutinous Rice Cracker Regional Analysis and Outlook
8.2.2. Canada Non Glutinous Rice Cracker Regional Analysis and Outlook
8.2.3. Mexico Non Glutinous Rice Cracker Regional Analysis and Outlook
8.3. Europe Non Glutinous Rice Cracker Revenue (USD Million), by Country (2021-2032)
8.3.1. Germany Non Glutinous Rice Cracker Regional Analysis and Outlook
8.3.2. France Non Glutinous Rice Cracker Regional Analysis and Outlook
8.3.3. United Kingdom Non Glutinous Rice Cracker Regional Analysis and Outlook
8.3.4. Spain Non Glutinous Rice Cracker Regional Analysis and Outlook
8.3.5. Italy Non Glutinous Rice Cracker Regional Analysis and Outlook
8.3.6. Russia Non Glutinous Rice Cracker Regional Analysis and Outlook
8.3.7. Rest of Europe Non Glutinous Rice Cracker Regional Analysis and Outlook
8.4. Asia Pacific Non Glutinous Rice Cracker Revenue (USD Million) by Country (2021-2032)
8.4.1. China Non Glutinous Rice Cracker Regional Analysis and Outlook
8.4.2. Japan Non Glutinous Rice Cracker Regional Analysis and Outlook
8.4.3. India Non Glutinous Rice Cracker Regional Analysis and Outlook
8.4.4. South Korea Non Glutinous Rice Cracker Regional Analysis and Outlook
8.4.5. Australia Non Glutinous Rice Cracker Regional Analysis and Outlook
8.4.6. South East Asia Non Glutinous Rice Cracker Regional Analysis and Outlook
8.4.7. Rest of Asia Pacific Non Glutinous Rice Cracker Regional Analysis and Outlook
8.5. South America Non Glutinous Rice Cracker Revenue (USD Million), by Country (2021-2032)
8.5.1. Brazil Non Glutinous Rice Cracker Regional Analysis and Outlook
8.5.2. Argentina Non Glutinous Rice Cracker Regional Analysis and Outlook
8.5.3. Rest of South America Non Glutinous Rice Cracker Regional Analysis and Outlook
8.6. Middle East and Africa Non Glutinous Rice Cracker Revenue (USD Million) by Country (2021-2032)
8.6.1. Middle East Non Glutinous Rice Cracker Regional Analysis and Outlook
8.6.2. Africa Non Glutinous Rice Cracker Regional Analysis and Outlook
Chapter 9. North America Non Glutinous Rice Cracker Analysis and Outlook
9.1. North America Non Glutinous Rice Cracker Revenue (USD Million) by Segments (2021-2032)
9.1.1. North America Non Glutinous Rice Cracker Revenue (USD Million) by Type (2021-2032)
9.1.2. North America Non Glutinous Rice Cracker Revenue (USD Million) by Application (2021-2032)
9.1.3. North America Non Glutinous Rice Cracker Revenue (USD Million) by Product (2021-2032)
By Type
Traditional Japanese Cracker
Regional Senbei
Others
By Application
Supermarkets/Hypermarkets
Independent Retailers
Convenience Stores
Online Retailers
Others
Chapter 10. Europe Non Glutinous Rice Cracker Analysis and Outlook
10.1. Europe Non Glutinous Rice Cracker Revenue (USD Million), by Segments (USD Million) (2021-2032)
10.1.1. Europe Non Glutinous Rice Cracker Revenue (USD Million) by Type (2021-2032)
10.1.2. Europe Non Glutinous Rice Cracker Revenue (USD Million) by Application (2021-2032)
10.1.3. Europe Non Glutinous Rice Cracker Revenue (USD Million) by Product (2021-2032)
By Type
Traditional Japanese Cracker
Regional Senbei
Others
By Application
Supermarkets/Hypermarkets
Independent Retailers
Convenience Stores
Online Retailers
Others
Chapter 11. Asia Pacific Non Glutinous Rice Cracker Analysis and Outlook
11.1. Asia Pacific Non Glutinous Rice Cracker Revenue (USD Million), and Revenue (USD Million) by Segments (2021-2032)
11.1.1. Asia Pacific Non Glutinous Rice Cracker Revenue (USD Million) by Type (2021-2032)
11.1.2. Asia Pacific Non Glutinous Rice Cracker Revenue (USD Million) by Application (2021-2032)
11.1.3. Asia Pacific Non Glutinous Rice Cracker Revenue (USD Million) by Product (2021-2032)
By Type
Traditional Japanese Cracker
Regional Senbei
Others
By Application
Supermarkets/Hypermarkets
Independent Retailers
Convenience Stores
Online Retailers
Others
Chapter 12. South America Non Glutinous Rice Cracker Analysis and Outlook
12.1. South America Non Glutinous Rice Cracker Revenue (USD Million), by Segments (2021-2032)
12.1.1. South America Non Glutinous Rice Cracker Revenue (USD Million) by Type (2021-2032)
12.1.2. South America Non Glutinous Rice Cracker Revenue (USD Million) by Application (2021-2032)
12.1.3. South America Non Glutinous Rice Cracker Revenue (USD Million) by Product (2021-2032)
By Type
Traditional Japanese Cracker
Regional Senbei
Others
By Application
Supermarkets/Hypermarkets
Independent Retailers
Convenience Stores
Online Retailers
Others
Chapter 13. Middle East and Africa Non Glutinous Rice Cracker Analysis and Outlook
13.1. Middle East and Africa Non Glutinous Rice Cracker Revenue (USD Million), by Segments (2021-2032)
13.1.1. Middle East and Africa Non Glutinous Rice Cracker Revenue (USD Million) by Type (2021-2032)
13.1.2. Middle East and Africa Non Glutinous Rice Cracker Revenue (USD Million) by Application (2021-2032)
13.1.3. Middle East and Africa Non Glutinous Rice Cracker Revenue (USD Million) by Product (2021-2032)
By Type
Traditional Japanese Cracker
Regional Senbei
Others
By Application
Supermarkets/Hypermarkets
Independent Retailers
Convenience Stores
Online Retailers
Others
Chapter 14. Non Glutinous Rice Cracker Company Profiles
14.1 Business Overview
14.2 Product Profiles
14.3 SWOT Profiles
14.5 Recent Developments
14.6 Financial Profile
List of Companies
BonChi
Bourbon
COFCO
Echigoseika
Iwatsuka Confectionery
Kameda Seika
Kuriyamabeika
Miduoqi
Mochikichi
Ogurasansou
Sanko Seika
UNCLE POP
Want Want
Xiaowangzi Food
15. Methodology and Data Sources
15.1 Customization Offerings
15.2 Subscription Services
15.3 Related Reports
15.4 Publisher Expertise
LIST OF TABLES
Table 1 Market Segmentation Analysis
Table 2 Global Non Glutinous Rice Cracker Market Share of Leading Companies, 2023
Table 3 Product Offerings of Leading Companies
Table 4 Low Growth Scenario Forecasts
Table 5 Reference Case Growth Scenario
Table 6 High Growth Case Scenario
Table 7 Global Non Glutinous Rice Cracker Revenue (USD Million) And CAGR (%) By Type (2021-2032)
Table 8 Global Non Glutinous Rice Cracker Revenue (USD Million) And CAGR (%) By Application (2021-2032)
Table 9 Global Non Glutinous Rice Cracker Revenue (USD Million) And CAGR (%) By Product (2021-2032)
Table 10 Global Non Glutinous Rice Cracker Market Revenue (USD Million) By Regions (2021-2032)
Table 11 Global Non Glutinous Rice Cracker Market Share (%) By Regions (2021-2032)
Table 12 North America Non Glutinous Rice Cracker Revenue (USD Million) By Country (2021-2032)
Table 13 Europe Non Glutinous Rice Cracker Revenue (USD Million) By Country (2021-2032)
Table 14 Asia Pacific Non Glutinous Rice Cracker Revenue (USD Million) By Country (2021-2032)
Table 15 South America Non Glutinous Rice Cracker Revenue (USD Million) By Country (2021-2032)
Table 16 Middle East and Africa Non Glutinous Rice Cracker Revenue (USD Million) By Region (2021-2032)
Table 17 North America Non Glutinous Rice Cracker Revenue (USD Million) By Type (2021-2032)
Table 18 North America Non Glutinous Rice Cracker Revenue (USD Million) By Application (2021-2032)
Table 19 North America Non Glutinous Rice Cracker Revenue (USD Million) By Product (2021-2032)
Table 20 Europe Non Glutinous Rice Cracker Revenue (USD Million) By Type (2021-2032)
Table 21 Europe Non Glutinous Rice Cracker Revenue (USD Million) By Application (2021-2032)
Table 22 Europe Non Glutinous Rice Cracker Revenue (USD Million) By Product (2021-2032)
Table 23 Asia Pacific Non Glutinous Rice Cracker Revenue (USD Million) By Type (2021-2032)
Table 24 Asia Pacific Non Glutinous Rice Cracker Revenue (USD Million) By Application (2021-2032)
Table 25 Asia Pacific Non Glutinous Rice Cracker Revenue (USD Million) By Product (2021-2032)
Table 26 South America Non Glutinous Rice Cracker Revenue (USD Million) By Type (2021-2032)
Table 27 South America Non Glutinous Rice Cracker Revenue (USD Million) By Application (2021-2032)
Table 28 South America Non Glutinous Rice Cracker Revenue (USD Million) By Product (2021-2032)
Table 29 Middle East and Africa Non Glutinous Rice Cracker Revenue (USD Million) By Type (2021-2032)
Table 30 Middle East and Africa Non Glutinous Rice Cracker Revenue (USD Million) By Application (2021-2032)
Table 31 Middle East and Africa Non Glutinous Rice Cracker Revenue (USD Million) By Product (2021-2032)
LIST OF FIGURES
Figure 1. Market Scope
Figure 2. Pricing Forecasts Per Unit, 2023- 2032
Figure 3. Porter’s Five Forces
Figure 4. Global Non Glutinous Rice Cracker Market Revenue (USD Million) By Regions (2021-2032)
Figure 5. Global Non Glutinous Rice Cracker Market Share (%) By Regions (2023)
Figure 6. North America Non Glutinous Rice Cracker Revenue (USD Million) By Country (2021-2032)
Figure 7. United States Non Glutinous Rice Cracker Revenue (USD Million) By Country (2021-2032)
Figure 8. Canada Non Glutinous Rice Cracker Revenue (USD Million) By Country (2021-2032)
Figure 9. Mexico Non Glutinous Rice Cracker Revenue (USD Million) By Country (2021-2032)
Figure 10. Europe Non Glutinous Rice Cracker Revenue (USD Million) By Country (2021-2032)
Figure 11. Germany Non Glutinous Rice Cracker Revenue (USD Million) By Country (2021-2032)
Figure 12. France Non Glutinous Rice Cracker Revenue (USD Million) By Country (2021-2032)
Figure 13. United Kingdom Non Glutinous Rice Cracker Revenue (USD Million) By Country (2021-2032)
Figure 14. Spain Non Glutinous Rice Cracker Revenue (USD Million) By Country (2021-2032)
Figure 15. Italy Non Glutinous Rice Cracker Revenue (USD Million) By Country (2021-2032)
Figure 16. Russia Non Glutinous Rice Cracker Revenue (USD Million) By Country (2021-2032)
Figure 17. Rest of Europe Non Glutinous Rice Cracker Revenue (USD Million) By Country (2021-2032)
Figure 11. Asia Pacific Non Glutinous Rice Cracker Revenue (USD Million) By Country (2021-2032)
Figure 12. China Non Glutinous Rice Cracker Revenue (USD Million) By Country (2021-2032)
Figure 13. Japan Non Glutinous Rice Cracker Revenue (USD Million) By Country (2021-2032)
Figure 14. India Non Glutinous Rice Cracker Revenue (USD Million) By Country (2021-2032)
Figure 15. South Korea Non Glutinous Rice Cracker Revenue (USD Million) By Country (2021-2032)
Figure 16. Australia Non Glutinous Rice Cracker Revenue (USD Million) By Country (2021-2032)
Figure 17. South East Asia Non Glutinous Rice Cracker Revenue (USD Million) By Country (2021-2032)
Figure 18. South America Non Glutinous Rice Cracker Revenue (USD Million) By Country (2021-2032)
Figure 19. Brazil Non Glutinous Rice Cracker Revenue (USD Million) By Country (2021-2032)
Figure 20. Argentina Non Glutinous Rice Cracker Revenue (USD Million) By Country (2021-2032)
Figure 21. Rest of Asia Pacific Non Glutinous Rice Cracker Revenue (USD Million) By Country (2021-2032)
Figure 22. Middle East and Africa Non Glutinous Rice Cracker Revenue (USD Million) By Region (2021-2032)
Figure 23. Saudi Arabia Non Glutinous Rice Cracker Revenue (USD Million) By Region (2021-2032)
Figure 24. The UAE Non Glutinous Rice Cracker Revenue (USD Million) By Region (2021-2032)
Figure 25. Rest of Middle East Non Glutinous Rice Cracker Revenue (USD Million) By Region (2021-2032)
Figure 26. South Africa Non Glutinous Rice Cracker Revenue (USD Million) By Region (2021-2032)
Figure 27. Africa Non Glutinous Rice Cracker Revenue (USD Million) By Region (2021-2032)
Figure 28. North America Non Glutinous Rice Cracker Revenue (USD Million) By Type (2021-2032)
Figure 29. North America Non Glutinous Rice Cracker Revenue (USD Million) By Application (2021-2032)
Figure 30. North America Non Glutinous Rice Cracker Revenue (USD Million) By Product (2021-2032)
Figure 31. Europe Non Glutinous Rice Cracker Revenue (USD Million) By Type (2021-2032)
Figure 32. Europe Non Glutinous Rice Cracker Revenue (USD Million) By Application (2021-2032)
Figure 33. Europe Non Glutinous Rice Cracker Revenue (USD Million) By Product (2021-2032)
Figure 34. Asia Pacific Non Glutinous Rice Cracker Revenue (USD Million) By Type (2021-2032)
Figure 35. Asia Pacific Non Glutinous Rice Cracker Revenue (USD Million) By Application (2021-2032)
Figure 36. Asia Pacific Non Glutinous Rice Cracker Revenue (USD Million) By Product (2021-2032)
Figure 37. South America Non Glutinous Rice Cracker Revenue (USD Million) By Type (2021-2032)
Figure 38. South America Non Glutinous Rice Cracker Revenue (USD Million) By Application (2021-2032)
Figure 39. South America Non Glutinous Rice Cracker Revenue (USD Million) By Product (2021-2032)
Figure 40. Middle East and Africa Non Glutinous Rice Cracker Revenue (USD Million) By Type (2021-2032)
Figure 41. Middle East and Africa Non Glutinous Rice Cracker Revenue (USD Million) By Application (2021-2032)
Figure 42. Middle East and Africa Non Glutinous Rice Cracker Revenue (USD Million) By Product (2021-2032)
By Type
Traditional Japanese Cracker
Regional Senbei
Others
By Application
Supermarkets/Hypermarkets
Independent Retailers
Convenience Stores
Online Retailers
Others
Countries Analyzed
North America (US, Canada, Mexico)
Europe (Germany, UK, France, Spain, Italy, Russia, Rest of Europe)
Asia Pacific (China, India, Japan, South Korea, Australia, South East Asia, Rest of Asia)
South America (Brazil, Argentina, Rest of South America)
Middle East and Africa (Saudi Arabia, UAE, Rest of Middle East, South Africa, Egypt, Rest of Africa)
