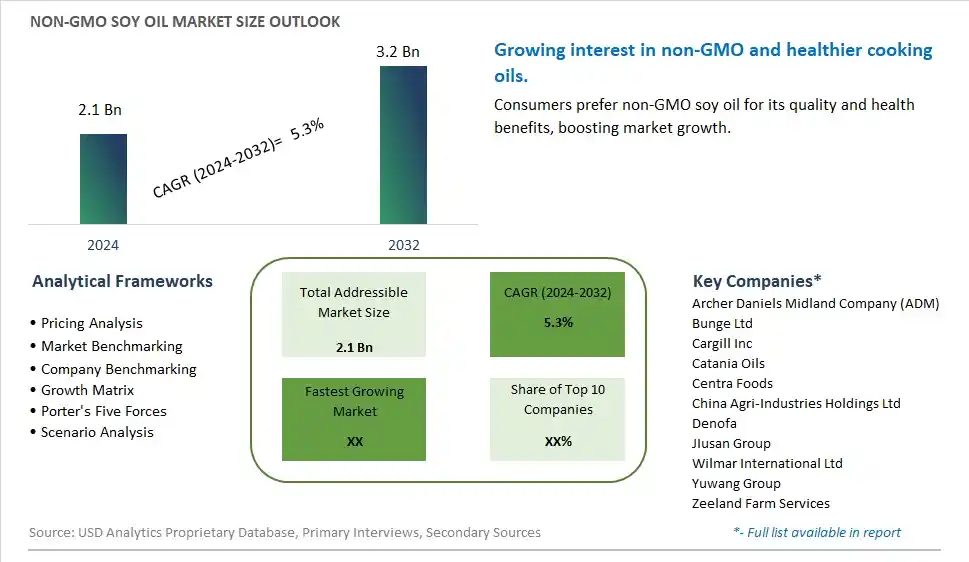
Global Non-GMO Soy Oil Market Size is valued at $2.1 Billion in 2024 and is forecast to register a growth rate (CAGR) of 5.3% to reach $3.2 Billion by 2032.
The global Non-GMO Soy Oil Market Comprehensive Study analyzes and forecasts the market size across 6 regions and 24 countries for diverse segments -By Type (Refined Oil, Blending Oil, Others), By Application (Household, Commercial, Others)
An Introduction to Non-GMO Soy Oil Market
The Non-GMO Soy Oil Market involves the production and sale of soy oil derived from non-genetically modified soybeans, catering to consumers seeking natural and sustainable cooking oils. The market is driven by increasing demand for non-GMO and organic products, rising awareness about the benefits of non-GMO ingredients, and growing applications in the food and beverage industry. Additionally, advancements in soy oil extraction technologies and the expansion of product offerings support market growth.
Non GMO Soy Oil Competitive Landscape
The market report analyses the leading companies in the industry including Archer Daniels Midland Company (ADM), Bunge Ltd, Cargill Inc, Catania Oils, Centra Foods, China Agri-Industries Holdings Ltd, Denofa, JIusan Group, Wilmar International Ltd, Yuwang Group, Zeeland Farm Services, and Others.
Non GMO Soy Oil Market Dynamics
Non-GMO Soy Oil Market Trend: Growing Preference for Non-GMO and Organic Products
The most prominent trend in the Non-GMO Soy Oil Market is the growing preference for non-GMO and organic products. Consumers are increasingly seeking non-GMO soy oil for its perceived health benefits and environmental sustainability, driven by the desire to avoid genetically modified organisms and support organic farming practices. This trend is further fueled by the increasing awareness of the potential health risks associated with GMOs and the benefits of consuming natural, unaltered foods.
Non-GMO Soy Oil Market Driver: Health Consciousness and Dietary Preferences
A key driver in the Non-GMO Soy Oil Market is health consciousness and dietary preferences. As more individuals focus on improving their diet and reducing their exposure to GMOs, there is a rising demand for non-GMO soy oil that provides a healthy and natural alternative to conventional soy oil. This demand is particularly strong among health-conscious consumers, those following organic diets, and individuals concerned about the long-term impacts of GMOs on health and the environment.
Non-GMO Soy Oil Market Opportunity: Innovation in Product Formulations and Marketing
One significant opportunity in the Non-GMO Soy Oil Market lies in innovation in product formulations and marketing. Companies can develop new non-GMO soy oil products that cater to specific health needs and culinary applications, such as high-oleic soy oil for frying and salad dressings. Effective marketing strategies that highlight the health benefits, sustainability, and purity of non-GMO soy oil can also attract a broader consumer base and drive market growth. By offering innovative and well-marketed products, manufacturers can differentiate themselves in the competitive edible oils market.
Non-GMO Soy Oil Market Share Analysis- Largest Segment by Type
In the Non-GMO Soy Oil Market, Refined Oil is the largest segment. This dominance is primarily due to the high demand for refined soy oil in various culinary and industrial applications. Refined soy oil is preferred for its neutral flavor, high smoke point, and versatility in cooking and food processing. It is widely used in both household kitchens and commercial food production due to these desirable characteristics. Additionally, refined soy oil is often utilized in processed foods and as a base for various culinary products, further solidifying its position as the largest segment in the non-GMO soy oil market.
Non-GMO Soy Oil Market Share Analysis- Fastest Growing Segment by Application
In the Non-GMO Soy Oil Market, the Commercial application segment is poised to grow the fastest over the next five years. This growth is driven by the increasing adoption of non-GMO soy oil in the foodservice industry and large-scale food production due to its health benefits and consumer demand for non-GMO products. Commercial kitchens, restaurants, and food manufacturers are increasingly opting for non-GMO ingredients to meet consumer preferences and regulatory requirements. The trend towards healthier and more transparent food options is fueling the demand for non-GMO soy oil in commercial applications, leading to rapid growth in this segment.
Non GMO Soy Oil Market Segmentation
By Type
Refined Oil
Blending Oil
Others
By Application
Household
Commercial
Others
Countries Analyzed
North America (US, Canada, Mexico)
Europe (Germany, UK, France, Spain, Italy, Russia, Rest of Europe)
Asia Pacific (China, India, Japan, South Korea, Australia, South East Asia, Rest of Asia)
South America (Brazil, Argentina, Rest of South America)
Middle East and Africa (Saudi Arabia, UAE, Rest of Middle East, South Africa, Egypt, Rest of Africa)
Non GMO Soy Oil Companies Profiled in the Study
Archer Daniels Midland Company (ADM)
Bunge Ltd
Cargill Inc
Catania Oils
Centra Foods
China Agri-Industries Holdings Ltd
Denofa
JIusan Group
Wilmar International Ltd
Yuwang Group
Zeeland Farm Services
*- List Not Exhaustive
Chapter 1. TABLE OF CONTENTS
Chapter 2. Introduction to Non GMO Soy Oil Market
2.1. Market Overview
2.2. Key Statistics and Report Highlights
2.3. Scope of the Comprehensive Study
2.3.1. Market Definition
2.3.2 Countries and Regions Covered
2.3.3 Research Objective
2.3.4 Units, Currency, and Conversions
2.3.5 Industry Value Chain
2.4. Key Market Segments
2.5. Key Companies
2.6. Study Period
Chapter 3. Strategic Analysis Review
3.1. Non GMO Soy Oil Pricing Analysis and Forecast
3.2. Porter’s Five Forces
3.3. Market Ecosystem
3.4. SWOT Analysis
3.5. Regulatory Scenario
3.3. Effects of Inflation, Russia-Ukraine War, moderating economic growth, and other macroeconomic factors
Chapter 4. Competitive Landscape
4.1. Market Share Analysis
4.1.1. Global Non GMO Soy Oil Market Share by Company, 2023
4.1.2. Product Offerings of Leading Non GMO Soy Oil Companies
4.2. Market Entropy
4.2.1. New Product Launches in the Industry
4.2.2. Mergers, Acquisitions, Joint ventures, and Partnerships
4.3. Key Strategies and Best Practices
Chapter 5. Global Market Projections: Best, Reference, and Low Case Scenarios
5.1. Growth Analysis- Case Scenario Definitions
5.2. Low Growth Case Scenario Forecasts
5.3. Reference Growth Case Scenario Forecasts
5.4. High Growth Case Scenario Forecasts
Chapter 6. Market Dynamics
6.1. Non GMO Soy Oil Market Drivers
6.2. Non GMO Soy Oil Market Challenges
6.6. Non GMO Soy Oil Market Opportunities
6.4. Non GMO Soy Oil Market Trends
Chapter 7. Global Non GMO Soy Oil Market Outlook Trends
7.1. Global Non GMO Soy Oil Revenue (USD Million) and CAGR (%) by Type (2021-2032)
7.2. Global Non GMO Soy Oil Revenue (USD Million) and CAGR (%) by Application (2021-2032)
7.3. Global Non GMO Soy Oil Revenue (USD Million) and CAGR (%) by Product (2021-2032)
By Type
Refined Oil
Blending Oil
Others
By Application
Household
Commercial
Others
Chapter 8. Global Non GMO Soy Oil Regional Analysis and Outlook
8.1. Global Non GMO Soy Oil Revenue (USD Million) By Regions (2021- 2032)
8.2. North America Non GMO Soy Oil Revenue (USD Million) by Country (2021-2032)
8.2.1. United States Non GMO Soy Oil Regional Analysis and Outlook
8.2.2. Canada Non GMO Soy Oil Regional Analysis and Outlook
8.2.3. Mexico Non GMO Soy Oil Regional Analysis and Outlook
8.3. Europe Non GMO Soy Oil Revenue (USD Million), by Country (2021-2032)
8.3.1. Germany Non GMO Soy Oil Regional Analysis and Outlook
8.3.2. France Non GMO Soy Oil Regional Analysis and Outlook
8.3.3. United Kingdom Non GMO Soy Oil Regional Analysis and Outlook
8.3.4. Spain Non GMO Soy Oil Regional Analysis and Outlook
8.3.5. Italy Non GMO Soy Oil Regional Analysis and Outlook
8.3.6. Russia Non GMO Soy Oil Regional Analysis and Outlook
8.3.7. Rest of Europe Non GMO Soy Oil Regional Analysis and Outlook
8.4. Asia Pacific Non GMO Soy Oil Revenue (USD Million) by Country (2021-2032)
8.4.1. China Non GMO Soy Oil Regional Analysis and Outlook
8.4.2. Japan Non GMO Soy Oil Regional Analysis and Outlook
8.4.3. India Non GMO Soy Oil Regional Analysis and Outlook
8.4.4. South Korea Non GMO Soy Oil Regional Analysis and Outlook
8.4.5. Australia Non GMO Soy Oil Regional Analysis and Outlook
8.4.6. South East Asia Non GMO Soy Oil Regional Analysis and Outlook
8.4.7. Rest of Asia Pacific Non GMO Soy Oil Regional Analysis and Outlook
8.5. South America Non GMO Soy Oil Revenue (USD Million), by Country (2021-2032)
8.5.1. Brazil Non GMO Soy Oil Regional Analysis and Outlook
8.5.2. Argentina Non GMO Soy Oil Regional Analysis and Outlook
8.5.3. Rest of South America Non GMO Soy Oil Regional Analysis and Outlook
8.6. Middle East and Africa Non GMO Soy Oil Revenue (USD Million) by Country (2021-2032)
8.6.1. Middle East Non GMO Soy Oil Regional Analysis and Outlook
8.6.2. Africa Non GMO Soy Oil Regional Analysis and Outlook
Chapter 9. North America Non GMO Soy Oil Analysis and Outlook
9.1. North America Non GMO Soy Oil Revenue (USD Million) by Segments (2021-2032)
9.1.1. North America Non GMO Soy Oil Revenue (USD Million) by Type (2021-2032)
9.1.2. North America Non GMO Soy Oil Revenue (USD Million) by Application (2021-2032)
9.1.3. North America Non GMO Soy Oil Revenue (USD Million) by Product (2021-2032)
By Type
Refined Oil
Blending Oil
Others
By Application
Household
Commercial
Others
Chapter 10. Europe Non GMO Soy Oil Analysis and Outlook
10.1. Europe Non GMO Soy Oil Revenue (USD Million), by Segments (USD Million) (2021-2032)
10.1.1. Europe Non GMO Soy Oil Revenue (USD Million) by Type (2021-2032)
10.1.2. Europe Non GMO Soy Oil Revenue (USD Million) by Application (2021-2032)
10.1.3. Europe Non GMO Soy Oil Revenue (USD Million) by Product (2021-2032)
By Type
Refined Oil
Blending Oil
Others
By Application
Household
Commercial
Others
Chapter 11. Asia Pacific Non GMO Soy Oil Analysis and Outlook
11.1. Asia Pacific Non GMO Soy Oil Revenue (USD Million), and Revenue (USD Million) by Segments (2021-2032)
11.1.1. Asia Pacific Non GMO Soy Oil Revenue (USD Million) by Type (2021-2032)
11.1.2. Asia Pacific Non GMO Soy Oil Revenue (USD Million) by Application (2021-2032)
11.1.3. Asia Pacific Non GMO Soy Oil Revenue (USD Million) by Product (2021-2032)
By Type
Refined Oil
Blending Oil
Others
By Application
Household
Commercial
Others
Chapter 12. South America Non GMO Soy Oil Analysis and Outlook
12.1. South America Non GMO Soy Oil Revenue (USD Million), by Segments (2021-2032)
12.1.1. South America Non GMO Soy Oil Revenue (USD Million) by Type (2021-2032)
12.1.2. South America Non GMO Soy Oil Revenue (USD Million) by Application (2021-2032)
12.1.3. South America Non GMO Soy Oil Revenue (USD Million) by Product (2021-2032)
By Type
Refined Oil
Blending Oil
Others
By Application
Household
Commercial
Others
Chapter 13. Middle East and Africa Non GMO Soy Oil Analysis and Outlook
13.1. Middle East and Africa Non GMO Soy Oil Revenue (USD Million), by Segments (2021-2032)
13.1.1. Middle East and Africa Non GMO Soy Oil Revenue (USD Million) by Type (2021-2032)
13.1.2. Middle East and Africa Non GMO Soy Oil Revenue (USD Million) by Application (2021-2032)
13.1.3. Middle East and Africa Non GMO Soy Oil Revenue (USD Million) by Product (2021-2032)
By Type
Refined Oil
Blending Oil
Others
By Application
Household
Commercial
Others
Chapter 14. Non GMO Soy Oil Company Profiles
14.1 Business Overview
14.2 Product Profiles
14.3 SWOT Profiles
14.5 Recent Developments
14.6 Financial Profile
List of Companies
Archer Daniels Midland Company (ADM)
Bunge Ltd
Cargill Inc
Catania Oils
Centra Foods
China Agri-Industries Holdings Ltd
Denofa
JIusan Group
Wilmar International Ltd
Yuwang Group
Zeeland Farm Services
15. Methodology and Data Sources
15.1 Customization Offerings
15.2 Subscription Services
15.3 Related Reports
15.4 Publisher Expertise
LIST OF TABLES
Table 1 Market Segmentation Analysis
Table 2 Global Non GMO Soy Oil Market Share of Leading Companies, 2023
Table 3 Product Offerings of Leading Companies
Table 4 Low Growth Scenario Forecasts
Table 5 Reference Case Growth Scenario
Table 6 High Growth Case Scenario
Table 7 Global Non GMO Soy Oil Revenue (USD Million) And CAGR (%) By Type (2021-2032)
Table 8 Global Non GMO Soy Oil Revenue (USD Million) And CAGR (%) By Application (2021-2032)
Table 9 Global Non GMO Soy Oil Revenue (USD Million) And CAGR (%) By Product (2021-2032)
Table 10 Global Non GMO Soy Oil Market Revenue (USD Million) By Regions (2021-2032)
Table 11 Global Non GMO Soy Oil Market Share (%) By Regions (2021-2032)
Table 12 North America Non GMO Soy Oil Revenue (USD Million) By Country (2021-2032)
Table 13 Europe Non GMO Soy Oil Revenue (USD Million) By Country (2021-2032)
Table 14 Asia Pacific Non GMO Soy Oil Revenue (USD Million) By Country (2021-2032)
Table 15 South America Non GMO Soy Oil Revenue (USD Million) By Country (2021-2032)
Table 16 Middle East and Africa Non GMO Soy Oil Revenue (USD Million) By Region (2021-2032)
Table 17 North America Non GMO Soy Oil Revenue (USD Million) By Type (2021-2032)
Table 18 North America Non GMO Soy Oil Revenue (USD Million) By Application (2021-2032)
Table 19 North America Non GMO Soy Oil Revenue (USD Million) By Product (2021-2032)
Table 20 Europe Non GMO Soy Oil Revenue (USD Million) By Type (2021-2032)
Table 21 Europe Non GMO Soy Oil Revenue (USD Million) By Application (2021-2032)
Table 22 Europe Non GMO Soy Oil Revenue (USD Million) By Product (2021-2032)
Table 23 Asia Pacific Non GMO Soy Oil Revenue (USD Million) By Type (2021-2032)
Table 24 Asia Pacific Non GMO Soy Oil Revenue (USD Million) By Application (2021-2032)
Table 25 Asia Pacific Non GMO Soy Oil Revenue (USD Million) By Product (2021-2032)
Table 26 South America Non GMO Soy Oil Revenue (USD Million) By Type (2021-2032)
Table 27 South America Non GMO Soy Oil Revenue (USD Million) By Application (2021-2032)
Table 28 South America Non GMO Soy Oil Revenue (USD Million) By Product (2021-2032)
Table 29 Middle East and Africa Non GMO Soy Oil Revenue (USD Million) By Type (2021-2032)
Table 30 Middle East and Africa Non GMO Soy Oil Revenue (USD Million) By Application (2021-2032)
Table 31 Middle East and Africa Non GMO Soy Oil Revenue (USD Million) By Product (2021-2032)
LIST OF FIGURES
Figure 1. Market Scope
Figure 2. Pricing Forecasts Per Unit, 2023- 2032
Figure 3. Porter’s Five Forces
Figure 4. Global Non GMO Soy Oil Market Revenue (USD Million) By Regions (2021-2032)
Figure 5. Global Non GMO Soy Oil Market Share (%) By Regions (2023)
Figure 6. North America Non GMO Soy Oil Revenue (USD Million) By Country (2021-2032)
Figure 7. United States Non GMO Soy Oil Revenue (USD Million) By Country (2021-2032)
Figure 8. Canada Non GMO Soy Oil Revenue (USD Million) By Country (2021-2032)
Figure 9. Mexico Non GMO Soy Oil Revenue (USD Million) By Country (2021-2032)
Figure 10. Europe Non GMO Soy Oil Revenue (USD Million) By Country (2021-2032)
Figure 11. Germany Non GMO Soy Oil Revenue (USD Million) By Country (2021-2032)
Figure 12. France Non GMO Soy Oil Revenue (USD Million) By Country (2021-2032)
Figure 13. United Kingdom Non GMO Soy Oil Revenue (USD Million) By Country (2021-2032)
Figure 14. Spain Non GMO Soy Oil Revenue (USD Million) By Country (2021-2032)
Figure 15. Italy Non GMO Soy Oil Revenue (USD Million) By Country (2021-2032)
Figure 16. Russia Non GMO Soy Oil Revenue (USD Million) By Country (2021-2032)
Figure 17. Rest of Europe Non GMO Soy Oil Revenue (USD Million) By Country (2021-2032)
Figure 11. Asia Pacific Non GMO Soy Oil Revenue (USD Million) By Country (2021-2032)
Figure 12. China Non GMO Soy Oil Revenue (USD Million) By Country (2021-2032)
Figure 13. Japan Non GMO Soy Oil Revenue (USD Million) By Country (2021-2032)
Figure 14. India Non GMO Soy Oil Revenue (USD Million) By Country (2021-2032)
Figure 15. South Korea Non GMO Soy Oil Revenue (USD Million) By Country (2021-2032)
Figure 16. Australia Non GMO Soy Oil Revenue (USD Million) By Country (2021-2032)
Figure 17. South East Asia Non GMO Soy Oil Revenue (USD Million) By Country (2021-2032)
Figure 18. South America Non GMO Soy Oil Revenue (USD Million) By Country (2021-2032)
Figure 19. Brazil Non GMO Soy Oil Revenue (USD Million) By Country (2021-2032)
Figure 20. Argentina Non GMO Soy Oil Revenue (USD Million) By Country (2021-2032)
Figure 21. Rest of Asia Pacific Non GMO Soy Oil Revenue (USD Million) By Country (2021-2032)
Figure 22. Middle East and Africa Non GMO Soy Oil Revenue (USD Million) By Region (2021-2032)
Figure 23. Saudi Arabia Non GMO Soy Oil Revenue (USD Million) By Region (2021-2032)
Figure 24. The UAE Non GMO Soy Oil Revenue (USD Million) By Region (2021-2032)
Figure 25. Rest of Middle East Non GMO Soy Oil Revenue (USD Million) By Region (2021-2032)
Figure 26. South Africa Non GMO Soy Oil Revenue (USD Million) By Region (2021-2032)
Figure 27. Africa Non GMO Soy Oil Revenue (USD Million) By Region (2021-2032)
Figure 28. North America Non GMO Soy Oil Revenue (USD Million) By Type (2021-2032)
Figure 29. North America Non GMO Soy Oil Revenue (USD Million) By Application (2021-2032)
Figure 30. North America Non GMO Soy Oil Revenue (USD Million) By Product (2021-2032)
Figure 31. Europe Non GMO Soy Oil Revenue (USD Million) By Type (2021-2032)
Figure 32. Europe Non GMO Soy Oil Revenue (USD Million) By Application (2021-2032)
Figure 33. Europe Non GMO Soy Oil Revenue (USD Million) By Product (2021-2032)
Figure 34. Asia Pacific Non GMO Soy Oil Revenue (USD Million) By Type (2021-2032)
Figure 35. Asia Pacific Non GMO Soy Oil Revenue (USD Million) By Application (2021-2032)
Figure 36. Asia Pacific Non GMO Soy Oil Revenue (USD Million) By Product (2021-2032)
Figure 37. South America Non GMO Soy Oil Revenue (USD Million) By Type (2021-2032)
Figure 38. South America Non GMO Soy Oil Revenue (USD Million) By Application (2021-2032)
Figure 39. South America Non GMO Soy Oil Revenue (USD Million) By Product (2021-2032)
Figure 40. Middle East and Africa Non GMO Soy Oil Revenue (USD Million) By Type (2021-2032)
Figure 41. Middle East and Africa Non GMO Soy Oil Revenue (USD Million) By Application (2021-2032)
Figure 42. Middle East and Africa Non GMO Soy Oil Revenue (USD Million) By Product (2021-2032)
By Type
Refined Oil
Blending Oil
Others
By Application
Household
Commercial
Others
Countries Analyzed
North America (US, Canada, Mexico)
Europe (Germany, UK, France, Spain, Italy, Russia, Rest of Europe)
Asia Pacific (China, India, Japan, South Korea, Australia, South East Asia, Rest of Asia)
South America (Brazil, Argentina, Rest of South America)
Middle East and Africa (Saudi Arabia, UAE, Rest of Middle East, South Africa, Egypt, Rest of Africa)
