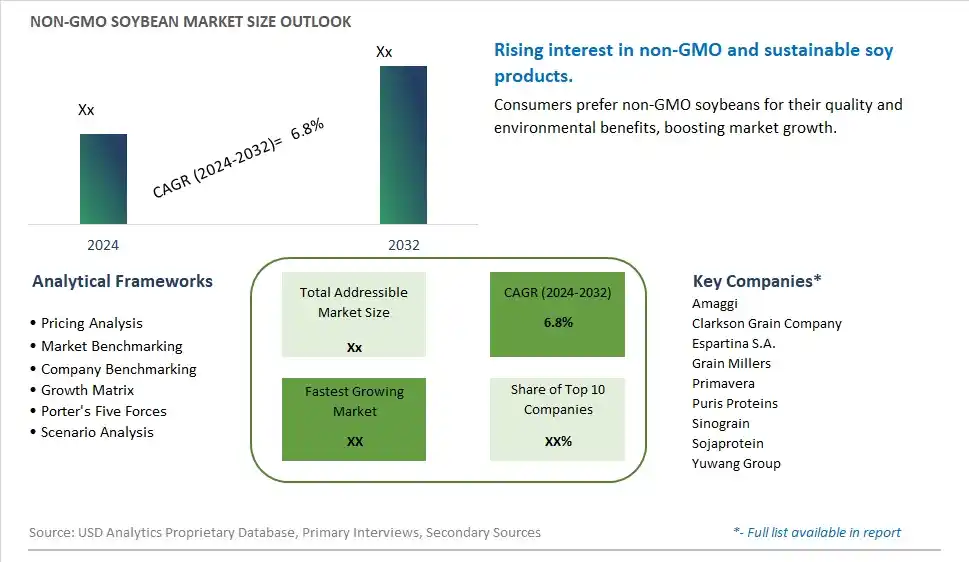
Global Non-GMO Soybean Market Size is valued at $XX Million in 2024 and is forecast to register a growth rate (CAGR) of 6.8% to reach $XX Million by 2032.
The global Non-GMO Soybean Market Comprehensive Study analyzes and forecasts the market size across 6 regions and 24 countries for diverse segments -By Type (Plain Non-GM Soybeans, RTRS-Certified Non-GM Soybeans, Organic Non-GM Soybeans), By Application (Animal Feed, Human Consumption, Others), By Form (Whole Soybeans, Soybean Meal, Soybean Oil), By Packaging (Bulk, Retail)
An Introduction to Non-GMO Soybean Market
The Non-GMO Soybean Market involves the production and sale of soybeans that have not been genetically modified, catering to consumers seeking natural and sustainable food sources. The market is driven by increasing demand for non-GMO and organic products, rising awareness about the benefits of non-GMO ingredients, and growing applications in the food and beverage industry. Additionally, advancements in soybean farming technologies and the expansion of product offerings support market growth.
Non GMO Soybean Competitive Landscape
The market report analyses the leading companies in the industry including Amaggi, Clarkson Grain Company, Espartina S.A., Grain Millers, Primavera, Puris Proteins, Sinograin, Sojaprotein, Yuwang Group, and Others.
Non GMO Soybean Market Dynamics
Non-GMO Soybean Market Trend: Growing Preference for Non-GMO and Organic Soybeans
The most prominent trend in the Non-GMO Soybean Market is the growing preference for non-GMO and organic soybeans. Consumers are increasingly seeking non-GMO soybeans for their perceived health benefits, environmental sustainability, and natural purity, driven by the desire to avoid genetically modified organisms and support organic farming practices.
Non-GMO Soybean Market Driver: Health Consciousness and Environmental Concerns
A key driver in the Non-GMO Soybean Market is health consciousness and environmental concerns. As more individuals focus on improving their diet and reducing their exposure to GMOs, there is a rising demand for non-GMO soybeans that provide a healthy and natural alternative to conventional soybeans. This demand is further fueled by the growing awareness of the environmental benefits of non-GMO and organic farming practices.
Non-GMO Soybean Market Opportunity: Innovation in Soy-Based Products
One significant opportunity in the Non-GMO Soybean Market lies in innovation in soy-based products. Companies can develop new products that utilize non-GMO soybeans, such as tofu, soy milk, edamame, and soy-based snacks, catering to health-conscious consumers and those seeking sustainable food options. By offering diverse and innovative soy-based products, manufacturers can attract a broader consumer base and drive market growth.
Non-GMO Soybean Market Share Analysis- Largest Segment by Type
In the Non-GMO Soybean Market, Plain Non-GM Soybeans represent the largest segment. This dominance is attributed to their broad applicability and established market presence. Plain non-GM soybeans are used in various traditional applications, including the production of soybean oil, tofu, and soy milk. Their wide usage and lower cost compared to certified and organic varieties make them the most prevalent type in the market. Despite the growing interest in certified and organic non-GM soybeans, the sheer volume and versatility of plain non-GM soybeans ensure they remain the largest segment in the non-GMO soybean market.
Non-GMO Soybean Market Share Analysis- Fastest Growing Segment by Application
In the Non-GMO Soybean Market, the Animal Feed application segment is expected to grow the fastest over the next five years. This growth is driven by the increasing demand for non-GMO feed in livestock and poultry production, as consumers and producers alike seek to avoid GMOs in the food supply chain. Non-GMO soybeans are valued for their high protein content and nutritional benefits, making them a preferred choice for animal feed. The rise in organic farming and sustainable agriculture practices, combined with regulatory trends favoring non-GMO products, contributes to the rapid expansion of the non-GMO soybean market for animal feed.
Non-GMO Soybean Market Share Analysis- Largest Segment by Form
In the Non-GMO Soybean Market, Soybean Meal is the largest segment. This is due to soybean meal's extensive use in animal feed and as a protein source in various food products. Soybean meal, which is derived from soybeans after oil extraction, provides a high-protein ingredient that is crucial for livestock and poultry diets. Its widespread use in the animal feed industry, coupled with its role as a key ingredient in many processed foods, ensures that soybean meal remains the dominant form in the non-GMO soybean market.
Non-GMO Soybean Market Share Analysis- Fastest Growing Segment by Packaging
In the Non-GMO Soybean Market, the Retail packaging segment is expected to grow the fastest over the next five years. This growth is driven by the increasing consumer demand for non-GMO soybeans for direct use in home cooking and personal consumption. The rise in health-conscious consumers and the growing trend of organic and non-GMO food products in retail channels contribute to this rapid growth. Retail packaging allows for convenient, smaller quantities of non-GMO soybeans that cater to individual households, making it the fastest-growing segment in the market.
Non GMO Soybean Market Segmentation
By Type
Plain Non-GM Soybeans
RTRS-Certified Non-GM Soybeans
Organic Non-GM Soybeans
By Application
Animal Feed
Human Consumption
Others
By Form
Whole Soybeans
Soybean Meal
Soybean Oil
By Packaging
Bulk
Retail
Countries Analyzed
North America (US, Canada, Mexico)
Europe (Germany, UK, France, Spain, Italy, Russia, Rest of Europe)
Asia Pacific (China, India, Japan, South Korea, Australia, South East Asia, Rest of Asia)
South America (Brazil, Argentina, Rest of South America)
Middle East and Africa (Saudi Arabia, UAE, Rest of Middle East, South Africa, Egypt, Rest of Africa)
Non GMO Soybean Companies Profiled in the Study
Amaggi
Clarkson Grain Company
Espartina S.A.
Grain Millers
Primavera
Puris Proteins
Sinograin
Sojaprotein
Yuwang Group
*- List Not Exhaustive
Chapter 1. TABLE OF CONTENTS
Chapter 2. Introduction to Non GMO Soybean Market
2.1. Market Overview
2.2. Key Statistics and Report Highlights
2.3. Scope of the Comprehensive Study
2.3.1. Market Definition
2.3.2 Countries and Regions Covered
2.3.3 Research Objective
2.3.4 Units, Currency, and Conversions
2.3.5 Industry Value Chain
2.4. Key Market Segments
2.5. Key Companies
2.6. Study Period
Chapter 3. Strategic Analysis Review
3.1. Non GMO Soybean Pricing Analysis and Forecast
3.2. Porter’s Five Forces
3.3. Market Ecosystem
3.4. SWOT Analysis
3.5. Regulatory Scenario
3.3. Effects of Inflation, Russia-Ukraine War, moderating economic growth, and other macroeconomic factors
Chapter 4. Competitive Landscape
4.1. Market Share Analysis
4.1.1. Global Non GMO Soybean Market Share by Company, 2023
4.1.2. Product Offerings of Leading Non GMO Soybean Companies
4.2. Market Entropy
4.2.1. New Product Launches in the Industry
4.2.2. Mergers, Acquisitions, Joint ventures, and Partnerships
4.3. Key Strategies and Best Practices
Chapter 5. Global Market Projections: Best, Reference, and Low Case Scenarios
5.1. Growth Analysis- Case Scenario Definitions
5.2. Low Growth Case Scenario Forecasts
5.3. Reference Growth Case Scenario Forecasts
5.4. High Growth Case Scenario Forecasts
Chapter 6. Market Dynamics
6.1. Non GMO Soybean Market Drivers
6.2. Non GMO Soybean Market Challenges
6.6. Non GMO Soybean Market Opportunities
6.4. Non GMO Soybean Market Trends
Chapter 7. Global Non GMO Soybean Market Outlook Trends
7.1. Global Non GMO Soybean Revenue (USD Million) and CAGR (%) by Type (2021-2032)
7.2. Global Non GMO Soybean Revenue (USD Million) and CAGR (%) by Application (2021-2032)
7.3. Global Non GMO Soybean Revenue (USD Million) and CAGR (%) by Product (2021-2032)
By Type
Plain Non-GM Soybeans
RTRS-Certified Non-GM Soybeans
Organic Non-GM Soybeans
By Application
Animal Feed
Human Consumption
Others
By Form
Whole Soybeans
Soybean Meal
Soybean Oil
By Packaging
Bulk
Retail
Chapter 8. Global Non GMO Soybean Regional Analysis and Outlook
8.1. Global Non GMO Soybean Revenue (USD Million) By Regions (2021- 2032)
8.2. North America Non GMO Soybean Revenue (USD Million) by Country (2021-2032)
8.2.1. United States Non GMO Soybean Regional Analysis and Outlook
8.2.2. Canada Non GMO Soybean Regional Analysis and Outlook
8.2.3. Mexico Non GMO Soybean Regional Analysis and Outlook
8.3. Europe Non GMO Soybean Revenue (USD Million), by Country (2021-2032)
8.3.1. Germany Non GMO Soybean Regional Analysis and Outlook
8.3.2. France Non GMO Soybean Regional Analysis and Outlook
8.3.3. United Kingdom Non GMO Soybean Regional Analysis and Outlook
8.3.4. Spain Non GMO Soybean Regional Analysis and Outlook
8.3.5. Italy Non GMO Soybean Regional Analysis and Outlook
8.3.6. Russia Non GMO Soybean Regional Analysis and Outlook
8.3.7. Rest of Europe Non GMO Soybean Regional Analysis and Outlook
8.4. Asia Pacific Non GMO Soybean Revenue (USD Million) by Country (2021-2032)
8.4.1. China Non GMO Soybean Regional Analysis and Outlook
8.4.2. Japan Non GMO Soybean Regional Analysis and Outlook
8.4.3. India Non GMO Soybean Regional Analysis and Outlook
8.4.4. South Korea Non GMO Soybean Regional Analysis and Outlook
8.4.5. Australia Non GMO Soybean Regional Analysis and Outlook
8.4.6. South East Asia Non GMO Soybean Regional Analysis and Outlook
8.4.7. Rest of Asia Pacific Non GMO Soybean Regional Analysis and Outlook
8.5. South America Non GMO Soybean Revenue (USD Million), by Country (2021-2032)
8.5.1. Brazil Non GMO Soybean Regional Analysis and Outlook
8.5.2. Argentina Non GMO Soybean Regional Analysis and Outlook
8.5.3. Rest of South America Non GMO Soybean Regional Analysis and Outlook
8.6. Middle East and Africa Non GMO Soybean Revenue (USD Million) by Country (2021-2032)
8.6.1. Middle East Non GMO Soybean Regional Analysis and Outlook
8.6.2. Africa Non GMO Soybean Regional Analysis and Outlook
Chapter 9. North America Non GMO Soybean Analysis and Outlook
9.1. North America Non GMO Soybean Revenue (USD Million) by Segments (2021-2032)
9.1.1. North America Non GMO Soybean Revenue (USD Million) by Type (2021-2032)
9.1.2. North America Non GMO Soybean Revenue (USD Million) by Application (2021-2032)
9.1.3. North America Non GMO Soybean Revenue (USD Million) by Product (2021-2032)
By Type
Plain Non-GM Soybeans
RTRS-Certified Non-GM Soybeans
Organic Non-GM Soybeans
By Application
Animal Feed
Human Consumption
Others
By Form
Whole Soybeans
Soybean Meal
Soybean Oil
By Packaging
Bulk
Retail
Chapter 10. Europe Non GMO Soybean Analysis and Outlook
10.1. Europe Non GMO Soybean Revenue (USD Million), by Segments (USD Million) (2021-2032)
10.1.1. Europe Non GMO Soybean Revenue (USD Million) by Type (2021-2032)
10.1.2. Europe Non GMO Soybean Revenue (USD Million) by Application (2021-2032)
10.1.3. Europe Non GMO Soybean Revenue (USD Million) by Product (2021-2032)
By Type
Plain Non-GM Soybeans
RTRS-Certified Non-GM Soybeans
Organic Non-GM Soybeans
By Application
Animal Feed
Human Consumption
Others
By Form
Whole Soybeans
Soybean Meal
Soybean Oil
By Packaging
Bulk
Retail
Chapter 11. Asia Pacific Non GMO Soybean Analysis and Outlook
11.1. Asia Pacific Non GMO Soybean Revenue (USD Million), and Revenue (USD Million) by Segments (2021-2032)
11.1.1. Asia Pacific Non GMO Soybean Revenue (USD Million) by Type (2021-2032)
11.1.2. Asia Pacific Non GMO Soybean Revenue (USD Million) by Application (2021-2032)
11.1.3. Asia Pacific Non GMO Soybean Revenue (USD Million) by Product (2021-2032)
By Type
Plain Non-GM Soybeans
RTRS-Certified Non-GM Soybeans
Organic Non-GM Soybeans
By Application
Animal Feed
Human Consumption
Others
By Form
Whole Soybeans
Soybean Meal
Soybean Oil
By Packaging
Bulk
Retail
Chapter 12. South America Non GMO Soybean Analysis and Outlook
12.1. South America Non GMO Soybean Revenue (USD Million), by Segments (2021-2032)
12.1.1. South America Non GMO Soybean Revenue (USD Million) by Type (2021-2032)
12.1.2. South America Non GMO Soybean Revenue (USD Million) by Application (2021-2032)
12.1.3. South America Non GMO Soybean Revenue (USD Million) by Product (2021-2032)
By Type
Plain Non-GM Soybeans
RTRS-Certified Non-GM Soybeans
Organic Non-GM Soybeans
By Application
Animal Feed
Human Consumption
Others
By Form
Whole Soybeans
Soybean Meal
Soybean Oil
By Packaging
Bulk
Retail
Chapter 13. Middle East and Africa Non GMO Soybean Analysis and Outlook
13.1. Middle East and Africa Non GMO Soybean Revenue (USD Million), by Segments (2021-2032)
13.1.1. Middle East and Africa Non GMO Soybean Revenue (USD Million) by Type (2021-2032)
13.1.2. Middle East and Africa Non GMO Soybean Revenue (USD Million) by Application (2021-2032)
13.1.3. Middle East and Africa Non GMO Soybean Revenue (USD Million) by Product (2021-2032)
By Type
Plain Non-GM Soybeans
RTRS-Certified Non-GM Soybeans
Organic Non-GM Soybeans
By Application
Animal Feed
Human Consumption
Others
By Form
Whole Soybeans
Soybean Meal
Soybean Oil
By Packaging
Bulk
Retail
Chapter 14. Non GMO Soybean Company Profiles
14.1 Business Overview
14.2 Product Profiles
14.3 SWOT Profiles
14.5 Recent Developments
14.6 Financial Profile
List of Companies
Amaggi
Clarkson Grain Company
Espartina S.A.
Grain Millers
Primavera
Puris Proteins
Sinograin
Sojaprotein
Yuwang Group
15. Methodology and Data Sources
15.1 Customization Offerings
15.2 Subscription Services
15.3 Related Reports
15.4 Publisher Expertise
LIST OF TABLES
Table 1 Market Segmentation Analysis
Table 2 Global Non GMO Soybean Market Share of Leading Companies, 2023
Table 3 Product Offerings of Leading Companies
Table 4 Low Growth Scenario Forecasts
Table 5 Reference Case Growth Scenario
Table 6 High Growth Case Scenario
Table 7 Global Non GMO Soybean Revenue (USD Million) And CAGR (%) By Type (2021-2032)
Table 8 Global Non GMO Soybean Revenue (USD Million) And CAGR (%) By Application (2021-2032)
Table 9 Global Non GMO Soybean Revenue (USD Million) And CAGR (%) By Product (2021-2032)
Table 10 Global Non GMO Soybean Market Revenue (USD Million) By Regions (2021-2032)
Table 11 Global Non GMO Soybean Market Share (%) By Regions (2021-2032)
Table 12 North America Non GMO Soybean Revenue (USD Million) By Country (2021-2032)
Table 13 Europe Non GMO Soybean Revenue (USD Million) By Country (2021-2032)
Table 14 Asia Pacific Non GMO Soybean Revenue (USD Million) By Country (2021-2032)
Table 15 South America Non GMO Soybean Revenue (USD Million) By Country (2021-2032)
Table 16 Middle East and Africa Non GMO Soybean Revenue (USD Million) By Region (2021-2032)
Table 17 North America Non GMO Soybean Revenue (USD Million) By Type (2021-2032)
Table 18 North America Non GMO Soybean Revenue (USD Million) By Application (2021-2032)
Table 19 North America Non GMO Soybean Revenue (USD Million) By Product (2021-2032)
Table 20 Europe Non GMO Soybean Revenue (USD Million) By Type (2021-2032)
Table 21 Europe Non GMO Soybean Revenue (USD Million) By Application (2021-2032)
Table 22 Europe Non GMO Soybean Revenue (USD Million) By Product (2021-2032)
Table 23 Asia Pacific Non GMO Soybean Revenue (USD Million) By Type (2021-2032)
Table 24 Asia Pacific Non GMO Soybean Revenue (USD Million) By Application (2021-2032)
Table 25 Asia Pacific Non GMO Soybean Revenue (USD Million) By Product (2021-2032)
Table 26 South America Non GMO Soybean Revenue (USD Million) By Type (2021-2032)
Table 27 South America Non GMO Soybean Revenue (USD Million) By Application (2021-2032)
Table 28 South America Non GMO Soybean Revenue (USD Million) By Product (2021-2032)
Table 29 Middle East and Africa Non GMO Soybean Revenue (USD Million) By Type (2021-2032)
Table 30 Middle East and Africa Non GMO Soybean Revenue (USD Million) By Application (2021-2032)
Table 31 Middle East and Africa Non GMO Soybean Revenue (USD Million) By Product (2021-2032)
LIST OF FIGURES
Figure 1. Market Scope
Figure 2. Pricing Forecasts Per Unit, 2023- 2032
Figure 3. Porter’s Five Forces
Figure 4. Global Non GMO Soybean Market Revenue (USD Million) By Regions (2021-2032)
Figure 5. Global Non GMO Soybean Market Share (%) By Regions (2023)
Figure 6. North America Non GMO Soybean Revenue (USD Million) By Country (2021-2032)
Figure 7. United States Non GMO Soybean Revenue (USD Million) By Country (2021-2032)
Figure 8. Canada Non GMO Soybean Revenue (USD Million) By Country (2021-2032)
Figure 9. Mexico Non GMO Soybean Revenue (USD Million) By Country (2021-2032)
Figure 10. Europe Non GMO Soybean Revenue (USD Million) By Country (2021-2032)
Figure 11. Germany Non GMO Soybean Revenue (USD Million) By Country (2021-2032)
Figure 12. France Non GMO Soybean Revenue (USD Million) By Country (2021-2032)
Figure 13. United Kingdom Non GMO Soybean Revenue (USD Million) By Country (2021-2032)
Figure 14. Spain Non GMO Soybean Revenue (USD Million) By Country (2021-2032)
Figure 15. Italy Non GMO Soybean Revenue (USD Million) By Country (2021-2032)
Figure 16. Russia Non GMO Soybean Revenue (USD Million) By Country (2021-2032)
Figure 17. Rest of Europe Non GMO Soybean Revenue (USD Million) By Country (2021-2032)
Figure 11. Asia Pacific Non GMO Soybean Revenue (USD Million) By Country (2021-2032)
Figure 12. China Non GMO Soybean Revenue (USD Million) By Country (2021-2032)
Figure 13. Japan Non GMO Soybean Revenue (USD Million) By Country (2021-2032)
Figure 14. India Non GMO Soybean Revenue (USD Million) By Country (2021-2032)
Figure 15. South Korea Non GMO Soybean Revenue (USD Million) By Country (2021-2032)
Figure 16. Australia Non GMO Soybean Revenue (USD Million) By Country (2021-2032)
Figure 17. South East Asia Non GMO Soybean Revenue (USD Million) By Country (2021-2032)
Figure 18. South America Non GMO Soybean Revenue (USD Million) By Country (2021-2032)
Figure 19. Brazil Non GMO Soybean Revenue (USD Million) By Country (2021-2032)
Figure 20. Argentina Non GMO Soybean Revenue (USD Million) By Country (2021-2032)
Figure 21. Rest of Asia Pacific Non GMO Soybean Revenue (USD Million) By Country (2021-2032)
Figure 22. Middle East and Africa Non GMO Soybean Revenue (USD Million) By Region (2021-2032)
Figure 23. Saudi Arabia Non GMO Soybean Revenue (USD Million) By Region (2021-2032)
Figure 24. The UAE Non GMO Soybean Revenue (USD Million) By Region (2021-2032)
Figure 25. Rest of Middle East Non GMO Soybean Revenue (USD Million) By Region (2021-2032)
Figure 26. South Africa Non GMO Soybean Revenue (USD Million) By Region (2021-2032)
Figure 27. Africa Non GMO Soybean Revenue (USD Million) By Region (2021-2032)
Figure 28. North America Non GMO Soybean Revenue (USD Million) By Type (2021-2032)
Figure 29. North America Non GMO Soybean Revenue (USD Million) By Application (2021-2032)
Figure 30. North America Non GMO Soybean Revenue (USD Million) By Product (2021-2032)
Figure 31. Europe Non GMO Soybean Revenue (USD Million) By Type (2021-2032)
Figure 32. Europe Non GMO Soybean Revenue (USD Million) By Application (2021-2032)
Figure 33. Europe Non GMO Soybean Revenue (USD Million) By Product (2021-2032)
Figure 34. Asia Pacific Non GMO Soybean Revenue (USD Million) By Type (2021-2032)
Figure 35. Asia Pacific Non GMO Soybean Revenue (USD Million) By Application (2021-2032)
Figure 36. Asia Pacific Non GMO Soybean Revenue (USD Million) By Product (2021-2032)
Figure 37. South America Non GMO Soybean Revenue (USD Million) By Type (2021-2032)
Figure 38. South America Non GMO Soybean Revenue (USD Million) By Application (2021-2032)
Figure 39. South America Non GMO Soybean Revenue (USD Million) By Product (2021-2032)
Figure 40. Middle East and Africa Non GMO Soybean Revenue (USD Million) By Type (2021-2032)
Figure 41. Middle East and Africa Non GMO Soybean Revenue (USD Million) By Application (2021-2032)
Figure 42. Middle East and Africa Non GMO Soybean Revenue (USD Million) By Product (2021-2032)
By Type
Plain Non-GM Soybeans
RTRS-Certified Non-GM Soybeans
Organic Non-GM Soybeans
By Application
Animal Feed
Human Consumption
Others
By Form
Whole Soybeans
Soybean Meal
Soybean Oil
By Packaging
Bulk
Retail
Countries Analyzed
North America (US, Canada, Mexico)
Europe (Germany, UK, France, Spain, Italy, Russia, Rest of Europe)
Asia Pacific (China, India, Japan, South Korea, Australia, South East Asia, Rest of Asia)
South America (Brazil, Argentina, Rest of South America)
Middle East and Africa (Saudi Arabia, UAE, Rest of Middle East, South Africa, Egypt, Rest of Africa)
