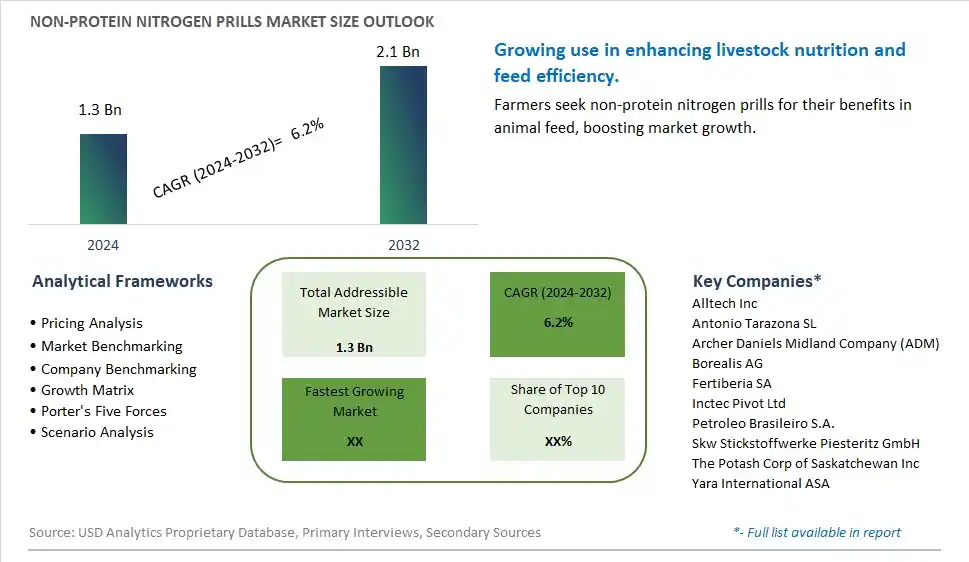
Global Non-Protein Nitrogen Prills Market Size is valued at $1.3 Billion in 2024 and is forecast to register a growth rate (CAGR) of 6.2% to reach $2.1 Billion by 2032.
The global Non-Protein Nitrogen Prills Market Comprehensive Study analyzes and forecasts the market size across 6 regions and 24 countries for diverse segments -By Type (Urea, Ammonia, Biuret), By Application (Dairy cattle, Beef cattle, Sheep and goat, Others)
An Introduction to Non-Protein Nitrogen Prills Market
The Non-Protein Nitrogen (NPN) Prills Market involves the production and sale of NPN prills used as a feed additive for ruminant animals to enhance protein synthesis and improve nutrition. The market is driven by increasing demand for high-quality animal feed, rising awareness about the benefits of NPN for livestock nutrition, and growing applications in animal husbandry. Additionally, advancements in feed additive technologies and the expansion of product offerings support market growth.
Non Protein Nitrogen Prills Competitive Landscape
The market report analyses the leading companies in the industry including Alltech Inc, Antonio Tarazona SL, Archer Daniels Midland Company (ADM), Borealis AG, Fertiberia SA, Inctec Pivot Ltd, Petroleo Brasileiro S.A., Skw Stickstoffwerke Piesteritz GmbH, The Potash Corp of Saskatchewan Inc, Yara International ASA, and Others.
Non Protein Nitrogen Prills Market Dynamics
Non-Protein Nitrogen Prills Market Trend: Increasing Use in Livestock Feed and Fertilizers
The most prominent trend in the Non-Protein Nitrogen Prills Market is the increasing use in livestock feed and fertilizers. Non-protein nitrogen prills, known for their ability to provide a concentrated source of nitrogen, are becoming popular additives in animal feed and agricultural fertilizers, driven by the need for efficient and cost-effective nutrient sources.
Non-Protein Nitrogen Prills Market Driver: Agricultural Efficiency and Livestock Nutrition
A key driver in the Non-Protein Nitrogen Prills Market is the focus on agricultural efficiency and livestock nutrition. As farmers and livestock producers seek to optimize their operations and improve animal health, there is a rising demand for non-protein nitrogen prills that provide essential nutrients and support growth. This demand is further fueled by the need to increase crop yields and enhance soil fertility.
Non-Protein Nitrogen Prills Market Opportunity: Innovation in Formulations and Applications
One significant opportunity in the Non-Protein Nitrogen Prills Market lies in innovation in formulations and applications. Companies can develop new non-protein nitrogen prill products that offer enhanced stability, solubility, and nutrient delivery, catering to the specific needs of agricultural and livestock operations. By offering innovative and effective nutrient solutions, manufacturers can attract a broader customer base and drive market growth.
Non-Protein Nitrogen Prills Market Share Analysis- Largest Segment by Type
In the Non-Protein Nitrogen Prills Market, Urea is the largest segment. Urea's dominance is primarily due to its high nitrogen content and its widespread use as a nitrogen fertilizer in agriculture. Urea provides a concentrated source of nitrogen, which is essential for plant growth, making it a preferred choice for farmers aiming to enhance crop yields. Its cost-effectiveness and efficiency in delivering nitrogen make it the most widely used form of non-protein nitrogen prills. Additionally, urea’s versatility in application across various crops and its role in soil fertility management solidify its position as the largest segment in the market.
Non-Protein Nitrogen Prills Market Share Analysis- Fastest Growing Segment by Application
In the Non-Protein Nitrogen Prills Market, the Dairy Cattle application segment is poised to grow the fastest over the next five years. This growth is driven by the increasing demand for high-quality milk and dairy products, which necessitates improved feed efficiency and nutritional strategies. Non-protein nitrogen prills, such as urea, are used to enhance the protein content of dairy feed, thereby improving milk production and overall herd health. The rise in dairy consumption and the push for higher milk yields are encouraging the adoption of non-protein nitrogen prills in dairy cattle feed. This segment's growth is further supported by advancements in animal nutrition and a focus on optimizing feed formulations to boost dairy productivity.
Non Protein Nitrogen Prills Market Segmentation
By Type
Urea
Ammonia
Biuret
By Application
Dairy cattle
Beef cattle
Sheep and goat
Others
Countries Analyzed
North America (US, Canada, Mexico)
Europe (Germany, UK, France, Spain, Italy, Russia, Rest of Europe)
Asia Pacific (China, India, Japan, South Korea, Australia, South East Asia, Rest of Asia)
South America (Brazil, Argentina, Rest of South America)
Middle East and Africa (Saudi Arabia, UAE, Rest of Middle East, South Africa, Egypt, Rest of Africa)
Non Protein Nitrogen Prills Companies Profiled in the Study
Alltech Inc
Antonio Tarazona SL
Archer Daniels Midland Company (ADM)
Borealis AG
Fertiberia SA
Inctec Pivot Ltd
Petroleo Brasileiro S.A.
Skw Stickstoffwerke Piesteritz GmbH
The Potash Corp of Saskatchewan Inc
Yara International ASA
*- List Not Exhaustive
Chapter 1. TABLE OF CONTENTS
Chapter 2. Introduction to Non Protein Nitrogen Prills Market
2.1. Market Overview
2.2. Key Statistics and Report Highlights
2.3. Scope of the Comprehensive Study
2.3.1. Market Definition
2.3.2 Countries and Regions Covered
2.3.3 Research Objective
2.3.4 Units, Currency, and Conversions
2.3.5 Industry Value Chain
2.4. Key Market Segments
2.5. Key Companies
2.6. Study Period
Chapter 3. Strategic Analysis Review
3.1. Non Protein Nitrogen Prills Pricing Analysis and Forecast
3.2. Porter’s Five Forces
3.3. Market Ecosystem
3.4. SWOT Analysis
3.5. Regulatory Scenario
3.3. Effects of Inflation, Russia-Ukraine War, moderating economic growth, and other macroeconomic factors
Chapter 4. Competitive Landscape
4.1. Market Share Analysis
4.1.1. Global Non Protein Nitrogen Prills Market Share by Company, 2023
4.1.2. Product Offerings of Leading Non Protein Nitrogen Prills Companies
4.2. Market Entropy
4.2.1. New Product Launches in the Industry
4.2.2. Mergers, Acquisitions, Joint ventures, and Partnerships
4.3. Key Strategies and Best Practices
Chapter 5. Global Market Projections: Best, Reference, and Low Case Scenarios
5.1. Growth Analysis- Case Scenario Definitions
5.2. Low Growth Case Scenario Forecasts
5.3. Reference Growth Case Scenario Forecasts
5.4. High Growth Case Scenario Forecasts
Chapter 6. Market Dynamics
6.1. Non Protein Nitrogen Prills Market Drivers
6.2. Non Protein Nitrogen Prills Market Challenges
6.6. Non Protein Nitrogen Prills Market Opportunities
6.4. Non Protein Nitrogen Prills Market Trends
Chapter 7. Global Non Protein Nitrogen Prills Market Outlook Trends
7.1. Global Non Protein Nitrogen Prills Revenue (USD Million) and CAGR (%) by Type (2021-2032)
7.2. Global Non Protein Nitrogen Prills Revenue (USD Million) and CAGR (%) by Application (2021-2032)
7.3. Global Non Protein Nitrogen Prills Revenue (USD Million) and CAGR (%) by Product (2021-2032)
By Type
Urea
Ammonia
Biuret
By Application
Dairy cattle
Beef cattle
Sheep and goat
Others
Chapter 8. Global Non Protein Nitrogen Prills Regional Analysis and Outlook
8.1. Global Non Protein Nitrogen Prills Revenue (USD Million) By Regions (2021- 2032)
8.2. North America Non Protein Nitrogen Prills Revenue (USD Million) by Country (2021-2032)
8.2.1. United States Non Protein Nitrogen Prills Regional Analysis and Outlook
8.2.2. Canada Non Protein Nitrogen Prills Regional Analysis and Outlook
8.2.3. Mexico Non Protein Nitrogen Prills Regional Analysis and Outlook
8.3. Europe Non Protein Nitrogen Prills Revenue (USD Million), by Country (2021-2032)
8.3.1. Germany Non Protein Nitrogen Prills Regional Analysis and Outlook
8.3.2. France Non Protein Nitrogen Prills Regional Analysis and Outlook
8.3.3. United Kingdom Non Protein Nitrogen Prills Regional Analysis and Outlook
8.3.4. Spain Non Protein Nitrogen Prills Regional Analysis and Outlook
8.3.5. Italy Non Protein Nitrogen Prills Regional Analysis and Outlook
8.3.6. Russia Non Protein Nitrogen Prills Regional Analysis and Outlook
8.3.7. Rest of Europe Non Protein Nitrogen Prills Regional Analysis and Outlook
8.4. Asia Pacific Non Protein Nitrogen Prills Revenue (USD Million) by Country (2021-2032)
8.4.1. China Non Protein Nitrogen Prills Regional Analysis and Outlook
8.4.2. Japan Non Protein Nitrogen Prills Regional Analysis and Outlook
8.4.3. India Non Protein Nitrogen Prills Regional Analysis and Outlook
8.4.4. South Korea Non Protein Nitrogen Prills Regional Analysis and Outlook
8.4.5. Australia Non Protein Nitrogen Prills Regional Analysis and Outlook
8.4.6. South East Asia Non Protein Nitrogen Prills Regional Analysis and Outlook
8.4.7. Rest of Asia Pacific Non Protein Nitrogen Prills Regional Analysis and Outlook
8.5. South America Non Protein Nitrogen Prills Revenue (USD Million), by Country (2021-2032)
8.5.1. Brazil Non Protein Nitrogen Prills Regional Analysis and Outlook
8.5.2. Argentina Non Protein Nitrogen Prills Regional Analysis and Outlook
8.5.3. Rest of South America Non Protein Nitrogen Prills Regional Analysis and Outlook
8.6. Middle East and Africa Non Protein Nitrogen Prills Revenue (USD Million) by Country (2021-2032)
8.6.1. Middle East Non Protein Nitrogen Prills Regional Analysis and Outlook
8.6.2. Africa Non Protein Nitrogen Prills Regional Analysis and Outlook
Chapter 9. North America Non Protein Nitrogen Prills Analysis and Outlook
9.1. North America Non Protein Nitrogen Prills Revenue (USD Million) by Segments (2021-2032)
9.1.1. North America Non Protein Nitrogen Prills Revenue (USD Million) by Type (2021-2032)
9.1.2. North America Non Protein Nitrogen Prills Revenue (USD Million) by Application (2021-2032)
9.1.3. North America Non Protein Nitrogen Prills Revenue (USD Million) by Product (2021-2032)
By Type
Urea
Ammonia
Biuret
By Application
Dairy cattle
Beef cattle
Sheep and goat
Others
Chapter 10. Europe Non Protein Nitrogen Prills Analysis and Outlook
10.1. Europe Non Protein Nitrogen Prills Revenue (USD Million), by Segments (USD Million) (2021-2032)
10.1.1. Europe Non Protein Nitrogen Prills Revenue (USD Million) by Type (2021-2032)
10.1.2. Europe Non Protein Nitrogen Prills Revenue (USD Million) by Application (2021-2032)
10.1.3. Europe Non Protein Nitrogen Prills Revenue (USD Million) by Product (2021-2032)
By Type
Urea
Ammonia
Biuret
By Application
Dairy cattle
Beef cattle
Sheep and goat
Others
Chapter 11. Asia Pacific Non Protein Nitrogen Prills Analysis and Outlook
11.1. Asia Pacific Non Protein Nitrogen Prills Revenue (USD Million), and Revenue (USD Million) by Segments (2021-2032)
11.1.1. Asia Pacific Non Protein Nitrogen Prills Revenue (USD Million) by Type (2021-2032)
11.1.2. Asia Pacific Non Protein Nitrogen Prills Revenue (USD Million) by Application (2021-2032)
11.1.3. Asia Pacific Non Protein Nitrogen Prills Revenue (USD Million) by Product (2021-2032)
By Type
Urea
Ammonia
Biuret
By Application
Dairy cattle
Beef cattle
Sheep and goat
Others
Chapter 12. South America Non Protein Nitrogen Prills Analysis and Outlook
12.1. South America Non Protein Nitrogen Prills Revenue (USD Million), by Segments (2021-2032)
12.1.1. South America Non Protein Nitrogen Prills Revenue (USD Million) by Type (2021-2032)
12.1.2. South America Non Protein Nitrogen Prills Revenue (USD Million) by Application (2021-2032)
12.1.3. South America Non Protein Nitrogen Prills Revenue (USD Million) by Product (2021-2032)
By Type
Urea
Ammonia
Biuret
By Application
Dairy cattle
Beef cattle
Sheep and goat
Others
Chapter 13. Middle East and Africa Non Protein Nitrogen Prills Analysis and Outlook
13.1. Middle East and Africa Non Protein Nitrogen Prills Revenue (USD Million), by Segments (2021-2032)
13.1.1. Middle East and Africa Non Protein Nitrogen Prills Revenue (USD Million) by Type (2021-2032)
13.1.2. Middle East and Africa Non Protein Nitrogen Prills Revenue (USD Million) by Application (2021-2032)
13.1.3. Middle East and Africa Non Protein Nitrogen Prills Revenue (USD Million) by Product (2021-2032)
By Type
Urea
Ammonia
Biuret
By Application
Dairy cattle
Beef cattle
Sheep and goat
Others
Chapter 14. Non Protein Nitrogen Prills Company Profiles
14.1 Business Overview
14.2 Product Profiles
14.3 SWOT Profiles
14.5 Recent Developments
14.6 Financial Profile
List of Companies
Alltech Inc
Antonio Tarazona SL
Archer Daniels Midland Company (ADM)
Borealis AG
Fertiberia SA
Inctec Pivot Ltd
Petroleo Brasileiro S.A.
Skw Stickstoffwerke Piesteritz GmbH
The Potash Corp of Saskatchewan Inc
Yara International ASA
15. Methodology and Data Sources
15.1 Customization Offerings
15.2 Subscription Services
15.3 Related Reports
15.4 Publisher Expertise
LIST OF TABLES
Table 1 Market Segmentation Analysis
Table 2 Global Non Protein Nitrogen Prills Market Share of Leading Companies, 2023
Table 3 Product Offerings of Leading Companies
Table 4 Low Growth Scenario Forecasts
Table 5 Reference Case Growth Scenario
Table 6 High Growth Case Scenario
Table 7 Global Non Protein Nitrogen Prills Revenue (USD Million) And CAGR (%) By Type (2021-2032)
Table 8 Global Non Protein Nitrogen Prills Revenue (USD Million) And CAGR (%) By Application (2021-2032)
Table 9 Global Non Protein Nitrogen Prills Revenue (USD Million) And CAGR (%) By Product (2021-2032)
Table 10 Global Non Protein Nitrogen Prills Market Revenue (USD Million) By Regions (2021-2032)
Table 11 Global Non Protein Nitrogen Prills Market Share (%) By Regions (2021-2032)
Table 12 North America Non Protein Nitrogen Prills Revenue (USD Million) By Country (2021-2032)
Table 13 Europe Non Protein Nitrogen Prills Revenue (USD Million) By Country (2021-2032)
Table 14 Asia Pacific Non Protein Nitrogen Prills Revenue (USD Million) By Country (2021-2032)
Table 15 South America Non Protein Nitrogen Prills Revenue (USD Million) By Country (2021-2032)
Table 16 Middle East and Africa Non Protein Nitrogen Prills Revenue (USD Million) By Region (2021-2032)
Table 17 North America Non Protein Nitrogen Prills Revenue (USD Million) By Type (2021-2032)
Table 18 North America Non Protein Nitrogen Prills Revenue (USD Million) By Application (2021-2032)
Table 19 North America Non Protein Nitrogen Prills Revenue (USD Million) By Product (2021-2032)
Table 20 Europe Non Protein Nitrogen Prills Revenue (USD Million) By Type (2021-2032)
Table 21 Europe Non Protein Nitrogen Prills Revenue (USD Million) By Application (2021-2032)
Table 22 Europe Non Protein Nitrogen Prills Revenue (USD Million) By Product (2021-2032)
Table 23 Asia Pacific Non Protein Nitrogen Prills Revenue (USD Million) By Type (2021-2032)
Table 24 Asia Pacific Non Protein Nitrogen Prills Revenue (USD Million) By Application (2021-2032)
Table 25 Asia Pacific Non Protein Nitrogen Prills Revenue (USD Million) By Product (2021-2032)
Table 26 South America Non Protein Nitrogen Prills Revenue (USD Million) By Type (2021-2032)
Table 27 South America Non Protein Nitrogen Prills Revenue (USD Million) By Application (2021-2032)
Table 28 South America Non Protein Nitrogen Prills Revenue (USD Million) By Product (2021-2032)
Table 29 Middle East and Africa Non Protein Nitrogen Prills Revenue (USD Million) By Type (2021-2032)
Table 30 Middle East and Africa Non Protein Nitrogen Prills Revenue (USD Million) By Application (2021-2032)
Table 31 Middle East and Africa Non Protein Nitrogen Prills Revenue (USD Million) By Product (2021-2032)
LIST OF FIGURES
Figure 1. Market Scope
Figure 2. Pricing Forecasts Per Unit, 2023- 2032
Figure 3. Porter’s Five Forces
Figure 4. Global Non Protein Nitrogen Prills Market Revenue (USD Million) By Regions (2021-2032)
Figure 5. Global Non Protein Nitrogen Prills Market Share (%) By Regions (2023)
Figure 6. North America Non Protein Nitrogen Prills Revenue (USD Million) By Country (2021-2032)
Figure 7. United States Non Protein Nitrogen Prills Revenue (USD Million) By Country (2021-2032)
Figure 8. Canada Non Protein Nitrogen Prills Revenue (USD Million) By Country (2021-2032)
Figure 9. Mexico Non Protein Nitrogen Prills Revenue (USD Million) By Country (2021-2032)
Figure 10. Europe Non Protein Nitrogen Prills Revenue (USD Million) By Country (2021-2032)
Figure 11. Germany Non Protein Nitrogen Prills Revenue (USD Million) By Country (2021-2032)
Figure 12. France Non Protein Nitrogen Prills Revenue (USD Million) By Country (2021-2032)
Figure 13. United Kingdom Non Protein Nitrogen Prills Revenue (USD Million) By Country (2021-2032)
Figure 14. Spain Non Protein Nitrogen Prills Revenue (USD Million) By Country (2021-2032)
Figure 15. Italy Non Protein Nitrogen Prills Revenue (USD Million) By Country (2021-2032)
Figure 16. Russia Non Protein Nitrogen Prills Revenue (USD Million) By Country (2021-2032)
Figure 17. Rest of Europe Non Protein Nitrogen Prills Revenue (USD Million) By Country (2021-2032)
Figure 11. Asia Pacific Non Protein Nitrogen Prills Revenue (USD Million) By Country (2021-2032)
Figure 12. China Non Protein Nitrogen Prills Revenue (USD Million) By Country (2021-2032)
Figure 13. Japan Non Protein Nitrogen Prills Revenue (USD Million) By Country (2021-2032)
Figure 14. India Non Protein Nitrogen Prills Revenue (USD Million) By Country (2021-2032)
Figure 15. South Korea Non Protein Nitrogen Prills Revenue (USD Million) By Country (2021-2032)
Figure 16. Australia Non Protein Nitrogen Prills Revenue (USD Million) By Country (2021-2032)
Figure 17. South East Asia Non Protein Nitrogen Prills Revenue (USD Million) By Country (2021-2032)
Figure 18. South America Non Protein Nitrogen Prills Revenue (USD Million) By Country (2021-2032)
Figure 19. Brazil Non Protein Nitrogen Prills Revenue (USD Million) By Country (2021-2032)
Figure 20. Argentina Non Protein Nitrogen Prills Revenue (USD Million) By Country (2021-2032)
Figure 21. Rest of Asia Pacific Non Protein Nitrogen Prills Revenue (USD Million) By Country (2021-2032)
Figure 22. Middle East and Africa Non Protein Nitrogen Prills Revenue (USD Million) By Region (2021-2032)
Figure 23. Saudi Arabia Non Protein Nitrogen Prills Revenue (USD Million) By Region (2021-2032)
Figure 24. The UAE Non Protein Nitrogen Prills Revenue (USD Million) By Region (2021-2032)
Figure 25. Rest of Middle East Non Protein Nitrogen Prills Revenue (USD Million) By Region (2021-2032)
Figure 26. South Africa Non Protein Nitrogen Prills Revenue (USD Million) By Region (2021-2032)
Figure 27. Africa Non Protein Nitrogen Prills Revenue (USD Million) By Region (2021-2032)
Figure 28. North America Non Protein Nitrogen Prills Revenue (USD Million) By Type (2021-2032)
Figure 29. North America Non Protein Nitrogen Prills Revenue (USD Million) By Application (2021-2032)
Figure 30. North America Non Protein Nitrogen Prills Revenue (USD Million) By Product (2021-2032)
Figure 31. Europe Non Protein Nitrogen Prills Revenue (USD Million) By Type (2021-2032)
Figure 32. Europe Non Protein Nitrogen Prills Revenue (USD Million) By Application (2021-2032)
Figure 33. Europe Non Protein Nitrogen Prills Revenue (USD Million) By Product (2021-2032)
Figure 34. Asia Pacific Non Protein Nitrogen Prills Revenue (USD Million) By Type (2021-2032)
Figure 35. Asia Pacific Non Protein Nitrogen Prills Revenue (USD Million) By Application (2021-2032)
Figure 36. Asia Pacific Non Protein Nitrogen Prills Revenue (USD Million) By Product (2021-2032)
Figure 37. South America Non Protein Nitrogen Prills Revenue (USD Million) By Type (2021-2032)
Figure 38. South America Non Protein Nitrogen Prills Revenue (USD Million) By Application (2021-2032)
Figure 39. South America Non Protein Nitrogen Prills Revenue (USD Million) By Product (2021-2032)
Figure 40. Middle East and Africa Non Protein Nitrogen Prills Revenue (USD Million) By Type (2021-2032)
Figure 41. Middle East and Africa Non Protein Nitrogen Prills Revenue (USD Million) By Application (2021-2032)
Figure 42. Middle East and Africa Non Protein Nitrogen Prills Revenue (USD Million) By Product (2021-2032)
By Type
Urea
Ammonia
Biuret
By Application
Dairy cattle
Beef cattle
Sheep and goat
Others
Countries Analyzed
North America (US, Canada, Mexico)
Europe (Germany, UK, France, Spain, Italy, Russia, Rest of Europe)
Asia Pacific (China, India, Japan, South Korea, Australia, South East Asia, Rest of Asia)
South America (Brazil, Argentina, Rest of South America)
Middle East and Africa (Saudi Arabia, UAE, Rest of Middle East, South Africa, Egypt, Rest of Africa)
