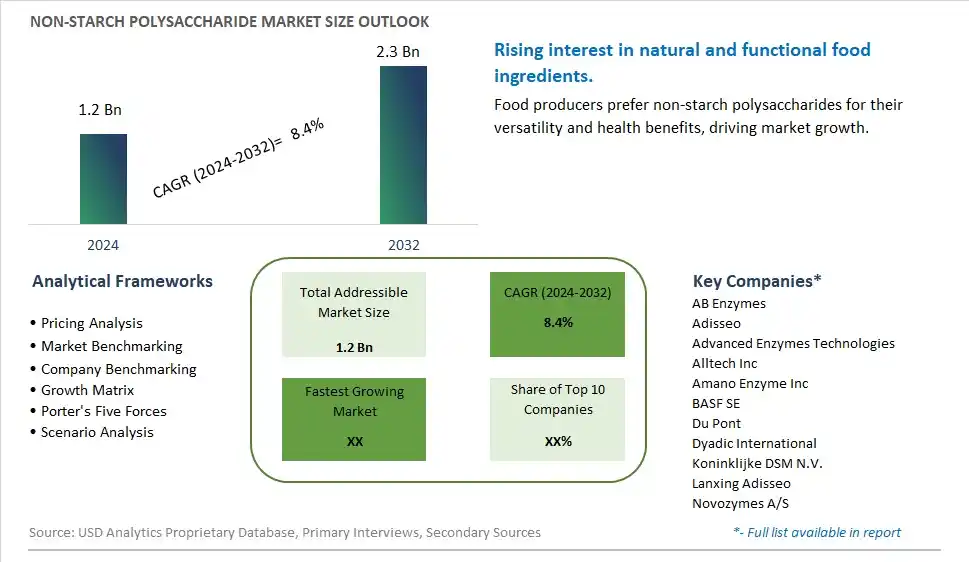
Global Non-starch Polysaccharide Market Size is valued at $1.2 Billion in 2024 and is forecast to register a growth rate (CAGR) of 8.4% to reach $2.3 Billion by 2032.
The global Non-starch Polysaccharide Market Comprehensive Study analyzes and forecasts the market size across 6 regions and 24 countries for diverse segments -By Type (Cellulose, Others), By Application (Food Additives, Chemical Materials, Others)
An Introduction to Non-starch Polysaccharide Market
The Non-Starch Polysaccharide (NSP) Market focuses on the production and sale of NSPs used as dietary fibers in food, pharmaceuticals, and animal feed. These polysaccharides provide various health benefits, including improved digestion and reduced cholesterol levels. The market is driven by increasing demand for dietary fibers, rising awareness about the health benefits of NSPs, and growing applications in the food and beverage industry. Additionally, advancements in polysaccharide extraction technologies and the expansion of product applications support market growth.
Non starch Polysaccharide Competitive Landscape
The market report analyses the leading companies in the industry including AB Enzymes, Adisseo, Advanced Enzymes Technologies, Alltech Inc, Amano Enzyme Inc, BASF SE, Du Pont, Dyadic International, Koninklijke DSM N.V., Lanxing Adisseo, Novozymes A/S, and Others.
Non starch Polysaccharide Market Dynamics
Non-Starch Polysaccharide Market Trend: Growing Use in Functional Foods and Dietary Supplements
The most prominent trend in the Non-Starch Polysaccharide Market is the growing use in functional foods and dietary supplements. Non-starch polysaccharides, known for their health benefits such as improving gut health and supporting weight management, are increasingly incorporated into a variety of food products and supplements. This trend is driven by the demand for ingredients that offer multiple health benefits and enhance the nutritional profile of consumer products.
Non-Starch Polysaccharide Market Driver: Health Consciousness and Demand for Dietary Fiber
A key driver in the Non-Starch Polysaccharide Market is health consciousness and the demand for dietary fiber. As more individuals focus on improving their digestive health and overall well-being, there is a rising demand for non-starch polysaccharides that provide a rich source of dietary fiber. This demand supports the growth of the market as consumers seek to include more fiber-rich foods and supplements in their diets.
Non-Starch Polysaccharide Market Opportunity: Innovation in Food Formulations and Health Products
One significant opportunity in the Non-Starch Polysaccharide Market lies in innovation in food formulations and health products. Companies can develop new products that incorporate non-starch polysaccharides into functional foods, beverages, and dietary supplements, offering consumers convenient and effective ways to enhance their fiber intake. By highlighting the health benefits and versatility of non-starch polysaccharides, manufacturers can attract a broader consumer base and drive market growth.
Non-Starch Polysaccharide Market Share Analysis- Largest Segment by Type
In the Non-Starch Polysaccharide Market, Cellulose is the largest segment. Cellulose's dominance is due to its widespread use in various industries, including food and beverages, pharmaceuticals, and chemical manufacturing. In the food industry, cellulose is valued for its role as a dietary fiber, texturizer, and stabilizer. It is commonly used in products such as baked goods, sauces, and processed meats. Additionally, cellulose's utility in pharmaceutical applications, such as excipients and binding agents, contributes to its prominence. Its versatility, abundant availability, and established applications across multiple sectors make cellulose the largest segment in the non-starch polysaccharide market.
Non-Starch Polysaccharide Market Share Analysis- Fastest Growing Segment by Application
In the Non-Starch Polysaccharide Market, the Food Additives application segment is expected to grow the fastest over the next five years. This rapid growth is driven by the increasing demand for functional and health-oriented food products. Non-starch polysaccharides, such as cellulose and guar gum, are utilized as thickeners, stabilizers, and dietary fibers in a wide range of food products. As consumers seek cleaner labels and functional ingredients that enhance texture and shelf life, the demand for these polysaccharides as food additives is rising. Additionally, the trend towards gluten-free and low-calorie foods, which often rely on non-starch polysaccharides for texture and mouthfeel, is further fueling growth in this segment.
Non starch Polysaccharide Market Segmentation
By Type
Cellulose
Others
By Application
Food Additives
Chemical Materials
Others
Countries Analyzed
North America (US, Canada, Mexico)
Europe (Germany, UK, France, Spain, Italy, Russia, Rest of Europe)
Asia Pacific (China, India, Japan, South Korea, Australia, South East Asia, Rest of Asia)
South America (Brazil, Argentina, Rest of South America)
Middle East and Africa (Saudi Arabia, UAE, Rest of Middle East, South Africa, Egypt, Rest of Africa)
Non starch Polysaccharide Companies Profiled in the Study
AB Enzymes
Adisseo
Advanced Enzymes Technologies
Alltech Inc
Amano Enzyme Inc
BASF SE
Du Pont
Dyadic International
Koninklijke DSM N.V.
Lanxing Adisseo
Novozymes A/S
*- List Not Exhaustive
Chapter 1. TABLE OF CONTENTS
Chapter 2. Introduction to Non starch Polysaccharide Market
2.1. Market Overview
2.2. Key Statistics and Report Highlights
2.3. Scope of the Comprehensive Study
2.3.1. Market Definition
2.3.2 Countries and Regions Covered
2.3.3 Research Objective
2.3.4 Units, Currency, and Conversions
2.3.5 Industry Value Chain
2.4. Key Market Segments
2.5. Key Companies
2.6. Study Period
Chapter 3. Strategic Analysis Review
3.1. Non starch Polysaccharide Pricing Analysis and Forecast
3.2. Porter’s Five Forces
3.3. Market Ecosystem
3.4. SWOT Analysis
3.5. Regulatory Scenario
3.3. Effects of Inflation, Russia-Ukraine War, moderating economic growth, and other macroeconomic factors
Chapter 4. Competitive Landscape
4.1. Market Share Analysis
4.1.1. Global Non starch Polysaccharide Market Share by Company, 2023
4.1.2. Product Offerings of Leading Non starch Polysaccharide Companies
4.2. Market Entropy
4.2.1. New Product Launches in the Industry
4.2.2. Mergers, Acquisitions, Joint ventures, and Partnerships
4.3. Key Strategies and Best Practices
Chapter 5. Global Market Projections: Best, Reference, and Low Case Scenarios
5.1. Growth Analysis- Case Scenario Definitions
5.2. Low Growth Case Scenario Forecasts
5.3. Reference Growth Case Scenario Forecasts
5.4. High Growth Case Scenario Forecasts
Chapter 6. Market Dynamics
6.1. Non starch Polysaccharide Market Drivers
6.2. Non starch Polysaccharide Market Challenges
6.6. Non starch Polysaccharide Market Opportunities
6.4. Non starch Polysaccharide Market Trends
Chapter 7. Global Non starch Polysaccharide Market Outlook Trends
7.1. Global Non starch Polysaccharide Revenue (USD Million) and CAGR (%) by Type (2021-2032)
7.2. Global Non starch Polysaccharide Revenue (USD Million) and CAGR (%) by Application (2021-2032)
7.3. Global Non starch Polysaccharide Revenue (USD Million) and CAGR (%) by Product (2021-2032)
By Type
Cellulose
Others
By Application
Food Additives
Chemical Materials
Others
Chapter 8. Global Non starch Polysaccharide Regional Analysis and Outlook
8.1. Global Non starch Polysaccharide Revenue (USD Million) By Regions (2021- 2032)
8.2. North America Non starch Polysaccharide Revenue (USD Million) by Country (2021-2032)
8.2.1. United States Non starch Polysaccharide Regional Analysis and Outlook
8.2.2. Canada Non starch Polysaccharide Regional Analysis and Outlook
8.2.3. Mexico Non starch Polysaccharide Regional Analysis and Outlook
8.3. Europe Non starch Polysaccharide Revenue (USD Million), by Country (2021-2032)
8.3.1. Germany Non starch Polysaccharide Regional Analysis and Outlook
8.3.2. France Non starch Polysaccharide Regional Analysis and Outlook
8.3.3. United Kingdom Non starch Polysaccharide Regional Analysis and Outlook
8.3.4. Spain Non starch Polysaccharide Regional Analysis and Outlook
8.3.5. Italy Non starch Polysaccharide Regional Analysis and Outlook
8.3.6. Russia Non starch Polysaccharide Regional Analysis and Outlook
8.3.7. Rest of Europe Non starch Polysaccharide Regional Analysis and Outlook
8.4. Asia Pacific Non starch Polysaccharide Revenue (USD Million) by Country (2021-2032)
8.4.1. China Non starch Polysaccharide Regional Analysis and Outlook
8.4.2. Japan Non starch Polysaccharide Regional Analysis and Outlook
8.4.3. India Non starch Polysaccharide Regional Analysis and Outlook
8.4.4. South Korea Non starch Polysaccharide Regional Analysis and Outlook
8.4.5. Australia Non starch Polysaccharide Regional Analysis and Outlook
8.4.6. South East Asia Non starch Polysaccharide Regional Analysis and Outlook
8.4.7. Rest of Asia Pacific Non starch Polysaccharide Regional Analysis and Outlook
8.5. South America Non starch Polysaccharide Revenue (USD Million), by Country (2021-2032)
8.5.1. Brazil Non starch Polysaccharide Regional Analysis and Outlook
8.5.2. Argentina Non starch Polysaccharide Regional Analysis and Outlook
8.5.3. Rest of South America Non starch Polysaccharide Regional Analysis and Outlook
8.6. Middle East and Africa Non starch Polysaccharide Revenue (USD Million) by Country (2021-2032)
8.6.1. Middle East Non starch Polysaccharide Regional Analysis and Outlook
8.6.2. Africa Non starch Polysaccharide Regional Analysis and Outlook
Chapter 9. North America Non starch Polysaccharide Analysis and Outlook
9.1. North America Non starch Polysaccharide Revenue (USD Million) by Segments (2021-2032)
9.1.1. North America Non starch Polysaccharide Revenue (USD Million) by Type (2021-2032)
9.1.2. North America Non starch Polysaccharide Revenue (USD Million) by Application (2021-2032)
9.1.3. North America Non starch Polysaccharide Revenue (USD Million) by Product (2021-2032)
By Type
Cellulose
Others
By Application
Food Additives
Chemical Materials
Others
Chapter 10. Europe Non starch Polysaccharide Analysis and Outlook
10.1. Europe Non starch Polysaccharide Revenue (USD Million), by Segments (USD Million) (2021-2032)
10.1.1. Europe Non starch Polysaccharide Revenue (USD Million) by Type (2021-2032)
10.1.2. Europe Non starch Polysaccharide Revenue (USD Million) by Application (2021-2032)
10.1.3. Europe Non starch Polysaccharide Revenue (USD Million) by Product (2021-2032)
By Type
Cellulose
Others
By Application
Food Additives
Chemical Materials
Others
Chapter 11. Asia Pacific Non starch Polysaccharide Analysis and Outlook
11.1. Asia Pacific Non starch Polysaccharide Revenue (USD Million), and Revenue (USD Million) by Segments (2021-2032)
11.1.1. Asia Pacific Non starch Polysaccharide Revenue (USD Million) by Type (2021-2032)
11.1.2. Asia Pacific Non starch Polysaccharide Revenue (USD Million) by Application (2021-2032)
11.1.3. Asia Pacific Non starch Polysaccharide Revenue (USD Million) by Product (2021-2032)
By Type
Cellulose
Others
By Application
Food Additives
Chemical Materials
Others
Chapter 12. South America Non starch Polysaccharide Analysis and Outlook
12.1. South America Non starch Polysaccharide Revenue (USD Million), by Segments (2021-2032)
12.1.1. South America Non starch Polysaccharide Revenue (USD Million) by Type (2021-2032)
12.1.2. South America Non starch Polysaccharide Revenue (USD Million) by Application (2021-2032)
12.1.3. South America Non starch Polysaccharide Revenue (USD Million) by Product (2021-2032)
By Type
Cellulose
Others
By Application
Food Additives
Chemical Materials
Others
Chapter 13. Middle East and Africa Non starch Polysaccharide Analysis and Outlook
13.1. Middle East and Africa Non starch Polysaccharide Revenue (USD Million), by Segments (2021-2032)
13.1.1. Middle East and Africa Non starch Polysaccharide Revenue (USD Million) by Type (2021-2032)
13.1.2. Middle East and Africa Non starch Polysaccharide Revenue (USD Million) by Application (2021-2032)
13.1.3. Middle East and Africa Non starch Polysaccharide Revenue (USD Million) by Product (2021-2032)
By Type
Cellulose
Others
By Application
Food Additives
Chemical Materials
Others
Chapter 14. Non starch Polysaccharide Company Profiles
14.1 Business Overview
14.2 Product Profiles
14.3 SWOT Profiles
14.5 Recent Developments
14.6 Financial Profile
List of Companies
AB Enzymes
Adisseo
Advanced Enzymes Technologies
Alltech Inc
Amano Enzyme Inc
BASF SE
Du Pont
Dyadic International
Koninklijke DSM N.V.
Lanxing Adisseo
Novozymes A/S
15. Methodology and Data Sources
15.1 Customization Offerings
15.2 Subscription Services
15.3 Related Reports
15.4 Publisher Expertise
LIST OF TABLES
Table 1 Market Segmentation Analysis
Table 2 Global Non starch Polysaccharide Market Share of Leading Companies, 2023
Table 3 Product Offerings of Leading Companies
Table 4 Low Growth Scenario Forecasts
Table 5 Reference Case Growth Scenario
Table 6 High Growth Case Scenario
Table 7 Global Non starch Polysaccharide Revenue (USD Million) And CAGR (%) By Type (2021-2032)
Table 8 Global Non starch Polysaccharide Revenue (USD Million) And CAGR (%) By Application (2021-2032)
Table 9 Global Non starch Polysaccharide Revenue (USD Million) And CAGR (%) By Product (2021-2032)
Table 10 Global Non starch Polysaccharide Market Revenue (USD Million) By Regions (2021-2032)
Table 11 Global Non starch Polysaccharide Market Share (%) By Regions (2021-2032)
Table 12 North America Non starch Polysaccharide Revenue (USD Million) By Country (2021-2032)
Table 13 Europe Non starch Polysaccharide Revenue (USD Million) By Country (2021-2032)
Table 14 Asia Pacific Non starch Polysaccharide Revenue (USD Million) By Country (2021-2032)
Table 15 South America Non starch Polysaccharide Revenue (USD Million) By Country (2021-2032)
Table 16 Middle East and Africa Non starch Polysaccharide Revenue (USD Million) By Region (2021-2032)
Table 17 North America Non starch Polysaccharide Revenue (USD Million) By Type (2021-2032)
Table 18 North America Non starch Polysaccharide Revenue (USD Million) By Application (2021-2032)
Table 19 North America Non starch Polysaccharide Revenue (USD Million) By Product (2021-2032)
Table 20 Europe Non starch Polysaccharide Revenue (USD Million) By Type (2021-2032)
Table 21 Europe Non starch Polysaccharide Revenue (USD Million) By Application (2021-2032)
Table 22 Europe Non starch Polysaccharide Revenue (USD Million) By Product (2021-2032)
Table 23 Asia Pacific Non starch Polysaccharide Revenue (USD Million) By Type (2021-2032)
Table 24 Asia Pacific Non starch Polysaccharide Revenue (USD Million) By Application (2021-2032)
Table 25 Asia Pacific Non starch Polysaccharide Revenue (USD Million) By Product (2021-2032)
Table 26 South America Non starch Polysaccharide Revenue (USD Million) By Type (2021-2032)
Table 27 South America Non starch Polysaccharide Revenue (USD Million) By Application (2021-2032)
Table 28 South America Non starch Polysaccharide Revenue (USD Million) By Product (2021-2032)
Table 29 Middle East and Africa Non starch Polysaccharide Revenue (USD Million) By Type (2021-2032)
Table 30 Middle East and Africa Non starch Polysaccharide Revenue (USD Million) By Application (2021-2032)
Table 31 Middle East and Africa Non starch Polysaccharide Revenue (USD Million) By Product (2021-2032)
LIST OF FIGURES
Figure 1. Market Scope
Figure 2. Pricing Forecasts Per Unit, 2023- 2032
Figure 3. Porter’s Five Forces
Figure 4. Global Non starch Polysaccharide Market Revenue (USD Million) By Regions (2021-2032)
Figure 5. Global Non starch Polysaccharide Market Share (%) By Regions (2023)
Figure 6. North America Non starch Polysaccharide Revenue (USD Million) By Country (2021-2032)
Figure 7. United States Non starch Polysaccharide Revenue (USD Million) By Country (2021-2032)
Figure 8. Canada Non starch Polysaccharide Revenue (USD Million) By Country (2021-2032)
Figure 9. Mexico Non starch Polysaccharide Revenue (USD Million) By Country (2021-2032)
Figure 10. Europe Non starch Polysaccharide Revenue (USD Million) By Country (2021-2032)
Figure 11. Germany Non starch Polysaccharide Revenue (USD Million) By Country (2021-2032)
Figure 12. France Non starch Polysaccharide Revenue (USD Million) By Country (2021-2032)
Figure 13. United Kingdom Non starch Polysaccharide Revenue (USD Million) By Country (2021-2032)
Figure 14. Spain Non starch Polysaccharide Revenue (USD Million) By Country (2021-2032)
Figure 15. Italy Non starch Polysaccharide Revenue (USD Million) By Country (2021-2032)
Figure 16. Russia Non starch Polysaccharide Revenue (USD Million) By Country (2021-2032)
Figure 17. Rest of Europe Non starch Polysaccharide Revenue (USD Million) By Country (2021-2032)
Figure 11. Asia Pacific Non starch Polysaccharide Revenue (USD Million) By Country (2021-2032)
Figure 12. China Non starch Polysaccharide Revenue (USD Million) By Country (2021-2032)
Figure 13. Japan Non starch Polysaccharide Revenue (USD Million) By Country (2021-2032)
Figure 14. India Non starch Polysaccharide Revenue (USD Million) By Country (2021-2032)
Figure 15. South Korea Non starch Polysaccharide Revenue (USD Million) By Country (2021-2032)
Figure 16. Australia Non starch Polysaccharide Revenue (USD Million) By Country (2021-2032)
Figure 17. South East Asia Non starch Polysaccharide Revenue (USD Million) By Country (2021-2032)
Figure 18. South America Non starch Polysaccharide Revenue (USD Million) By Country (2021-2032)
Figure 19. Brazil Non starch Polysaccharide Revenue (USD Million) By Country (2021-2032)
Figure 20. Argentina Non starch Polysaccharide Revenue (USD Million) By Country (2021-2032)
Figure 21. Rest of Asia Pacific Non starch Polysaccharide Revenue (USD Million) By Country (2021-2032)
Figure 22. Middle East and Africa Non starch Polysaccharide Revenue (USD Million) By Region (2021-2032)
Figure 23. Saudi Arabia Non starch Polysaccharide Revenue (USD Million) By Region (2021-2032)
Figure 24. The UAE Non starch Polysaccharide Revenue (USD Million) By Region (2021-2032)
Figure 25. Rest of Middle East Non starch Polysaccharide Revenue (USD Million) By Region (2021-2032)
Figure 26. South Africa Non starch Polysaccharide Revenue (USD Million) By Region (2021-2032)
Figure 27. Africa Non starch Polysaccharide Revenue (USD Million) By Region (2021-2032)
Figure 28. North America Non starch Polysaccharide Revenue (USD Million) By Type (2021-2032)
Figure 29. North America Non starch Polysaccharide Revenue (USD Million) By Application (2021-2032)
Figure 30. North America Non starch Polysaccharide Revenue (USD Million) By Product (2021-2032)
Figure 31. Europe Non starch Polysaccharide Revenue (USD Million) By Type (2021-2032)
Figure 32. Europe Non starch Polysaccharide Revenue (USD Million) By Application (2021-2032)
Figure 33. Europe Non starch Polysaccharide Revenue (USD Million) By Product (2021-2032)
Figure 34. Asia Pacific Non starch Polysaccharide Revenue (USD Million) By Type (2021-2032)
Figure 35. Asia Pacific Non starch Polysaccharide Revenue (USD Million) By Application (2021-2032)
Figure 36. Asia Pacific Non starch Polysaccharide Revenue (USD Million) By Product (2021-2032)
Figure 37. South America Non starch Polysaccharide Revenue (USD Million) By Type (2021-2032)
Figure 38. South America Non starch Polysaccharide Revenue (USD Million) By Application (2021-2032)
Figure 39. South America Non starch Polysaccharide Revenue (USD Million) By Product (2021-2032)
Figure 40. Middle East and Africa Non starch Polysaccharide Revenue (USD Million) By Type (2021-2032)
Figure 41. Middle East and Africa Non starch Polysaccharide Revenue (USD Million) By Application (2021-2032)
Figure 42. Middle East and Africa Non starch Polysaccharide Revenue (USD Million) By Product (2021-2032)
By Type
Cellulose
Others
By Application
Food Additives
Chemical Materials
Others
Countries Analyzed
North America (US, Canada, Mexico)
Europe (Germany, UK, France, Spain, Italy, Russia, Rest of Europe)
Asia Pacific (China, India, Japan, South Korea, Australia, South East Asia, Rest of Asia)
South America (Brazil, Argentina, Rest of South America)
Middle East and Africa (Saudi Arabia, UAE, Rest of Middle East, South Africa, Egypt, Rest of Africa)
