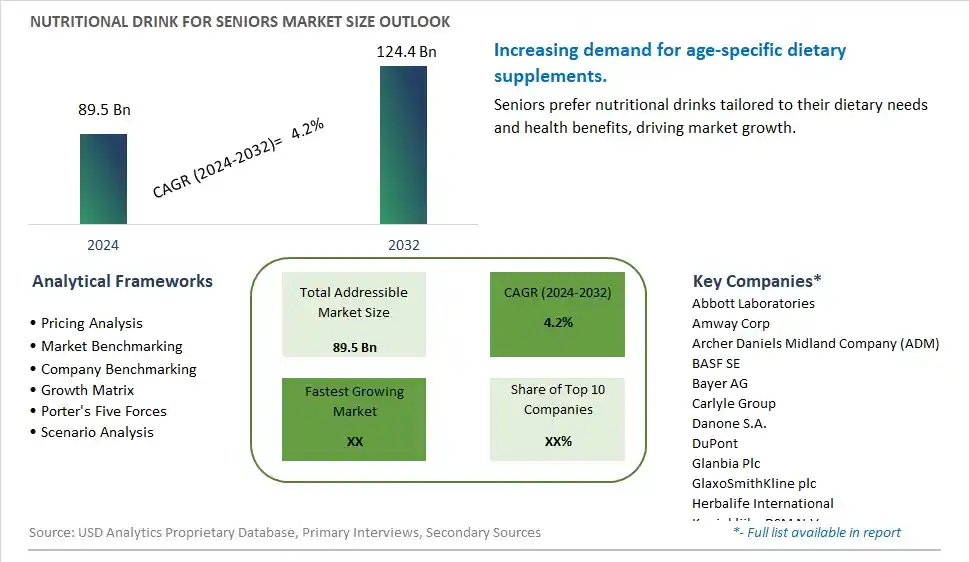
Global Nutritional Drink for Seniors Market Size is valued at $89.5 Billion in 2024 and is forecast to register a growth rate (CAGR) of 4.2% to reach $124.4 Billion by 2032.
The global Nutritional Drink for Seniors Market Comprehensive Study analyzes and forecasts the market size across 6 regions and 24 countries for diverse segments -By Type (Capsule, Tablet, Liquid, Others), By Application (Food & Beverages, Health Care Products, Others)
An Introduction to Nutritional Drink for Seniors Market
In 2024, the nutritional drink for seniors market is thriving, driven by the demand for convenient and nutrient-dense beverages tailored to the dietary needs of older adults. These drinks, fortified with essential vitamins, minerals, and proteins, support overall health, energy, and vitality in seniors. The market benefits from advancements in formulation and packaging technologies that enhance taste, convenience, and nutritional value. The trend towards clean label and natural ingredients is influencing product development. Increasing awareness of age-specific nutrition and the popularity of functional beverages among seniors are further supporting market growth.
Nutritional Drink for seniors Competitive Landscape
The market report analyses the leading companies in the industry including Abbott Laboratories, Amway Corp, Archer Daniels Midland Company (ADM), BASF SE, Bayer AG, Carlyle Group, Danone S.A., DuPont, Glanbia Plc, GlaxoSmithKline plc, Herbalife International, Koninklijke DSM N.V., Nestlé SA, NSF, The Himalaya Drug Company, Yakult Honsha Co., Ltd., and Others.
Nutritional Drink for seniors Market Dynamics
Nutritional Drink for Seniors Market Trend: Increasing Demand for Age-Specific Nutritional Products
The most prominent trend in the Nutritional Drink for Seniors Market is the increasing demand for age-specific nutritional products. Seniors are seeking beverages that cater to their unique nutritional needs, such as maintaining muscle mass, supporting bone health, and boosting immunity. This trend is driven by the growing recognition of the importance of targeted nutrition in promoting healthy aging.
Nutritional Drink for Seniors Market Driver: Aging Population and Health Awareness
A key driver in the Nutritional Drink for Seniors Market is the aging population and health awareness. As the number of elderly individuals increases, there is a rising demand for nutritional drinks that provide essential nutrients and support overall health and well-being. This demand supports the growth of the market as seniors seek convenient and effective ways to meet their dietary needs.
Nutritional Drink for Seniors Market Opportunity: Innovation in Nutritional Formulations and Flavors
One significant opportunity in the Nutritional Drink for Seniors Market lies in innovation in nutritional formulations and flavors. Companies can develop new beverages that offer a balanced mix of proteins, vitamins, minerals, and other beneficial compounds, tailored to the needs of seniors. By offering appealing flavors and convenient packaging, manufacturers can enhance the consumer experience and drive market growth.
Nutritional Drink for Seniors Market Share Analysis- Largest Segment by Type
In the Nutritional Drink for Seniors Market, Liquid is the largest segment. Liquid nutritional drinks are preferred by seniors for their ease of consumption and rapid absorption. These drinks are designed to provide essential nutrients in a form that is easier to digest and more convenient to take compared to tablets or capsules. Liquid formulations are often used to address specific dietary needs or deficiencies and are favored for their ability to deliver a concentrated dose of vitamins, minerals, and other nutrients. The prevalence of age-related health issues and the growing focus on maintaining nutritional health in senior populations contribute to the dominance of liquid nutritional drinks in this market.
Nutritional Drink for Seniors Market Share Analysis- Fastest Growing Segment by Application
In the Nutritional Drink for Seniors Market, Health Care Products is poised to grow the fastest over the next five years. This growth is driven by the increasing recognition of the role of nutritional drinks in managing chronic health conditions and improving overall well-being among seniors. As healthcare systems focus more on preventive care and managing age-related health issues through diet and nutrition, the demand for specialized nutritional drinks as part of health care regimens is rising. Products formulated to support specific health needs, such as bone health, cognitive function, and immune support, are becoming more prevalent. This trend is further supported by advancements in product formulations and increased awareness of the benefits of targeted nutritional interventions for senior health.
Nutritional Drink for seniors Market Segmentation
By Type
Capsule
Tablet
Liquid
Others
By Application
Food & Beverages
Health Care Products
Others
Countries Analyzed
North America (US, Canada, Mexico)
Europe (Germany, UK, France, Spain, Italy, Russia, Rest of Europe)
Asia Pacific (China, India, Japan, South Korea, Australia, South East Asia, Rest of Asia)
South America (Brazil, Argentina, Rest of South America)
Middle East and Africa (Saudi Arabia, UAE, Rest of Middle East, South Africa, Egypt, Rest of Africa)
Nutritional Drink for seniors Companies Profiled in the Study
Abbott Laboratories
Amway Corp
Archer Daniels Midland Company (ADM)
BASF SE
Bayer AG
Carlyle Group
Danone S.A.
DuPont
Glanbia Plc
GlaxoSmithKline plc
Herbalife International
Koninklijke DSM N.V.
Nestlé SA
NSF
The Himalaya Drug Company
Yakult Honsha Co., Ltd.
*- List Not Exhaustive
Chapter 1. TABLE OF CONTENTS
Chapter 2. Introduction to Nutritional Drink for seniors Market
2.1. Market Overview
2.2. Key Statistics and Report Highlights
2.3. Scope of the Comprehensive Study
2.3.1. Market Definition
2.3.2 Countries and Regions Covered
2.3.3 Research Objective
2.3.4 Units, Currency, and Conversions
2.3.5 Industry Value Chain
2.4. Key Market Segments
2.5. Key Companies
2.6. Study Period
Chapter 3. Strategic Analysis Review
3.1. Nutritional Drink for seniors Pricing Analysis and Forecast
3.2. Porter’s Five Forces
3.3. Market Ecosystem
3.4. SWOT Analysis
3.5. Regulatory Scenario
3.3. Effects of Inflation, Russia-Ukraine War, moderating economic growth, and other macroeconomic factors
Chapter 4. Competitive Landscape
4.1. Market Share Analysis
4.1.1. Global Nutritional Drink for seniors Market Share by Company, 2023
4.1.2. Product Offerings of Leading Nutritional Drink for seniors Companies
4.2. Market Entropy
4.2.1. New Product Launches in the Industry
4.2.2. Mergers, Acquisitions, Joint ventures, and Partnerships
4.3. Key Strategies and Best Practices
Chapter 5. Global Market Projections: Best, Reference, and Low Case Scenarios
5.1. Growth Analysis- Case Scenario Definitions
5.2. Low Growth Case Scenario Forecasts
5.3. Reference Growth Case Scenario Forecasts
5.4. High Growth Case Scenario Forecasts
Chapter 6. Market Dynamics
6.1. Nutritional Drink for seniors Market Drivers
6.2. Nutritional Drink for seniors Market Challenges
6.6. Nutritional Drink for seniors Market Opportunities
6.4. Nutritional Drink for seniors Market Trends
Chapter 7. Global Nutritional Drink for seniors Market Outlook Trends
7.1. Global Nutritional Drink for seniors Revenue (USD Million) and CAGR (%) by Type (2021-2032)
7.2. Global Nutritional Drink for seniors Revenue (USD Million) and CAGR (%) by Application (2021-2032)
7.3. Global Nutritional Drink for seniors Revenue (USD Million) and CAGR (%) by Product (2021-2032)
By Type
Capsule
Tablet
Liquid
Others
By Application
Food & Beverages
Health Care Products
Others
Chapter 8. Global Nutritional Drink for seniors Regional Analysis and Outlook
8.1. Global Nutritional Drink for seniors Revenue (USD Million) By Regions (2021- 2032)
8.2. North America Nutritional Drink for seniors Revenue (USD Million) by Country (2021-2032)
8.2.1. United States Nutritional Drink for seniors Regional Analysis and Outlook
8.2.2. Canada Nutritional Drink for seniors Regional Analysis and Outlook
8.2.3. Mexico Nutritional Drink for seniors Regional Analysis and Outlook
8.3. Europe Nutritional Drink for seniors Revenue (USD Million), by Country (2021-2032)
8.3.1. Germany Nutritional Drink for seniors Regional Analysis and Outlook
8.3.2. France Nutritional Drink for seniors Regional Analysis and Outlook
8.3.3. United Kingdom Nutritional Drink for seniors Regional Analysis and Outlook
8.3.4. Spain Nutritional Drink for seniors Regional Analysis and Outlook
8.3.5. Italy Nutritional Drink for seniors Regional Analysis and Outlook
8.3.6. Russia Nutritional Drink for seniors Regional Analysis and Outlook
8.3.7. Rest of Europe Nutritional Drink for seniors Regional Analysis and Outlook
8.4. Asia Pacific Nutritional Drink for seniors Revenue (USD Million) by Country (2021-2032)
8.4.1. China Nutritional Drink for seniors Regional Analysis and Outlook
8.4.2. Japan Nutritional Drink for seniors Regional Analysis and Outlook
8.4.3. India Nutritional Drink for seniors Regional Analysis and Outlook
8.4.4. South Korea Nutritional Drink for seniors Regional Analysis and Outlook
8.4.5. Australia Nutritional Drink for seniors Regional Analysis and Outlook
8.4.6. South East Asia Nutritional Drink for seniors Regional Analysis and Outlook
8.4.7. Rest of Asia Pacific Nutritional Drink for seniors Regional Analysis and Outlook
8.5. South America Nutritional Drink for seniors Revenue (USD Million), by Country (2021-2032)
8.5.1. Brazil Nutritional Drink for seniors Regional Analysis and Outlook
8.5.2. Argentina Nutritional Drink for seniors Regional Analysis and Outlook
8.5.3. Rest of South America Nutritional Drink for seniors Regional Analysis and Outlook
8.6. Middle East and Africa Nutritional Drink for seniors Revenue (USD Million) by Country (2021-2032)
8.6.1. Middle East Nutritional Drink for seniors Regional Analysis and Outlook
8.6.2. Africa Nutritional Drink for seniors Regional Analysis and Outlook
Chapter 9. North America Nutritional Drink for seniors Analysis and Outlook
9.1. North America Nutritional Drink for seniors Revenue (USD Million) by Segments (2021-2032)
9.1.1. North America Nutritional Drink for seniors Revenue (USD Million) by Type (2021-2032)
9.1.2. North America Nutritional Drink for seniors Revenue (USD Million) by Application (2021-2032)
9.1.3. North America Nutritional Drink for seniors Revenue (USD Million) by Product (2021-2032)
By Type
Capsule
Tablet
Liquid
Others
By Application
Food & Beverages
Health Care Products
Others
Chapter 10. Europe Nutritional Drink for seniors Analysis and Outlook
10.1. Europe Nutritional Drink for seniors Revenue (USD Million), by Segments (USD Million) (2021-2032)
10.1.1. Europe Nutritional Drink for seniors Revenue (USD Million) by Type (2021-2032)
10.1.2. Europe Nutritional Drink for seniors Revenue (USD Million) by Application (2021-2032)
10.1.3. Europe Nutritional Drink for seniors Revenue (USD Million) by Product (2021-2032)
By Type
Capsule
Tablet
Liquid
Others
By Application
Food & Beverages
Health Care Products
Others
Chapter 11. Asia Pacific Nutritional Drink for seniors Analysis and Outlook
11.1. Asia Pacific Nutritional Drink for seniors Revenue (USD Million), and Revenue (USD Million) by Segments (2021-2032)
11.1.1. Asia Pacific Nutritional Drink for seniors Revenue (USD Million) by Type (2021-2032)
11.1.2. Asia Pacific Nutritional Drink for seniors Revenue (USD Million) by Application (2021-2032)
11.1.3. Asia Pacific Nutritional Drink for seniors Revenue (USD Million) by Product (2021-2032)
By Type
Capsule
Tablet
Liquid
Others
By Application
Food & Beverages
Health Care Products
Others
Chapter 12. South America Nutritional Drink for seniors Analysis and Outlook
12.1. South America Nutritional Drink for seniors Revenue (USD Million), by Segments (2021-2032)
12.1.1. South America Nutritional Drink for seniors Revenue (USD Million) by Type (2021-2032)
12.1.2. South America Nutritional Drink for seniors Revenue (USD Million) by Application (2021-2032)
12.1.3. South America Nutritional Drink for seniors Revenue (USD Million) by Product (2021-2032)
By Type
Capsule
Tablet
Liquid
Others
By Application
Food & Beverages
Health Care Products
Others
Chapter 13. Middle East and Africa Nutritional Drink for seniors Analysis and Outlook
13.1. Middle East and Africa Nutritional Drink for seniors Revenue (USD Million), by Segments (2021-2032)
13.1.1. Middle East and Africa Nutritional Drink for seniors Revenue (USD Million) by Type (2021-2032)
13.1.2. Middle East and Africa Nutritional Drink for seniors Revenue (USD Million) by Application (2021-2032)
13.1.3. Middle East and Africa Nutritional Drink for seniors Revenue (USD Million) by Product (2021-2032)
By Type
Capsule
Tablet
Liquid
Others
By Application
Food & Beverages
Health Care Products
Others
Chapter 14. Nutritional Drink for seniors Company Profiles
14.1 Business Overview
14.2 Product Profiles
14.3 SWOT Profiles
14.5 Recent Developments
14.6 Financial Profile
List of Companies
Abbott Laboratories
Amway Corp
Archer Daniels Midland Company (ADM)
BASF SE
Bayer AG
Carlyle Group
Danone S.A.
DuPont
Glanbia Plc
GlaxoSmithKline plc
Herbalife International
Koninklijke DSM N.V.
Nestlé SA
NSF
The Himalaya Drug Company
Yakult Honsha Co., Ltd.
15. Methodology and Data Sources
15.1 Customization Offerings
15.2 Subscription Services
15.3 Related Reports
15.4 Publisher Expertise
LIST OF TABLES
Table 1 Market Segmentation Analysis
Table 2 Global Nutritional Drink for seniors Market Share of Leading Companies, 2023
Table 3 Product Offerings of Leading Companies
Table 4 Low Growth Scenario Forecasts
Table 5 Reference Case Growth Scenario
Table 6 High Growth Case Scenario
Table 7 Global Nutritional Drink for seniors Revenue (USD Million) And CAGR (%) By Type (2021-2032)
Table 8 Global Nutritional Drink for seniors Revenue (USD Million) And CAGR (%) By Application (2021-2032)
Table 9 Global Nutritional Drink for seniors Revenue (USD Million) And CAGR (%) By Product (2021-2032)
Table 10 Global Nutritional Drink for seniors Market Revenue (USD Million) By Regions (2021-2032)
Table 11 Global Nutritional Drink for seniors Market Share (%) By Regions (2021-2032)
Table 12 North America Nutritional Drink for seniors Revenue (USD Million) By Country (2021-2032)
Table 13 Europe Nutritional Drink for seniors Revenue (USD Million) By Country (2021-2032)
Table 14 Asia Pacific Nutritional Drink for seniors Revenue (USD Million) By Country (2021-2032)
Table 15 South America Nutritional Drink for seniors Revenue (USD Million) By Country (2021-2032)
Table 16 Middle East and Africa Nutritional Drink for seniors Revenue (USD Million) By Region (2021-2032)
Table 17 North America Nutritional Drink for seniors Revenue (USD Million) By Type (2021-2032)
Table 18 North America Nutritional Drink for seniors Revenue (USD Million) By Application (2021-2032)
Table 19 North America Nutritional Drink for seniors Revenue (USD Million) By Product (2021-2032)
Table 20 Europe Nutritional Drink for seniors Revenue (USD Million) By Type (2021-2032)
Table 21 Europe Nutritional Drink for seniors Revenue (USD Million) By Application (2021-2032)
Table 22 Europe Nutritional Drink for seniors Revenue (USD Million) By Product (2021-2032)
Table 23 Asia Pacific Nutritional Drink for seniors Revenue (USD Million) By Type (2021-2032)
Table 24 Asia Pacific Nutritional Drink for seniors Revenue (USD Million) By Application (2021-2032)
Table 25 Asia Pacific Nutritional Drink for seniors Revenue (USD Million) By Product (2021-2032)
Table 26 South America Nutritional Drink for seniors Revenue (USD Million) By Type (2021-2032)
Table 27 South America Nutritional Drink for seniors Revenue (USD Million) By Application (2021-2032)
Table 28 South America Nutritional Drink for seniors Revenue (USD Million) By Product (2021-2032)
Table 29 Middle East and Africa Nutritional Drink for seniors Revenue (USD Million) By Type (2021-2032)
Table 30 Middle East and Africa Nutritional Drink for seniors Revenue (USD Million) By Application (2021-2032)
Table 31 Middle East and Africa Nutritional Drink for seniors Revenue (USD Million) By Product (2021-2032)
LIST OF FIGURES
Figure 1. Market Scope
Figure 2. Pricing Forecasts Per Unit, 2023- 2032
Figure 3. Porter’s Five Forces
Figure 4. Global Nutritional Drink for seniors Market Revenue (USD Million) By Regions (2021-2032)
Figure 5. Global Nutritional Drink for seniors Market Share (%) By Regions (2023)
Figure 6. North America Nutritional Drink for seniors Revenue (USD Million) By Country (2021-2032)
Figure 7. United States Nutritional Drink for seniors Revenue (USD Million) By Country (2021-2032)
Figure 8. Canada Nutritional Drink for seniors Revenue (USD Million) By Country (2021-2032)
Figure 9. Mexico Nutritional Drink for seniors Revenue (USD Million) By Country (2021-2032)
Figure 10. Europe Nutritional Drink for seniors Revenue (USD Million) By Country (2021-2032)
Figure 11. Germany Nutritional Drink for seniors Revenue (USD Million) By Country (2021-2032)
Figure 12. France Nutritional Drink for seniors Revenue (USD Million) By Country (2021-2032)
Figure 13. United Kingdom Nutritional Drink for seniors Revenue (USD Million) By Country (2021-2032)
Figure 14. Spain Nutritional Drink for seniors Revenue (USD Million) By Country (2021-2032)
Figure 15. Italy Nutritional Drink for seniors Revenue (USD Million) By Country (2021-2032)
Figure 16. Russia Nutritional Drink for seniors Revenue (USD Million) By Country (2021-2032)
Figure 17. Rest of Europe Nutritional Drink for seniors Revenue (USD Million) By Country (2021-2032)
Figure 11. Asia Pacific Nutritional Drink for seniors Revenue (USD Million) By Country (2021-2032)
Figure 12. China Nutritional Drink for seniors Revenue (USD Million) By Country (2021-2032)
Figure 13. Japan Nutritional Drink for seniors Revenue (USD Million) By Country (2021-2032)
Figure 14. India Nutritional Drink for seniors Revenue (USD Million) By Country (2021-2032)
Figure 15. South Korea Nutritional Drink for seniors Revenue (USD Million) By Country (2021-2032)
Figure 16. Australia Nutritional Drink for seniors Revenue (USD Million) By Country (2021-2032)
Figure 17. South East Asia Nutritional Drink for seniors Revenue (USD Million) By Country (2021-2032)
Figure 18. South America Nutritional Drink for seniors Revenue (USD Million) By Country (2021-2032)
Figure 19. Brazil Nutritional Drink for seniors Revenue (USD Million) By Country (2021-2032)
Figure 20. Argentina Nutritional Drink for seniors Revenue (USD Million) By Country (2021-2032)
Figure 21. Rest of Asia Pacific Nutritional Drink for seniors Revenue (USD Million) By Country (2021-2032)
Figure 22. Middle East and Africa Nutritional Drink for seniors Revenue (USD Million) By Region (2021-2032)
Figure 23. Saudi Arabia Nutritional Drink for seniors Revenue (USD Million) By Region (2021-2032)
Figure 24. The UAE Nutritional Drink for seniors Revenue (USD Million) By Region (2021-2032)
Figure 25. Rest of Middle East Nutritional Drink for seniors Revenue (USD Million) By Region (2021-2032)
Figure 26. South Africa Nutritional Drink for seniors Revenue (USD Million) By Region (2021-2032)
Figure 27. Africa Nutritional Drink for seniors Revenue (USD Million) By Region (2021-2032)
Figure 28. North America Nutritional Drink for seniors Revenue (USD Million) By Type (2021-2032)
Figure 29. North America Nutritional Drink for seniors Revenue (USD Million) By Application (2021-2032)
Figure 30. North America Nutritional Drink for seniors Revenue (USD Million) By Product (2021-2032)
Figure 31. Europe Nutritional Drink for seniors Revenue (USD Million) By Type (2021-2032)
Figure 32. Europe Nutritional Drink for seniors Revenue (USD Million) By Application (2021-2032)
Figure 33. Europe Nutritional Drink for seniors Revenue (USD Million) By Product (2021-2032)
Figure 34. Asia Pacific Nutritional Drink for seniors Revenue (USD Million) By Type (2021-2032)
Figure 35. Asia Pacific Nutritional Drink for seniors Revenue (USD Million) By Application (2021-2032)
Figure 36. Asia Pacific Nutritional Drink for seniors Revenue (USD Million) By Product (2021-2032)
Figure 37. South America Nutritional Drink for seniors Revenue (USD Million) By Type (2021-2032)
Figure 38. South America Nutritional Drink for seniors Revenue (USD Million) By Application (2021-2032)
Figure 39. South America Nutritional Drink for seniors Revenue (USD Million) By Product (2021-2032)
Figure 40. Middle East and Africa Nutritional Drink for seniors Revenue (USD Million) By Type (2021-2032)
Figure 41. Middle East and Africa Nutritional Drink for seniors Revenue (USD Million) By Application (2021-2032)
Figure 42. Middle East and Africa Nutritional Drink for seniors Revenue (USD Million) By Product (2021-2032)
By Type
Capsule
Tablet
Liquid
Others
By Application
Food & Beverages
Health Care Products
Others
Countries Analyzed
North America (US, Canada, Mexico)
Europe (Germany, UK, France, Spain, Italy, Russia, Rest of Europe)
Asia Pacific (China, India, Japan, South Korea, Australia, South East Asia, Rest of Asia)
South America (Brazil, Argentina, Rest of South America)
Middle East and Africa (Saudi Arabia, UAE, Rest of Middle East, South Africa, Egypt, Rest of Africa)
