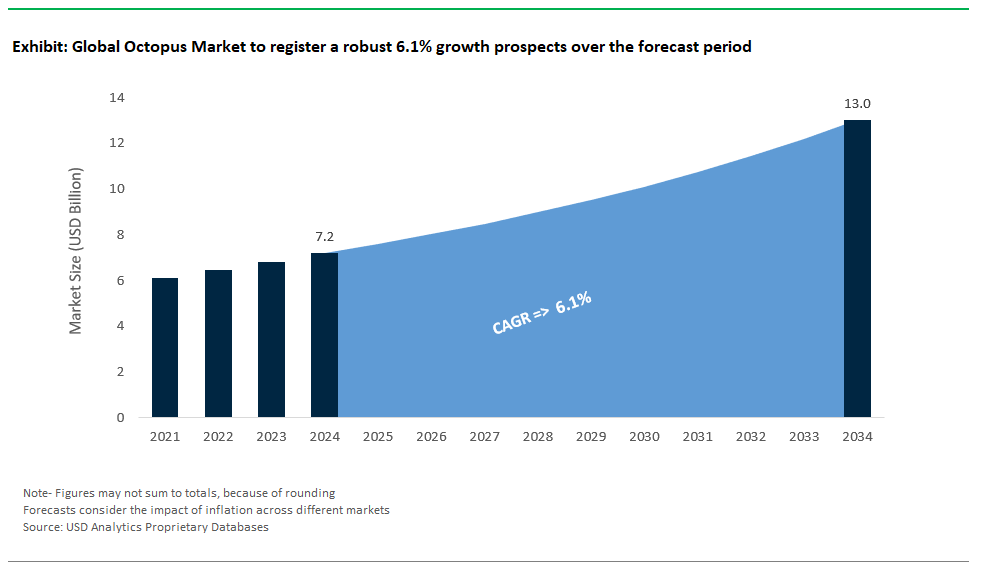
Octopus Market Size is valued at $7.2 Billion in 2024 and is forecast to register a growth rate (CAGR) of 6.1% to reach $13 Billion by 2034.
The global Octopus Market study analyzes and forecasts the market size across 6 regions and 24 countries for diverse segments including- By Type (Common Atlantic Octopus, Giant Pacific Octopus, Blue Ringed Octopus, Others), By Packaging (Polystyrene/Plastic Trays, Plastic Bags), By Application (Commercial, Household), By Category (Fresh, Processed), By Distribution Channel (Online, Offline)
An Introduction to Octopus Market
The Octopus Market in 2025 is projected to grow steadily, driven by increasing consumer demand for seafood delicacies and the rising popularity of octopus in global cuisines. Key markets in Asia, Europe, and North America are fueling this growth, with octopus being a staple in traditional dishes and an increasingly sought-after ingredient in gourmet cooking. Sustainability concerns and overfishing, however, are prompting the industry to explore aquaculture and farming innovations to meet demand while preserving natural populations. The health benefits of octopus, such as its high protein content and low fat, are attracting health-conscious consumers. Additionally, frozen and ready-to-cook octopus products are gaining traction as they cater to the convenience needs of busy households. Trade dynamics, particularly in the export of octopus from regions like Spain, Morocco, and Southeast Asia, will continue to influence the market's development. Eco-certification and traceability efforts are expected to shape consumer preferences and industry practices.
Octopus Market Competitive Landscape
The market report analyses the leading companies in the industry including AO Seafoods Ltd, Aqua Blue Seafood, FreshToHome Limited, Frigoríficos de Camariñas S.L., Fulton Fish Market, Inc., Galveston Shrimp Company LLC, Joe Patti's Seafood Company, Kiwi Fish International Limited, Pescanova Hellas EPE, Thai Union Group Public Company Limited, The Fish Society Ltd, and Others.
Octopus Market Dynamics
Octopus Market Trend: Increasing Popularity of Sustainable and Ethical Seafood Choices
In the Octopus market, a most prominent trend is the increasing popularity of sustainable and ethical seafood choices. As consumers become more conscious of the environmental impact and overfishing concerns, there is a growing preference for responsibly sourced seafood, including octopus. This trend is driven by a desire to support sustainable fishing practices and preserve marine ecosystems. The market is adapting to this trend by promoting responsibly harvested octopus as a viable and eco-friendly seafood option, appealing to environmentally conscious consumers.
Octopus Market Driver: Culinary Exploration and Growing Interest in Exotic Seafood
A key driver in the Octopus market is the culinary exploration and the growing interest in exotic seafood. Octopus, with its unique texture and flavor profile, has become a sought-after ingredient in various global cuisines. This driver is fueled by a culinary adventurousness among consumers who are eager to try new and diverse seafood options beyond conventional choices. The market for octopus benefits from this culinary curiosity, with chefs and home cooks alike incorporating octopus into innovative dishes, contributing to its increasing demand in the culinary landscape.
Octopus Market Opportunity: Diversification of Octopus Products and Convenience Offerings
An opportunity within the Octopus market lies in the diversification of octopus products and the introduction of convenience offerings. Manufacturers can explore creating value-added octopus products, such as pre-cooked and ready-to-eat options, to cater to consumers looking for convenient and time-saving seafood choices. Additionally, there is an opportunity to expand the variety of octopus-based products, such as marinated octopus salads or octopus-based snacks. This opportunity allows companies to tap into different consumer preferences and occasions, making octopus a versatile and appealing choice for a broader audience. By focusing on diversification and convenience, manufacturers can enhance the market presence of octopus and meet the evolving needs of seafood enthusiasts.
Octopus Market Share Analysis: Largest Segment: Polystyrene/Plastic Trays Packaging generated the highest revenue in 2024
In the octopus market, polystyrene/plastic trays are the largest segment by packaging. These trays are preferred due to their durability, lightweight nature, and ability to maintain the freshness of the product during storage and transport. They are widely used in retail and wholesale markets, offering convenience in stacking, handling, and display. Additionally, the clear visibility of the product through these trays enhances consumer appeal, driving higher adoption. Their compatibility with temperature-controlled environments, such as freezers and coolers, makes them ideal for preserving the quality of octopus products in both fresh and processed forms.
Octopus Market Share Analysis: Fastest-Growing Segment: Giant Pacific Octopus is poised to register the fastest growth rate (CAGR) over the forecast period from 2025 to 2034.
The Giant Pacific Octopus segment is expected to grow the fastest in the octopus market by type. Known for its large size and rich flavor, this species is gaining popularity in global culinary markets, particularly in gourmet and premium dining sectors. The rising demand for exotic seafood, coupled with its higher yield per catch, is driving growth in this segment. Additionally, increased efforts in sustainable fishing and aquaculture of this species support its availability and appeal. As consumer preferences shift towards unique and high-quality seafood options, the Giant Pacific Octopus is poised for rapid growth.
Octopus Market Share Analysis: Fresh Octopus type generated the highest revenue in 2024
The fresh octopus category is the largest segment in the market by category. Fresh octopus is highly valued for its superior taste, texture, and versatility in culinary applications. It is particularly popular in regions with a strong seafood culture, such as Mediterranean and Asian countries, where freshness is a key determinant of quality. The growing trend of healthy eating and the preference for minimally processed foods further bolster this segment. Fresh octopus is also prominently featured in high-end restaurants and specialty food markets, driving its demand in the global market.
Octopus Market Share Analysis: Commercial application is poised to register the fastest growth rate (CAGR) over the forecast period from 2025 to 2034.
The commercial segment is the fastest-growing application in the octopus market by 2034. This growth is driven by the expanding foodservice industry, including restaurants, hotels, and catering services, which rely heavily on octopus as a premium seafood offering. Increasing globalization of cuisines and the rising popularity of octopus-based dishes, such as sushi, ceviche, and grilled octopus, contribute to its demand. Additionally, advancements in cold chain logistics and distribution channels are enabling wider access to octopus in international markets, fueling its growth in the commercial sector.
Octopus Market Report Scope
|
Parameter
|
Details
|
|
Market Size (2024)
|
$7.2 Billion
|
|
Market Size (2034)
|
$13 Billion
|
|
Market Growth Rate
|
6.1%
|
|
Segments
|
By Type (Common Atlantic Octopus, Giant Pacific Octopus, Blue Ringed Octopus, Others), By Packaging (Polystyrene/Plastic Trays, Plastic Bags), By Application (Commercial, Household), By Category (Fresh, Processed), By Distribution Channel (Online, Offline)
|
|
Study Period
|
2019- 2024 and 2025-2034
|
|
Units
|
Revenue (USD)
|
|
Qualitative Analysis
|
Porter’s Five Forces, SWOT Profile, Market Share, Scenario Forecasts, Market Ecosystem, Company Ranking, Market Dynamics, Industry Benchmarking
|
|
Companies
|
AO Seafoods Ltd, Aqua Blue Seafood, FreshToHome Ltd, Frigoríficos de Camariñas S.L., Fulton Fish Market, Inc., Galveston Shrimp Company LLC, Joe Patti's Seafood Company, Kiwi Fish International Ltd, Pescanova Hellas EPE, Thai Union Group Public Company Ltd, The Fish Society Ltd, and Others.
|
|
Countries
|
US, Canada, Mexico, Germany, France, Spain, Italy, UK, Russia, China, India, Japan, South Korea, Australia, South East Asia, Brazil, Argentina, Middle East, Africa
|
Octopus Market Segmentation
By Type
- Common Atlantic Octopus
- Giant Pacific Octopus
- Blue Ringed Octopus
- Others
By Packaging
- Polystyrene/Plastic Trays
- Plastic Bags
By Application
By Category
By Distribution Channel
Geographical Analysis
- North America (United States, Canada, Mexico)
- Europe (Germany, France, United Kingdom, Spain, Italy, Others)
- Asia Pacific (China, India, Japan, South Korea, Australia, Others)
- Latin America (Brazil, Argentina, Others)
- Middle East and Africa (Saudi Arabia, UAE, Kuwait, Other Middle East, South Africa, Nigeria, Other Africa)
Octopus Market Companies Profiled in the Study
Octopus is a type of seafood, valued for its taste and culinary versatility in various cuisines worldwide.The industry is characterized by intense competitive conditions with leading companies focusing on new product launches, widening distribution channels, and supply-chain optimization strategies.
- Pescanova Hellas EPE
- Thai Union Group Public Company Limited
- Joe Patti's Seafood Company
- Frigoríficos de Camariñas S.L.
- Galveston Shrimp Company LLC
- FreshToHome Limited
- Fulton Fish Market, Inc.
- Aqua Blue Seafood
- The Fish Society Ltd
- AO Seafoods Ltd
- Kiwi Fish International Limited
*List not exhaustive
Octopus Market Outlook 2024
1 Market Overview
1.1 Introduction to the Octopus Market
1.2 Scope of the Study
1.3 Research Objective
1.3.1 Key Market Scope and Segments
1.3.2 Players Covered
1.3.3 Years Considered
2 Executive Summary
2.1 2024 Octopus Industry- Market Statistics
3 Market Dynamics
3.1 Market Drivers
3.2 Market Challenges
3.3 Market Opportunities
3.4 Market Trends
4 Market Factor Analysis
4.1 Porter’s Five Forces
4.2 Market Entropy
4.2.1 Global Octopus Market Companies with Area Served
4.2.2 Products Offerings Global Octopus Market
5 COVID-19 Impact Analysis and Outlook Scenarios
5.1.1 Covid-19 Impact Analysis
5.1.2 post-COVID-19 Scenario- Low Growth Case
5.1.3 post-COVID-19 Scenario- Reference Growth Case
5.1.4 post-COVID-19 Scenario- Low Growth Case
6 Global Octopus Market Trends
6.1 Global Octopus Revenue (USD Million) and CAGR (%) by Type (2018-2030)
6.2 Global Octopus Revenue (USD Million) and CAGR (%) by Applications (2018-2030)
6.3 Global Octopus Revenue (USD Million) and CAGR (%) by regions (2018-2030)
7 Global Octopus Market Revenue (USD Million) by Type, and Applications (2018-2022)
7.1 Global Octopus Revenue (USD Million) by Type (2018-2022)
7.1.1 Global Octopus Revenue (USD Million), Market Share (%) by Type (2018-2022)
7.2 Global Octopus Revenue (USD Million) by Applications (2018-2022)
7.2.1 Global Octopus Revenue (USD Million), Market Share (%) by Applications (2018-2022)
8 Global Octopus Development Regional Status and Outlook
8.1 Global Octopus Revenue (USD Million) By Regions (2018-2022)
8.2 North America Octopus Revenue (USD Million) by Type, and Application (2018-2022)
8.2.1 North America Octopus Revenue (USD Million) by Country (2018-2022)
8.2.2 North America Octopus Revenue (USD Million) by Type (2018-2022)
8.2.3 North America Octopus Revenue (USD Million) by Applications (2018-2022)
8.3 Europe Octopus Revenue (USD Million), by Type, and Applications (USD Million) (2018-2022)
8.3.1 Europe Octopus Revenue (USD Million), by Country (2018-2022)
8.3.2 Europe Octopus Revenue (USD Million) by Type (2018-2022)
8.3.3 Europe Octopus Revenue (USD Million) by Applications (2018-2022)
8.4 Asia Pacific Octopus Revenue (USD Million), and Revenue (USD Million) by Type, and Applications (2018-2022)
8.4.1 Asia Pacific Octopus Revenue (USD Million) by Country (2018-2022)
8.4.2 Asia Pacific Octopus Revenue (USD Million) by Type (2018-2022)
8.4.3 Asia Pacific Octopus Revenue (USD Million) by Applications (2018-2022)
8.5 South America Octopus Revenue (USD Million), by Type, and Applications (2018-2022)
8.5.1 South America Octopus Revenue (USD Million), by Country (2018-2022)
8.5.2 South America Octopus Revenue (USD Million) by Type (2018-2022)
8.5.3 South America Octopus Revenue (USD Million) by Applications (2018-2022)
8.6 Middle East and Africa Octopus Revenue (USD Million), by Type, Technology, Application, Thickness (2018-2022)
8.6.1 Middle East and Africa Octopus Revenue (USD Million) by Country (2018-2022)
8.6.2 Middle East and Africa Octopus Revenue (USD Million) by Type (2018-2022)
8.6.3 Middle East and Africa Octopus Revenue (USD Million) by Applications (2018-2022)
9 Company Profiles
10 Global Octopus Market Revenue (USD Million), by Type, and Applications (2024-2030)
10.1 Global Octopus Revenue (USD Million) and Market Share (%) by Type (2024-2030)
10.1.1 Global Octopus Revenue (USD Million), and Market Share (%) by Type (2024-2030)
10.2 Global Octopus Revenue (USD Million) and Market Share (%) by Applications (2024-2030)
10.2.1 Global Octopus Revenue (USD Million), and Market Share (%) by Applications (2024-2030)
11 Global Octopus Development Regional Status and Outlook Forecast
11.1 Global Octopus Revenue (USD Million) By Regions (2024-2030)
11.2 North America Octopus Revenue (USD Million) by Type, and Applications (2024-2030)
11.2.1 North America Octopus Revenue (USD) Million by Country (2024-2030)
11.2.2 North America Octopus Revenue (USD Million), by Type (2024-2030)
11.2.3 North America Octopus Revenue (USD Million), Market Share (%) by Applications (2024-2030)
11.3 Europe Octopus Revenue (USD Million), by Type, and Applications (2024-2030)
11.3.1 Europe Octopus Revenue (USD Million), by Country (2024-2030)
11.3.2 Europe Octopus Revenue (USD Million), by Type (2024-2030)
11.3.3 Europe Octopus Revenue (USD Million), by Applications (2024-2030)
11.4 Asia Pacific Octopus Revenue (USD Million) by Type, and Applications (2024-2030)
11.4.1 Asia Pacific Octopus Revenue (USD Million), by Country (2024-2030)
11.4.2 Asia Pacific Octopus Revenue (USD Million), by Type (2024-2030)
11.4.3 Asia Pacific Octopus Revenue (USD Million), by Applications (2024-2030)
11.5 South America Octopus Revenue (USD Million), by Type, and Applications (2024-2030)
11.5.1 South America Octopus Revenue (USD Million), by Country (2024-2030)
11.5.2 South America Octopus Revenue (USD Million), by Type (2024-2030)
11.5.3 South America Octopus Revenue (USD Million), by Applications (2024-2030)
11.6 Middle East and Africa Octopus Revenue (USD Million), by Type, and Applications (2024-2030)
11.6.1 Middle East and Africa Octopus Revenue (USD Million), by region (2024-2030)
11.6.2 Middle East and Africa Octopus Revenue (USD Million), by Type (2024-2030)
11.6.3 Middle East and Africa Octopus Revenue (USD Million), by Applications (2024-2030)
12 Methodology and Data Sources
12.1 Methodology/Research Approach
12.1.1 Research Programs/Design
12.1.2 Market Size Estimation
12.1.3 Market Breakdown and Data Triangulation
12.2 Data Sources
12.2.1 Secondary Sources
12.2.2 Primary Sources
12.3 Disclaimer
List of Tables
Table 1 Market Segmentation Analysis
Table 2 Global Octopus Market Companies with Areas Served
Table 3 Products Offerings Global Octopus Market
Table 4 Low Growth Scenario Forecasts
Table 5 Reference Case Growth Scenario
Table 6 High Growth Case Scenario
Table 7 Global Octopus Revenue (USD Million) And CAGR (%) By Type (2018-2030)
Table 8 Global Octopus Revenue (USD Million) And CAGR (%) By Applications (2018-2030)
Table 9 Global Octopus Revenue (USD Million) And CAGR (%) By Regions (2018-2030)
Table 10 Global Octopus Revenue (USD Million) By Type (2018-2022)
Table 11 Global Octopus Revenue Market Share (%) By Type (2018-2022)
Table 12 Global Octopus Revenue (USD Million) By Applications (2018-2022)
Table 13 Global Octopus Revenue Market Share (%) By Applications (2018-2022)
Table 14 Global Octopus Market Revenue (USD Million) By Regions (2018-2022)
Table 15 Global Octopus Market Share (%) By Regions (2018-2022)
Table 16 North America Octopus Revenue (USD Million) By Country (2018-2022)
Table 17 North America Octopus Revenue (USD Million) By Type (2018-2022)
Table 18 North America Octopus Revenue (USD Million) By Applications (2018-2022)
Table 19 Europe Octopus Revenue (USD Million) By Country (2018-2022)
Table 20 Europe Octopus Revenue (USD Million) By Type (2018-2022)
Table 21 Europe Octopus Revenue (USD Million) By Applications (2018-2022)
Table 22 Asia Pacific Octopus Revenue (USD Million) By Country (2018-2022)
Table 23 Asia Pacific Octopus Revenue (USD Million) By Type (2018-2022)
Table 24 Asia Pacific Octopus Revenue (USD Million) By Applications (2018-2022)
Table 25 South America Octopus Revenue (USD Million) By Country (2018-2022)
Table 26 South America Octopus Revenue (USD Million) By Type (2018-2022)
Table 27 South America Octopus Revenue (USD Million) By Applications (2018-2022)
Table 28 Middle East and Africa Octopus Revenue (USD Million) By Region (2018-2022)
Table 29 Middle East and Africa Octopus Revenue (USD Million) By Type (2018-2022)
Table 30 Middle East and Africa Octopus Revenue (USD Million) By Applications (2018-2022)
Table 31 Financial Analysis
Table 32 Global Octopus Revenue (USD Million) By Type (2024-2030)
Table 33 Global Octopus Revenue Market Share (%) By Type (2024-2030)
Table 34 Global Octopus Revenue (USD Million) By Applications (2024-2030)
Table 35 Global Octopus Revenue Market Share (%) By Applications (2024-2030)
Table 36 Global Octopus Market Revenue (USD Million), And Revenue (USD Million) By Regions (2024-2030)
Table 37 North America Octopus Revenue (USD)By Country (2024-2030)
Table 38 North America Octopus Revenue (USD Million) By Type (2024-2030)
Table 39 North America Octopus Revenue (USD Million) By Applications (2024-2030)
Table 40 Europe Octopus Revenue (USD Million) By Country (2024-2030)
Table 41 Europe Octopus Revenue (USD Million) By Type (2024-2030)
Table 42 Europe Octopus Revenue (USD Million) By Applications (2024-2030)
Table 43 Asia Pacific Octopus Revenue (USD Million) By Country (2024-2030)
Table 44 Asia Pacific Octopus Revenue (USD Million) By Type (2024-2030)
Table 45 Asia Pacific Octopus Revenue (USD Million) By Applications (2024-2030)
Table 46 South America Octopus Revenue (USD Million) By Country (2024-2030)
Table 47 South America Octopus Revenue (USD Million) By Type (2024-2030)
Table 48 South America Octopus Revenue (USD Million) By Applications (2024-2030)
Table 49 Middle East and Africa Octopus Revenue (USD Million) By Region (2024-2030)
Table 50 Middle East and Africa Octopus Revenue (USD Million) By Region (2024-2030)
Table 51 Middle East and Africa Octopus Revenue (USD Million) By Type (2024-2030)
Table 52 Middle East and Africa Octopus Revenue (USD Million) By Applications (2024-2030)
Table 53 Research Programs/Design for This Report
Table 54 Key Data Information from Secondary Sources
Table 55 Key Data Information from Primary Sources
List of Figures
Figure 1 Market Scope
Figure 2 Porter’s Five Forces
Figure 3 Global Octopus Revenue (USD Million) By Type (2018-2022)
Figure 4 Global Octopus Revenue Market Share (%) By Type (2022)
Figure 5 Global Octopus Revenue (USD Million) By Applications (2018-2022)
Figure 6 Global Octopus Revenue Market Share (%) By Applications (2022)
Figure 7 Global Octopus Market Revenue (USD Million) By Regions (2018-2022)
Figure 8 Global Octopus Market Share (%) By Regions (2022)
Figure 9 North America Octopus Revenue (USD Million) By Country (2018-2022)
Figure 10 North America Octopus Revenue (USD Million) By Type (2018-2022)
Figure 11 North America Octopus Revenue (USD Million) By Applications (2018-2022)
Figure 12 Europe Octopus Revenue (USD Million) By Country (2018-2022)
Figure 13 Europe Octopus Revenue (USD Million) By Type (2018-2022)
Figure 14 Europe Octopus Revenue (USD Million) By Applications (2018-2022)
Figure 15 Asia Pacific Octopus Revenue (USD Million) By Country (2018-2022)
Figure 16 Asia Pacific Octopus Revenue (USD Million) By Type (2018-2022)
Figure 17 Asia Pacific Octopus Revenue (USD Million) By Applications (2018-2022)
Figure 18 South America Octopus Revenue (USD Million) By Country (2018-2022)
Figure 19 South America Octopus Revenue (USD Million) By Type (2018-2022)
Figure 20 South America Octopus Revenue (USD Million) By Applications (2018-2022)
Figure 21 Middle East and Africa Octopus Revenue (USD Million) By Region (2018-2022)
Figure 22 Middle East and Africa Octopus Revenue (USD Million) By Type (2018-2022)
Figure 23 Middle East and Africa Octopus Revenue (USD Million) By Applications (2018-2022)
Figure 24 Global Octopus Revenue (USD Million) By Type (2024-2030)
Figure 25 Global Octopus Revenue Market Share (%) By Type (2030)
Figure 26 Global Octopus Revenue (USD Million) By Applications (2024-2030)
Figure 27 Global Octopus Revenue Market Share (%) By Applications (2030)
Figure 28 Global Octopus Market Revenue (USD Million) By Regions (2024-2030)
Figure 29 North America Octopus Revenue (USD Million) By Country (2024-2030)
Figure 30 North America Octopus Revenue (USD Million) By Type (2024-2030)
Figure 31 North America Octopus Revenue (USD Million) By Applications (2024-2030)
Figure 32 Europe Octopus Revenue (USD Million) By Country (2024-2030)
Figure 33 Europe Octopus Revenue (USD Million) By Type (2024-2030)
Figure 34 Europe Octopus Revenue (USD Million) By Applications (2024-2030)
Figure 35 Asia Pacific Octopus Revenue (USD Million) By Country (2024-2030)
Figure 36 Asia Pacific Octopus Revenue (USD Million) By Type (2024-2030)
Figure 37 Asia Pacific Octopus Revenue (USD Million) By Applications (2024-2030)
Figure 38 South America Octopus Revenue (USD Million) By Country (2024-2030)
Figure 39 South America Octopus Revenue (USD Million) By Type (2024-2030)
Figure 40 South America Octopus Revenue (USD Million) By Applications (2024-2030)
Figure 41 Middle East and Africa Octopus Revenue (USD Million) By Region (2024-2030)
Figure 42 Middle East and Africa Octopus Revenue (USD Million) By Region (2024-2030)
Figure 43 Middle East and Africa Octopus Revenue (USD Million) By Type (2024-2030)
Figure 44 Middle East and Africa Octopus Revenue (USD Million) By Applications (2024-2030)
Figure 45 Bottom-Up and Top-Down Approaches for This Report
Figure 46 Data Triangulation
