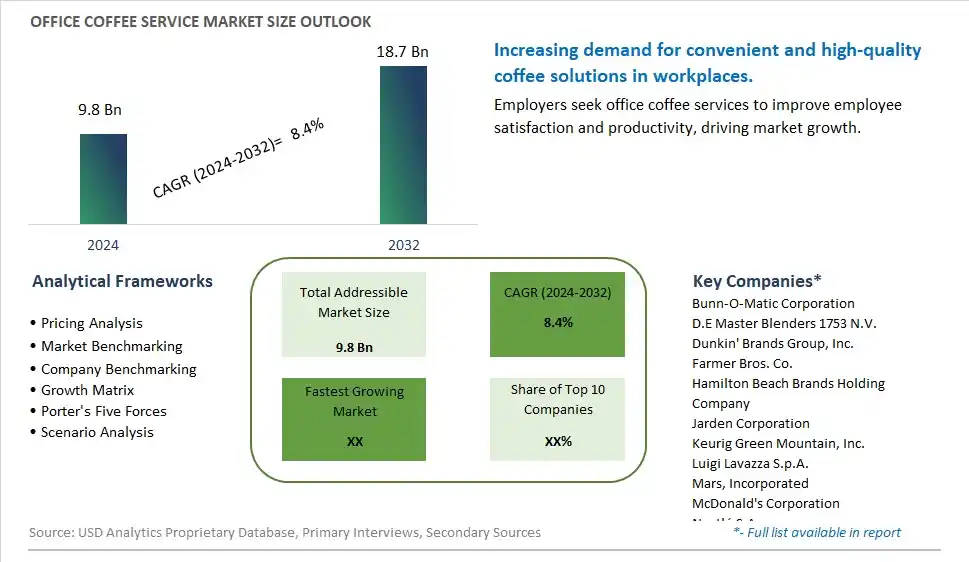
Global Office Coffee Service Market Size is valued at $9.8 Billion in 2024 and is forecast to register a growth rate (CAGR) of 8.4% to reach $18.7 Billion by 2032.
The global Office Coffee Service Market Comprehensive Study analyzes and forecasts the market size across 6 regions and 24 countries for diverse segments -By Product (Coffee making machines, Coffee brewers, Food making machines, To-go supplies, Coffee flavoring syrups and condiments), By Application (Cafe, Restaurant, Office Building, Mall), By Distribution Channel (Online, Offline), By Price Range (Low, Medium, High)
An Introduction to Office Coffee Service Market
In 2024, the office coffee service market is thriving, fueled by the demand for high-quality coffee solutions in workplace environments. Office coffee services, offering a range of coffee options, equipment, and maintenance, cater to the growing need for convenient and premium coffee experiences at work. The market benefits from innovations in coffee brewing technology and service delivery that enhance quality and convenience. The trend towards clean label and natural ingredients is influencing product development. Increasing consumer interest in specialty coffee and the importance of employee satisfaction are further supporting market growth.
Office Coffee Service Competitive Landscape
The market report analyses the leading companies in the industry including Bunn-O-Matic Corporation, D.E Master Blenders 1753 N.V., Dunkin' Brands Group, Inc., Farmer Bros. Co., Hamilton Beach Brands Holding Company, Jarden Corporation, Keurig Green Mountain, Inc., Luigi Lavazza S.p.A., Mars, Incorporated, McDonald's Corporation, Nestlé S.A., Pacific Coffee Company, Peet's Coffee & Tea, Inc., Royal Cup Coffee & Tea, Starbucks Corporation, The Coca-Cola Company, and Others.
Office Coffee Service Market Dynamics
Office Coffee Service Market Trend: Increasing Demand for Premium and Specialty Coffees
The most prominent trend in the Office Coffee Service Market is the increasing demand for premium and specialty coffees. Office coffee services are evolving to offer high-quality coffee options, including single-origin, fair-trade, and artisanal blends, driven by the desire for a better coffee experience at work. This trend is fueled by the growing appreciation for gourmet coffee and the willingness of employers to invest in employee satisfaction.
Office Coffee Service Market Driver: Employee Well-Being and Productivity
A key driver in the Office Coffee Service Market is the focus on employee well-being and productivity. As more companies recognize the impact of a positive work environment on employee performance and morale, there is a rising demand for office coffee services that provide high-quality beverages and enhance the workplace experience. This demand supports the growth of the market as businesses seek to improve employee satisfaction and retention.
Office Coffee Service Market Opportunity: Innovation in Coffee Equipment and Technology
One significant opportunity in the Office Coffee Service Market lies in innovation in coffee equipment and technology. Companies can offer advanced coffee machines that provide a variety of brewing options, such as espresso, cold brew, and specialty drinks, and integrate with smart technology for customization and convenience. By providing state-of-the-art coffee solutions, manufacturers can attract businesses looking to enhance their office environment and drive market growth.
Office Coffee Service Market Share Analysis- Largest Segment by Product
In the Office Coffee Service Market, Coffee Making Machines is the largest segment. The dominance of this segment is attributed to the essential role coffee machines play in office settings, where they provide a crucial service by ensuring a steady supply of coffee for employees. Coffee making machines, including single-serve, drip, and espresso machines, are integral to office coffee services, catering to diverse preferences and requirements. The continual innovation in coffee machines and their ability to handle high volumes of coffee contribute to their leading market position.
Office Coffee Service Market Share Analysis- Fastest Growing Segment by Application
In the Office Coffee Service Market, Office Building is poised to grow the fastest over the next five years. This growth is driven by the increasing focus on employee satisfaction and productivity, with office environments enhancing their amenities to provide better coffee services. Companies are investing in high-quality coffee solutions to boost workplace morale and create a more engaging and comfortable work environment. The rise in remote work and hybrid work models also emphasizes the need for robust office coffee services to support flexible and in-office employees, further driving growth in this segment.
Office Coffee Service Market Share Analysis- Largest Segment by Distribution Channel
In the Office Coffee Service Market, Offline distribution channels represent the largest segment. The preference for offline channels is due to the immediate and tangible nature of purchasing coffee supplies, which allows businesses to ensure they have a consistent and reliable supply of products. Physical retail stores and service providers offer personalized support, maintenance, and quick replenishment, which are crucial for businesses that rely on continuous coffee service. The established relationships between vendors and businesses, along with the ability to handle bulk orders, contribute to the dominance of offline channels in this market.
Office Coffee Service Market Share Analysis- Fastest Growing Segment by Price Range
In the Office Coffee Service Market, High Price Range products are poised to grow the fastest over the next five years. This trend is driven by increasing investments from businesses in premium coffee solutions that offer superior quality, variety, and convenience. As companies continue to focus on enhancing employee satisfaction and creating a more engaging office environment, there is a growing demand for high-end coffee services that provide gourmet coffee and advanced brewing equipment. Additionally, the rise of specialty coffees and the increasing popularity of sustainable and ethically sourced products are contributing to the shift towards higher-priced coffee services. This segment’s growth reflects a broader trend towards investing in premium workplace amenities and enhancing the overall employee experience.
Office Coffee Service Market Segmentation
By Product
Coffee making machines
Coffee brewers
Food making machines
To-go supplies
Coffee flavoring syrups and condiments
By Application
Cafe
Restaurant
Office Building
Mall
By Distribution Channel
Online
Offline
By Price Range
Low
Medium
High
Countries Analyzed
North America (US, Canada, Mexico)
Europe (Germany, UK, France, Spain, Italy, Russia, Rest of Europe)
Asia Pacific (China, India, Japan, South Korea, Australia, South East Asia, Rest of Asia)
South America (Brazil, Argentina, Rest of South America)
Middle East and Africa (Saudi Arabia, UAE, Rest of Middle East, South Africa, Egypt, Rest of Africa)
Office Coffee Service Companies Profiled in the Study
Bunn-O-Matic Corporation
D.E Master Blenders 1753 N.V.
Dunkin' Brands Group, Inc.
Farmer Bros. Co.
Hamilton Beach Brands Holding Company
Jarden Corporation
Keurig Green Mountain, Inc.
Luigi Lavazza S.p.A.
Mars, Incorporated
McDonald's Corporation
Nestlé S.A.
Pacific Coffee Company
Peet's Coffee & Tea, Inc.
Royal Cup Coffee & Tea
Starbucks Corporation
The Coca-Cola Company
*- List Not Exhaustive
Chapter 1. TABLE OF CONTENTS
Chapter 2. Introduction to Office Coffee Service Market
2.1. Market Overview
2.2. Key Statistics and Report Highlights
2.3. Scope of the Comprehensive Study
2.3.1. Market Definition
2.3.2 Countries and Regions Covered
2.3.3 Research Objective
2.3.4 Units, Currency, and Conversions
2.3.5 Industry Value Chain
2.4. Key Market Segments
2.5. Key Companies
2.6. Study Period
Chapter 3. Strategic Analysis Review
3.1. Office Coffee Service Pricing Analysis and Forecast
3.2. Porter’s Five Forces
3.3. Market Ecosystem
3.4. SWOT Analysis
3.5. Regulatory Scenario
3.3. Effects of Inflation, Russia-Ukraine War, moderating economic growth, and other macroeconomic factors
Chapter 4. Competitive Landscape
4.1. Market Share Analysis
4.1.1. Global Office Coffee Service Market Share by Company, 2023
4.1.2. Product Offerings of Leading Office Coffee Service Companies
4.2. Market Entropy
4.2.1. New Product Launches in the Industry
4.2.2. Mergers, Acquisitions, Joint ventures, and Partnerships
4.3. Key Strategies and Best Practices
Chapter 5. Global Market Projections: Best, Reference, and Low Case Scenarios
5.1. Growth Analysis- Case Scenario Definitions
5.2. Low Growth Case Scenario Forecasts
5.3. Reference Growth Case Scenario Forecasts
5.4. High Growth Case Scenario Forecasts
Chapter 6. Market Dynamics
6.1. Office Coffee Service Market Drivers
6.2. Office Coffee Service Market Challenges
6.6. Office Coffee Service Market Opportunities
6.4. Office Coffee Service Market Trends
Chapter 7. Global Office Coffee Service Market Outlook Trends
7.1. Global Office Coffee Service Revenue (USD Million) and CAGR (%) by Type (2021-2032)
7.2. Global Office Coffee Service Revenue (USD Million) and CAGR (%) by Application (2021-2032)
7.3. Global Office Coffee Service Revenue (USD Million) and CAGR (%) by Product (2021-2032)
By Product
Coffee making machines
Coffee brewers
Food making machines
To-go supplies
Coffee flavoring syrups and condiments
By Application
Cafe
Restaurant
Office Building
Mall
By Distribution Channel
Online
Offline
By Price Range
Low
Medium
High
Chapter 8. Global Office Coffee Service Regional Analysis and Outlook
8.1. Global Office Coffee Service Revenue (USD Million) By Regions (2021- 2032)
8.2. North America Office Coffee Service Revenue (USD Million) by Country (2021-2032)
8.2.1. United States Office Coffee Service Regional Analysis and Outlook
8.2.2. Canada Office Coffee Service Regional Analysis and Outlook
8.2.3. Mexico Office Coffee Service Regional Analysis and Outlook
8.3. Europe Office Coffee Service Revenue (USD Million), by Country (2021-2032)
8.3.1. Germany Office Coffee Service Regional Analysis and Outlook
8.3.2. France Office Coffee Service Regional Analysis and Outlook
8.3.3. United Kingdom Office Coffee Service Regional Analysis and Outlook
8.3.4. Spain Office Coffee Service Regional Analysis and Outlook
8.3.5. Italy Office Coffee Service Regional Analysis and Outlook
8.3.6. Russia Office Coffee Service Regional Analysis and Outlook
8.3.7. Rest of Europe Office Coffee Service Regional Analysis and Outlook
8.4. Asia Pacific Office Coffee Service Revenue (USD Million) by Country (2021-2032)
8.4.1. China Office Coffee Service Regional Analysis and Outlook
8.4.2. Japan Office Coffee Service Regional Analysis and Outlook
8.4.3. India Office Coffee Service Regional Analysis and Outlook
8.4.4. South Korea Office Coffee Service Regional Analysis and Outlook
8.4.5. Australia Office Coffee Service Regional Analysis and Outlook
8.4.6. South East Asia Office Coffee Service Regional Analysis and Outlook
8.4.7. Rest of Asia Pacific Office Coffee Service Regional Analysis and Outlook
8.5. South America Office Coffee Service Revenue (USD Million), by Country (2021-2032)
8.5.1. Brazil Office Coffee Service Regional Analysis and Outlook
8.5.2. Argentina Office Coffee Service Regional Analysis and Outlook
8.5.3. Rest of South America Office Coffee Service Regional Analysis and Outlook
8.6. Middle East and Africa Office Coffee Service Revenue (USD Million) by Country (2021-2032)
8.6.1. Middle East Office Coffee Service Regional Analysis and Outlook
8.6.2. Africa Office Coffee Service Regional Analysis and Outlook
Chapter 9. North America Office Coffee Service Analysis and Outlook
9.1. North America Office Coffee Service Revenue (USD Million) by Segments (2021-2032)
9.1.1. North America Office Coffee Service Revenue (USD Million) by Type (2021-2032)
9.1.2. North America Office Coffee Service Revenue (USD Million) by Application (2021-2032)
9.1.3. North America Office Coffee Service Revenue (USD Million) by Product (2021-2032)
By Product
Coffee making machines
Coffee brewers
Food making machines
To-go supplies
Coffee flavoring syrups and condiments
By Application
Cafe
Restaurant
Office Building
Mall
By Distribution Channel
Online
Offline
By Price Range
Low
Medium
High
Chapter 10. Europe Office Coffee Service Analysis and Outlook
10.1. Europe Office Coffee Service Revenue (USD Million), by Segments (USD Million) (2021-2032)
10.1.1. Europe Office Coffee Service Revenue (USD Million) by Type (2021-2032)
10.1.2. Europe Office Coffee Service Revenue (USD Million) by Application (2021-2032)
10.1.3. Europe Office Coffee Service Revenue (USD Million) by Product (2021-2032)
By Product
Coffee making machines
Coffee brewers
Food making machines
To-go supplies
Coffee flavoring syrups and condiments
By Application
Cafe
Restaurant
Office Building
Mall
By Distribution Channel
Online
Offline
By Price Range
Low
Medium
High
Chapter 11. Asia Pacific Office Coffee Service Analysis and Outlook
11.1. Asia Pacific Office Coffee Service Revenue (USD Million), and Revenue (USD Million) by Segments (2021-2032)
11.1.1. Asia Pacific Office Coffee Service Revenue (USD Million) by Type (2021-2032)
11.1.2. Asia Pacific Office Coffee Service Revenue (USD Million) by Application (2021-2032)
11.1.3. Asia Pacific Office Coffee Service Revenue (USD Million) by Product (2021-2032)
By Product
Coffee making machines
Coffee brewers
Food making machines
To-go supplies
Coffee flavoring syrups and condiments
By Application
Cafe
Restaurant
Office Building
Mall
By Distribution Channel
Online
Offline
By Price Range
Low
Medium
High
Chapter 12. South America Office Coffee Service Analysis and Outlook
12.1. South America Office Coffee Service Revenue (USD Million), by Segments (2021-2032)
12.1.1. South America Office Coffee Service Revenue (USD Million) by Type (2021-2032)
12.1.2. South America Office Coffee Service Revenue (USD Million) by Application (2021-2032)
12.1.3. South America Office Coffee Service Revenue (USD Million) by Product (2021-2032)
By Product
Coffee making machines
Coffee brewers
Food making machines
To-go supplies
Coffee flavoring syrups and condiments
By Application
Cafe
Restaurant
Office Building
Mall
By Distribution Channel
Online
Offline
By Price Range
Low
Medium
High
Chapter 13. Middle East and Africa Office Coffee Service Analysis and Outlook
13.1. Middle East and Africa Office Coffee Service Revenue (USD Million), by Segments (2021-2032)
13.1.1. Middle East and Africa Office Coffee Service Revenue (USD Million) by Type (2021-2032)
13.1.2. Middle East and Africa Office Coffee Service Revenue (USD Million) by Application (2021-2032)
13.1.3. Middle East and Africa Office Coffee Service Revenue (USD Million) by Product (2021-2032)
By Product
Coffee making machines
Coffee brewers
Food making machines
To-go supplies
Coffee flavoring syrups and condiments
By Application
Cafe
Restaurant
Office Building
Mall
By Distribution Channel
Online
Offline
By Price Range
Low
Medium
High
Chapter 14. Office Coffee Service Company Profiles
14.1 Business Overview
14.2 Product Profiles
14.3 SWOT Profiles
14.5 Recent Developments
14.6 Financial Profile
List of Companies
Bunn-O-Matic Corporation
D.E Master Blenders 1753 N.V.
Dunkin' Brands Group, Inc.
Farmer Bros. Co.
Hamilton Beach Brands Holding Company
Jarden Corporation
Keurig Green Mountain, Inc.
Luigi Lavazza S.p.A.
Mars, Incorporated
McDonald's Corporation
Nestlé S.A.
Pacific Coffee Company
Peet's Coffee & Tea, Inc.
Royal Cup Coffee & Tea
Starbucks Corporation
The Coca-Cola Company
15. Methodology and Data Sources
15.1 Customization Offerings
15.2 Subscription Services
15.3 Related Reports
15.4 Publisher Expertise
LIST OF TABLES
Table 1 Market Segmentation Analysis
Table 2 Global Office Coffee Service Market Share of Leading Companies, 2023
Table 3 Product Offerings of Leading Companies
Table 4 Low Growth Scenario Forecasts
Table 5 Reference Case Growth Scenario
Table 6 High Growth Case Scenario
Table 7 Global Office Coffee Service Revenue (USD Million) And CAGR (%) By Type (2021-2032)
Table 8 Global Office Coffee Service Revenue (USD Million) And CAGR (%) By Application (2021-2032)
Table 9 Global Office Coffee Service Revenue (USD Million) And CAGR (%) By Product (2021-2032)
Table 10 Global Office Coffee Service Market Revenue (USD Million) By Regions (2021-2032)
Table 11 Global Office Coffee Service Market Share (%) By Regions (2021-2032)
Table 12 North America Office Coffee Service Revenue (USD Million) By Country (2021-2032)
Table 13 Europe Office Coffee Service Revenue (USD Million) By Country (2021-2032)
Table 14 Asia Pacific Office Coffee Service Revenue (USD Million) By Country (2021-2032)
Table 15 South America Office Coffee Service Revenue (USD Million) By Country (2021-2032)
Table 16 Middle East and Africa Office Coffee Service Revenue (USD Million) By Region (2021-2032)
Table 17 North America Office Coffee Service Revenue (USD Million) By Type (2021-2032)
Table 18 North America Office Coffee Service Revenue (USD Million) By Application (2021-2032)
Table 19 North America Office Coffee Service Revenue (USD Million) By Product (2021-2032)
Table 20 Europe Office Coffee Service Revenue (USD Million) By Type (2021-2032)
Table 21 Europe Office Coffee Service Revenue (USD Million) By Application (2021-2032)
Table 22 Europe Office Coffee Service Revenue (USD Million) By Product (2021-2032)
Table 23 Asia Pacific Office Coffee Service Revenue (USD Million) By Type (2021-2032)
Table 24 Asia Pacific Office Coffee Service Revenue (USD Million) By Application (2021-2032)
Table 25 Asia Pacific Office Coffee Service Revenue (USD Million) By Product (2021-2032)
Table 26 South America Office Coffee Service Revenue (USD Million) By Type (2021-2032)
Table 27 South America Office Coffee Service Revenue (USD Million) By Application (2021-2032)
Table 28 South America Office Coffee Service Revenue (USD Million) By Product (2021-2032)
Table 29 Middle East and Africa Office Coffee Service Revenue (USD Million) By Type (2021-2032)
Table 30 Middle East and Africa Office Coffee Service Revenue (USD Million) By Application (2021-2032)
Table 31 Middle East and Africa Office Coffee Service Revenue (USD Million) By Product (2021-2032)
LIST OF FIGURES
Figure 1. Market Scope
Figure 2. Pricing Forecasts Per Unit, 2023- 2032
Figure 3. Porter’s Five Forces
Figure 4. Global Office Coffee Service Market Revenue (USD Million) By Regions (2021-2032)
Figure 5. Global Office Coffee Service Market Share (%) By Regions (2023)
Figure 6. North America Office Coffee Service Revenue (USD Million) By Country (2021-2032)
Figure 7. United States Office Coffee Service Revenue (USD Million) By Country (2021-2032)
Figure 8. Canada Office Coffee Service Revenue (USD Million) By Country (2021-2032)
Figure 9. Mexico Office Coffee Service Revenue (USD Million) By Country (2021-2032)
Figure 10. Europe Office Coffee Service Revenue (USD Million) By Country (2021-2032)
Figure 11. Germany Office Coffee Service Revenue (USD Million) By Country (2021-2032)
Figure 12. France Office Coffee Service Revenue (USD Million) By Country (2021-2032)
Figure 13. United Kingdom Office Coffee Service Revenue (USD Million) By Country (2021-2032)
Figure 14. Spain Office Coffee Service Revenue (USD Million) By Country (2021-2032)
Figure 15. Italy Office Coffee Service Revenue (USD Million) By Country (2021-2032)
Figure 16. Russia Office Coffee Service Revenue (USD Million) By Country (2021-2032)
Figure 17. Rest of Europe Office Coffee Service Revenue (USD Million) By Country (2021-2032)
Figure 11. Asia Pacific Office Coffee Service Revenue (USD Million) By Country (2021-2032)
Figure 12. China Office Coffee Service Revenue (USD Million) By Country (2021-2032)
Figure 13. Japan Office Coffee Service Revenue (USD Million) By Country (2021-2032)
Figure 14. India Office Coffee Service Revenue (USD Million) By Country (2021-2032)
Figure 15. South Korea Office Coffee Service Revenue (USD Million) By Country (2021-2032)
Figure 16. Australia Office Coffee Service Revenue (USD Million) By Country (2021-2032)
Figure 17. South East Asia Office Coffee Service Revenue (USD Million) By Country (2021-2032)
Figure 18. South America Office Coffee Service Revenue (USD Million) By Country (2021-2032)
Figure 19. Brazil Office Coffee Service Revenue (USD Million) By Country (2021-2032)
Figure 20. Argentina Office Coffee Service Revenue (USD Million) By Country (2021-2032)
Figure 21. Rest of Asia Pacific Office Coffee Service Revenue (USD Million) By Country (2021-2032)
Figure 22. Middle East and Africa Office Coffee Service Revenue (USD Million) By Region (2021-2032)
Figure 23. Saudi Arabia Office Coffee Service Revenue (USD Million) By Region (2021-2032)
Figure 24. The UAE Office Coffee Service Revenue (USD Million) By Region (2021-2032)
Figure 25. Rest of Middle East Office Coffee Service Revenue (USD Million) By Region (2021-2032)
Figure 26. South Africa Office Coffee Service Revenue (USD Million) By Region (2021-2032)
Figure 27. Africa Office Coffee Service Revenue (USD Million) By Region (2021-2032)
Figure 28. North America Office Coffee Service Revenue (USD Million) By Type (2021-2032)
Figure 29. North America Office Coffee Service Revenue (USD Million) By Application (2021-2032)
Figure 30. North America Office Coffee Service Revenue (USD Million) By Product (2021-2032)
Figure 31. Europe Office Coffee Service Revenue (USD Million) By Type (2021-2032)
Figure 32. Europe Office Coffee Service Revenue (USD Million) By Application (2021-2032)
Figure 33. Europe Office Coffee Service Revenue (USD Million) By Product (2021-2032)
Figure 34. Asia Pacific Office Coffee Service Revenue (USD Million) By Type (2021-2032)
Figure 35. Asia Pacific Office Coffee Service Revenue (USD Million) By Application (2021-2032)
Figure 36. Asia Pacific Office Coffee Service Revenue (USD Million) By Product (2021-2032)
Figure 37. South America Office Coffee Service Revenue (USD Million) By Type (2021-2032)
Figure 38. South America Office Coffee Service Revenue (USD Million) By Application (2021-2032)
Figure 39. South America Office Coffee Service Revenue (USD Million) By Product (2021-2032)
Figure 40. Middle East and Africa Office Coffee Service Revenue (USD Million) By Type (2021-2032)
Figure 41. Middle East and Africa Office Coffee Service Revenue (USD Million) By Application (2021-2032)
Figure 42. Middle East and Africa Office Coffee Service Revenue (USD Million) By Product (2021-2032)
By Product
Coffee making machines
Coffee brewers
Food making machines
To-go supplies
Coffee flavoring syrups and condiments
By Application
Cafe
Restaurant
Office Building
Mall
By Distribution Channel
Online
Offline
By Price Range
Low
Medium
High
Countries Analyzed
North America (US, Canada, Mexico)
Europe (Germany, UK, France, Spain, Italy, Russia, Rest of Europe)
Asia Pacific (China, India, Japan, South Korea, Australia, South East Asia, Rest of Asia)
South America (Brazil, Argentina, Rest of South America)
Middle East and Africa (Saudi Arabia, UAE, Rest of Middle East, South Africa, Egypt, Rest of Africa)
