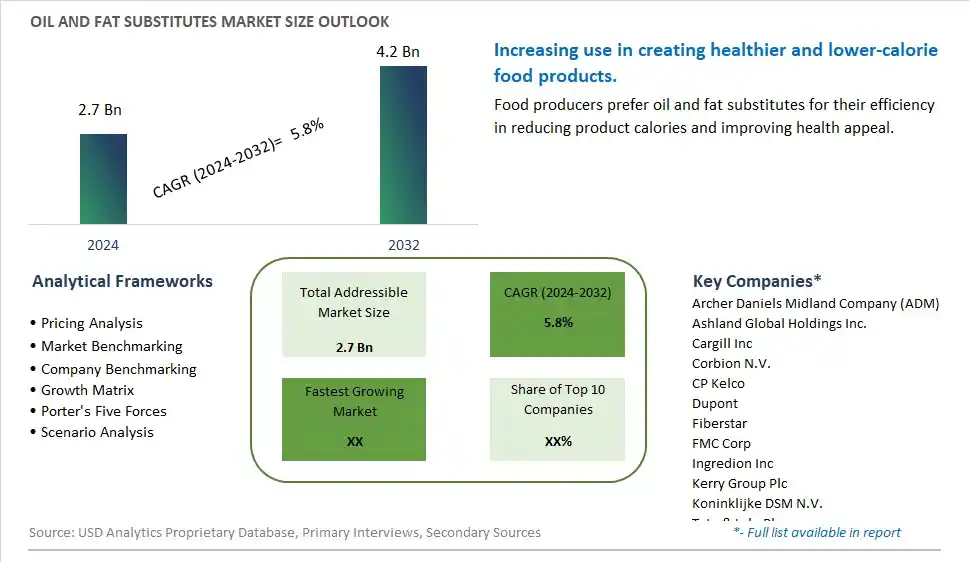
Global Oil and Fat Substitutes Market Size is valued at $2.7 Billion in 2024 and is forecast to register a growth rate (CAGR) of 5.8% to reach $4.2 Billion by 2032.
The global Oil and Fat Substitutes Market Comprehensive Study analyzes and forecasts the market size across 6 regions and 24 countries for diverse segments -By Type (Plant, Animal), By Application (Bakery & Confectionery Products, Dairy & Frozen Desserts, Convenience Foods & Beverages, Sauces, Dressings, and Spreads, Others)
An Introduction to Oil and Fat Substitutes Market
In 2024, the oil and fat substitutes market is thriving, fueled by the demand for healthier alternatives to traditional oils and fats in cooking and baking. Oil and fat substitutes, derived from ingredients like plant fibers, proteins, and starches, offer reduced-calorie options without compromising on taste and texture. The market benefits from innovations in formulation and processing technologies that enhance product functionality and appeal. The trend towards clean label and natural ingredients is influencing product development. Increasing consumer interest in weight management and healthful eating, supported by the popularity of low-fat and low-calorie foods, is further supporting market growth.
Oil and Fat Substitutes Competitive Landscape
The market report analyses the leading companies in the industry including Archer Daniels Midland Company (ADM), Ashland Global Holdings Inc., Cargill Inc, Corbion N.V., CP Kelco, Dupont, Fiberstar, FMC Corp, Ingredion Inc, Kerry Group Plc, Koninklijke DSM N.V., Tate & Lyle Plc, and Others.
Oil and Fat Substitutes Market Dynamics
Oil and Fat Substitutes Market Trend: Increasing Use of Healthy Alternatives in Food Production
The most prominent trend in the Oil and Fat Substitutes Market is the increasing use of healthy alternatives in food production. Consumers are seeking products that provide the taste and texture of traditional fats and oils without the associated health risks. This trend is driven by the desire for healthier food options that support weight management and cardiovascular health.
Oil and Fat Substitutes Market Driver: Health Consciousness and Dietary Changes
A key driver in the Oil and Fat Substitutes Market is health consciousness and dietary changes. As more individuals focus on reducing their intake of unhealthy fats and calories, there is a rising demand for oil and fat substitutes that offer similar culinary properties but with better nutritional profiles. This demand supports the growth of the market as consumers seek to improve their diet and overall health.
Oil and Fat Substitutes Market Opportunity: Innovation in Formulations and Applications
One significant opportunity in the Oil and Fat Substitutes Market lies in innovation in formulations and applications. Companies can develop new products that utilize natural ingredients and advanced processing techniques to create substitutes that closely mimic the taste and functionality of traditional fats and oils. By offering versatile and health-focused options, manufacturers can attract a broader consumer base and drive market growth.
Oil and Fat Substitutes Market Share Analysis- Largest Segment by Type
In the Oil and Fat Substitutes Market, Plant-based substitutes are the largest segment. This dominance is driven by the rising consumer awareness and preference for healthier, plant-based alternatives to traditional animal fats. Plant-based oils and fats are often perceived as more sustainable and health-conscious options, aligning with the growing trend towards plant-based diets and reducing animal product consumption. The shift towards plant-based substitutes is supported by their versatility and functionality in various food applications, further solidifying their position as the largest segment in the market.
Oil and Fat Substitutes Market Share Analysis- Fastest Growing Segment by Application
In the Oil and Fat Substitutes Market, Bakery & Confectionery Products is poised to grow the fastest over the next five years. This growth is driven by the increasing demand for healthier baked goods and confectionery items that use lower-fat or plant-based alternatives. As consumers become more health-conscious and seek to reduce saturated fat intake, there is a growing preference for oil and fat substitutes that meet these dietary needs without compromising on taste or texture. This segment’s expansion reflects broader trends towards healthier eating and the reformulation of traditional baked goods to align with these dietary preferences.
Oil and Fat Substitutes Market Segmentation
By Type
Plant
Animal
By Application
Bakery & Confectionery Products
Dairy & Frozen Desserts
Convenience Foods & Beverages
Sauces, Dressings, and Spreads
Others
Countries Analyzed
North America (US, Canada, Mexico)
Europe (Germany, UK, France, Spain, Italy, Russia, Rest of Europe)
Asia Pacific (China, India, Japan, South Korea, Australia, South East Asia, Rest of Asia)
South America (Brazil, Argentina, Rest of South America)
Middle East and Africa (Saudi Arabia, UAE, Rest of Middle East, South Africa, Egypt, Rest of Africa)
Oil and Fat Substitutes Companies Profiled in the Study
Archer Daniels Midland Company (ADM)
Ashland Global Holdings Inc.
Cargill Inc
Corbion N.V.
CP Kelco
Dupont
Fiberstar
FMC Corp
Ingredion Inc
Kerry Group Plc
Koninklijke DSM N.V.
Tate & Lyle Plc
*- List Not Exhaustive
Chapter 1. TABLE OF CONTENTS
Chapter 2. Introduction to Oil and Fat Substitutes Market
2.1. Market Overview
2.2. Key Statistics and Report Highlights
2.3. Scope of the Comprehensive Study
2.3.1. Market Definition
2.3.2 Countries and Regions Covered
2.3.3 Research Objective
2.3.4 Units, Currency, and Conversions
2.3.5 Industry Value Chain
2.4. Key Market Segments
2.5. Key Companies
2.6. Study Period
Chapter 3. Strategic Analysis Review
3.1. Oil and Fat Substitutes Pricing Analysis and Forecast
3.2. Porter’s Five Forces
3.3. Market Ecosystem
3.4. SWOT Analysis
3.5. Regulatory Scenario
3.3. Effects of Inflation, Russia-Ukraine War, moderating economic growth, and other macroeconomic factors
Chapter 4. Competitive Landscape
4.1. Market Share Analysis
4.1.1. Global Oil and Fat Substitutes Market Share by Company, 2023
4.1.2. Product Offerings of Leading Oil and Fat Substitutes Companies
4.2. Market Entropy
4.2.1. New Product Launches in the Industry
4.2.2. Mergers, Acquisitions, Joint ventures, and Partnerships
4.3. Key Strategies and Best Practices
Chapter 5. Global Market Projections: Best, Reference, and Low Case Scenarios
5.1. Growth Analysis- Case Scenario Definitions
5.2. Low Growth Case Scenario Forecasts
5.3. Reference Growth Case Scenario Forecasts
5.4. High Growth Case Scenario Forecasts
Chapter 6. Market Dynamics
6.1. Oil and Fat Substitutes Market Drivers
6.2. Oil and Fat Substitutes Market Challenges
6.6. Oil and Fat Substitutes Market Opportunities
6.4. Oil and Fat Substitutes Market Trends
Chapter 7. Global Oil and Fat Substitutes Market Outlook Trends
7.1. Global Oil and Fat Substitutes Revenue (USD Million) and CAGR (%) by Type (2021-2032)
7.2. Global Oil and Fat Substitutes Revenue (USD Million) and CAGR (%) by Application (2021-2032)
7.3. Global Oil and Fat Substitutes Revenue (USD Million) and CAGR (%) by Product (2021-2032)
By Type
Plant
Animal
By Application
Bakery & Confectionery Products
Dairy & Frozen Desserts
Convenience Foods & Beverages
Sauces, Dressings, and Spreads
Others
Chapter 8. Global Oil and Fat Substitutes Regional Analysis and Outlook
8.1. Global Oil and Fat Substitutes Revenue (USD Million) By Regions (2021- 2032)
8.2. North America Oil and Fat Substitutes Revenue (USD Million) by Country (2021-2032)
8.2.1. United States Oil and Fat Substitutes Regional Analysis and Outlook
8.2.2. Canada Oil and Fat Substitutes Regional Analysis and Outlook
8.2.3. Mexico Oil and Fat Substitutes Regional Analysis and Outlook
8.3. Europe Oil and Fat Substitutes Revenue (USD Million), by Country (2021-2032)
8.3.1. Germany Oil and Fat Substitutes Regional Analysis and Outlook
8.3.2. France Oil and Fat Substitutes Regional Analysis and Outlook
8.3.3. United Kingdom Oil and Fat Substitutes Regional Analysis and Outlook
8.3.4. Spain Oil and Fat Substitutes Regional Analysis and Outlook
8.3.5. Italy Oil and Fat Substitutes Regional Analysis and Outlook
8.3.6. Russia Oil and Fat Substitutes Regional Analysis and Outlook
8.3.7. Rest of Europe Oil and Fat Substitutes Regional Analysis and Outlook
8.4. Asia Pacific Oil and Fat Substitutes Revenue (USD Million) by Country (2021-2032)
8.4.1. China Oil and Fat Substitutes Regional Analysis and Outlook
8.4.2. Japan Oil and Fat Substitutes Regional Analysis and Outlook
8.4.3. India Oil and Fat Substitutes Regional Analysis and Outlook
8.4.4. South Korea Oil and Fat Substitutes Regional Analysis and Outlook
8.4.5. Australia Oil and Fat Substitutes Regional Analysis and Outlook
8.4.6. South East Asia Oil and Fat Substitutes Regional Analysis and Outlook
8.4.7. Rest of Asia Pacific Oil and Fat Substitutes Regional Analysis and Outlook
8.5. South America Oil and Fat Substitutes Revenue (USD Million), by Country (2021-2032)
8.5.1. Brazil Oil and Fat Substitutes Regional Analysis and Outlook
8.5.2. Argentina Oil and Fat Substitutes Regional Analysis and Outlook
8.5.3. Rest of South America Oil and Fat Substitutes Regional Analysis and Outlook
8.6. Middle East and Africa Oil and Fat Substitutes Revenue (USD Million) by Country (2021-2032)
8.6.1. Middle East Oil and Fat Substitutes Regional Analysis and Outlook
8.6.2. Africa Oil and Fat Substitutes Regional Analysis and Outlook
Chapter 9. North America Oil and Fat Substitutes Analysis and Outlook
9.1. North America Oil and Fat Substitutes Revenue (USD Million) by Segments (2021-2032)
9.1.1. North America Oil and Fat Substitutes Revenue (USD Million) by Type (2021-2032)
9.1.2. North America Oil and Fat Substitutes Revenue (USD Million) by Application (2021-2032)
9.1.3. North America Oil and Fat Substitutes Revenue (USD Million) by Product (2021-2032)
By Type
Plant
Animal
By Application
Bakery & Confectionery Products
Dairy & Frozen Desserts
Convenience Foods & Beverages
Sauces, Dressings, and Spreads
Others
Chapter 10. Europe Oil and Fat Substitutes Analysis and Outlook
10.1. Europe Oil and Fat Substitutes Revenue (USD Million), by Segments (USD Million) (2021-2032)
10.1.1. Europe Oil and Fat Substitutes Revenue (USD Million) by Type (2021-2032)
10.1.2. Europe Oil and Fat Substitutes Revenue (USD Million) by Application (2021-2032)
10.1.3. Europe Oil and Fat Substitutes Revenue (USD Million) by Product (2021-2032)
By Type
Plant
Animal
By Application
Bakery & Confectionery Products
Dairy & Frozen Desserts
Convenience Foods & Beverages
Sauces, Dressings, and Spreads
Others
Chapter 11. Asia Pacific Oil and Fat Substitutes Analysis and Outlook
11.1. Asia Pacific Oil and Fat Substitutes Revenue (USD Million), and Revenue (USD Million) by Segments (2021-2032)
11.1.1. Asia Pacific Oil and Fat Substitutes Revenue (USD Million) by Type (2021-2032)
11.1.2. Asia Pacific Oil and Fat Substitutes Revenue (USD Million) by Application (2021-2032)
11.1.3. Asia Pacific Oil and Fat Substitutes Revenue (USD Million) by Product (2021-2032)
By Type
Plant
Animal
By Application
Bakery & Confectionery Products
Dairy & Frozen Desserts
Convenience Foods & Beverages
Sauces, Dressings, and Spreads
Others
Chapter 12. South America Oil and Fat Substitutes Analysis and Outlook
12.1. South America Oil and Fat Substitutes Revenue (USD Million), by Segments (2021-2032)
12.1.1. South America Oil and Fat Substitutes Revenue (USD Million) by Type (2021-2032)
12.1.2. South America Oil and Fat Substitutes Revenue (USD Million) by Application (2021-2032)
12.1.3. South America Oil and Fat Substitutes Revenue (USD Million) by Product (2021-2032)
By Type
Plant
Animal
By Application
Bakery & Confectionery Products
Dairy & Frozen Desserts
Convenience Foods & Beverages
Sauces, Dressings, and Spreads
Others
Chapter 13. Middle East and Africa Oil and Fat Substitutes Analysis and Outlook
13.1. Middle East and Africa Oil and Fat Substitutes Revenue (USD Million), by Segments (2021-2032)
13.1.1. Middle East and Africa Oil and Fat Substitutes Revenue (USD Million) by Type (2021-2032)
13.1.2. Middle East and Africa Oil and Fat Substitutes Revenue (USD Million) by Application (2021-2032)
13.1.3. Middle East and Africa Oil and Fat Substitutes Revenue (USD Million) by Product (2021-2032)
By Type
Plant
Animal
By Application
Bakery & Confectionery Products
Dairy & Frozen Desserts
Convenience Foods & Beverages
Sauces, Dressings, and Spreads
Others
Chapter 14. Oil and Fat Substitutes Company Profiles
14.1 Business Overview
14.2 Product Profiles
14.3 SWOT Profiles
14.5 Recent Developments
14.6 Financial Profile
List of Companies
Archer Daniels Midland Company (ADM)
Ashland Global Holdings Inc.
Cargill Inc
Corbion N.V.
CP Kelco
Dupont
Fiberstar
FMC Corp
Ingredion Inc
Kerry Group Plc
Koninklijke DSM N.V.
Tate & Lyle Plc
15. Methodology and Data Sources
15.1 Customization Offerings
15.2 Subscription Services
15.3 Related Reports
15.4 Publisher Expertise
LIST OF TABLES
Table 1 Market Segmentation Analysis
Table 2 Global Oil and Fat Substitutes Market Share of Leading Companies, 2023
Table 3 Product Offerings of Leading Companies
Table 4 Low Growth Scenario Forecasts
Table 5 Reference Case Growth Scenario
Table 6 High Growth Case Scenario
Table 7 Global Oil and Fat Substitutes Revenue (USD Million) And CAGR (%) By Type (2021-2032)
Table 8 Global Oil and Fat Substitutes Revenue (USD Million) And CAGR (%) By Application (2021-2032)
Table 9 Global Oil and Fat Substitutes Revenue (USD Million) And CAGR (%) By Product (2021-2032)
Table 10 Global Oil and Fat Substitutes Market Revenue (USD Million) By Regions (2021-2032)
Table 11 Global Oil and Fat Substitutes Market Share (%) By Regions (2021-2032)
Table 12 North America Oil and Fat Substitutes Revenue (USD Million) By Country (2021-2032)
Table 13 Europe Oil and Fat Substitutes Revenue (USD Million) By Country (2021-2032)
Table 14 Asia Pacific Oil and Fat Substitutes Revenue (USD Million) By Country (2021-2032)
Table 15 South America Oil and Fat Substitutes Revenue (USD Million) By Country (2021-2032)
Table 16 Middle East and Africa Oil and Fat Substitutes Revenue (USD Million) By Region (2021-2032)
Table 17 North America Oil and Fat Substitutes Revenue (USD Million) By Type (2021-2032)
Table 18 North America Oil and Fat Substitutes Revenue (USD Million) By Application (2021-2032)
Table 19 North America Oil and Fat Substitutes Revenue (USD Million) By Product (2021-2032)
Table 20 Europe Oil and Fat Substitutes Revenue (USD Million) By Type (2021-2032)
Table 21 Europe Oil and Fat Substitutes Revenue (USD Million) By Application (2021-2032)
Table 22 Europe Oil and Fat Substitutes Revenue (USD Million) By Product (2021-2032)
Table 23 Asia Pacific Oil and Fat Substitutes Revenue (USD Million) By Type (2021-2032)
Table 24 Asia Pacific Oil and Fat Substitutes Revenue (USD Million) By Application (2021-2032)
Table 25 Asia Pacific Oil and Fat Substitutes Revenue (USD Million) By Product (2021-2032)
Table 26 South America Oil and Fat Substitutes Revenue (USD Million) By Type (2021-2032)
Table 27 South America Oil and Fat Substitutes Revenue (USD Million) By Application (2021-2032)
Table 28 South America Oil and Fat Substitutes Revenue (USD Million) By Product (2021-2032)
Table 29 Middle East and Africa Oil and Fat Substitutes Revenue (USD Million) By Type (2021-2032)
Table 30 Middle East and Africa Oil and Fat Substitutes Revenue (USD Million) By Application (2021-2032)
Table 31 Middle East and Africa Oil and Fat Substitutes Revenue (USD Million) By Product (2021-2032)
LIST OF FIGURES
Figure 1. Market Scope
Figure 2. Pricing Forecasts Per Unit, 2023- 2032
Figure 3. Porter’s Five Forces
Figure 4. Global Oil and Fat Substitutes Market Revenue (USD Million) By Regions (2021-2032)
Figure 5. Global Oil and Fat Substitutes Market Share (%) By Regions (2023)
Figure 6. North America Oil and Fat Substitutes Revenue (USD Million) By Country (2021-2032)
Figure 7. United States Oil and Fat Substitutes Revenue (USD Million) By Country (2021-2032)
Figure 8. Canada Oil and Fat Substitutes Revenue (USD Million) By Country (2021-2032)
Figure 9. Mexico Oil and Fat Substitutes Revenue (USD Million) By Country (2021-2032)
Figure 10. Europe Oil and Fat Substitutes Revenue (USD Million) By Country (2021-2032)
Figure 11. Germany Oil and Fat Substitutes Revenue (USD Million) By Country (2021-2032)
Figure 12. France Oil and Fat Substitutes Revenue (USD Million) By Country (2021-2032)
Figure 13. United Kingdom Oil and Fat Substitutes Revenue (USD Million) By Country (2021-2032)
Figure 14. Spain Oil and Fat Substitutes Revenue (USD Million) By Country (2021-2032)
Figure 15. Italy Oil and Fat Substitutes Revenue (USD Million) By Country (2021-2032)
Figure 16. Russia Oil and Fat Substitutes Revenue (USD Million) By Country (2021-2032)
Figure 17. Rest of Europe Oil and Fat Substitutes Revenue (USD Million) By Country (2021-2032)
Figure 11. Asia Pacific Oil and Fat Substitutes Revenue (USD Million) By Country (2021-2032)
Figure 12. China Oil and Fat Substitutes Revenue (USD Million) By Country (2021-2032)
Figure 13. Japan Oil and Fat Substitutes Revenue (USD Million) By Country (2021-2032)
Figure 14. India Oil and Fat Substitutes Revenue (USD Million) By Country (2021-2032)
Figure 15. South Korea Oil and Fat Substitutes Revenue (USD Million) By Country (2021-2032)
Figure 16. Australia Oil and Fat Substitutes Revenue (USD Million) By Country (2021-2032)
Figure 17. South East Asia Oil and Fat Substitutes Revenue (USD Million) By Country (2021-2032)
Figure 18. South America Oil and Fat Substitutes Revenue (USD Million) By Country (2021-2032)
Figure 19. Brazil Oil and Fat Substitutes Revenue (USD Million) By Country (2021-2032)
Figure 20. Argentina Oil and Fat Substitutes Revenue (USD Million) By Country (2021-2032)
Figure 21. Rest of Asia Pacific Oil and Fat Substitutes Revenue (USD Million) By Country (2021-2032)
Figure 22. Middle East and Africa Oil and Fat Substitutes Revenue (USD Million) By Region (2021-2032)
Figure 23. Saudi Arabia Oil and Fat Substitutes Revenue (USD Million) By Region (2021-2032)
Figure 24. The UAE Oil and Fat Substitutes Revenue (USD Million) By Region (2021-2032)
Figure 25. Rest of Middle East Oil and Fat Substitutes Revenue (USD Million) By Region (2021-2032)
Figure 26. South Africa Oil and Fat Substitutes Revenue (USD Million) By Region (2021-2032)
Figure 27. Africa Oil and Fat Substitutes Revenue (USD Million) By Region (2021-2032)
Figure 28. North America Oil and Fat Substitutes Revenue (USD Million) By Type (2021-2032)
Figure 29. North America Oil and Fat Substitutes Revenue (USD Million) By Application (2021-2032)
Figure 30. North America Oil and Fat Substitutes Revenue (USD Million) By Product (2021-2032)
Figure 31. Europe Oil and Fat Substitutes Revenue (USD Million) By Type (2021-2032)
Figure 32. Europe Oil and Fat Substitutes Revenue (USD Million) By Application (2021-2032)
Figure 33. Europe Oil and Fat Substitutes Revenue (USD Million) By Product (2021-2032)
Figure 34. Asia Pacific Oil and Fat Substitutes Revenue (USD Million) By Type (2021-2032)
Figure 35. Asia Pacific Oil and Fat Substitutes Revenue (USD Million) By Application (2021-2032)
Figure 36. Asia Pacific Oil and Fat Substitutes Revenue (USD Million) By Product (2021-2032)
Figure 37. South America Oil and Fat Substitutes Revenue (USD Million) By Type (2021-2032)
Figure 38. South America Oil and Fat Substitutes Revenue (USD Million) By Application (2021-2032)
Figure 39. South America Oil and Fat Substitutes Revenue (USD Million) By Product (2021-2032)
Figure 40. Middle East and Africa Oil and Fat Substitutes Revenue (USD Million) By Type (2021-2032)
Figure 41. Middle East and Africa Oil and Fat Substitutes Revenue (USD Million) By Application (2021-2032)
Figure 42. Middle East and Africa Oil and Fat Substitutes Revenue (USD Million) By Product (2021-2032)
By Type
Plant
Animal
By Application
Bakery & Confectionery Products
Dairy & Frozen Desserts
Convenience Foods & Beverages
Sauces, Dressings, and Spreads
Others
Countries Analyzed
North America (US, Canada, Mexico)
Europe (Germany, UK, France, Spain, Italy, Russia, Rest of Europe)
Asia Pacific (China, India, Japan, South Korea, Australia, South East Asia, Rest of Asia)
South America (Brazil, Argentina, Rest of South America)
Middle East and Africa (Saudi Arabia, UAE, Rest of Middle East, South Africa, Egypt, Rest of Africa)
