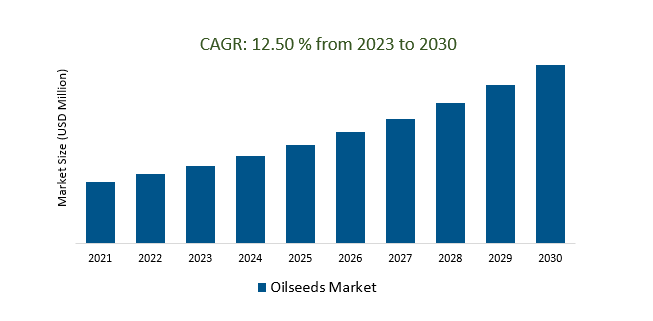
The Global Oilseeds Market Size is estimated to register 12.5% growth over the forecast period from 2023 to 2030.
The Oilseeds Market is influenced by global population growth, changing dietary preferences, biofuel production, emerging markets, weather and climate factors, government policies, technological advancements, sustainable agriculture, plant-based diets, health and wellness trends, genetic modification and biotechnology, international trade agreements, and climate change mitigation. The growing population drives demand for food and vegetable oils while changing dietary habits and biofuel production increase demand. Emerging markets, such as rapid urbanization and a growing middle class, drive higher consumption of edible oils. Climate change, government policies, and technological advancements also impact oilseed production, trade, and prices. Sustainable agriculture, plant-based diets, and genetic modification and biotechnology also contribute to the oilseeds market.
Rising Global Population Fuels Growing Demand for Oilseeds and Vegetable Oils.
The world's burgeoning population has become a driving force behind the escalating demand for oilseeds and vegetable oils. As the global populace continues to swell, so does the need for essential commodities like cooking oils, which are a staple in diets worldwide. Oilseeds, such as soybeans, sunflower seeds, and canola, serve as the primary raw materials for producing these vegetable oils. This exponential demand has spurred agricultural activities to cultivate more oilseed crops to meet the ever-increasing consumption. Furthermore, oilseeds and vegetable oils are not limited to culinary purposes alone; they find extensive use in the industrial sector, particularly in the production of biofuels, cosmetics, and various processed food products. This multi-faceted demand exerts immense pressure on the agricultural sector to enhance productivity and adopt sustainable farming practices to prevent ecological imbalances. The challenge ahead lies in finding innovative and sustainable ways to address the soaring demand for oilseeds and vegetable oils while ensuring food security and environmental conservation in a world marked by a rising population.
The Impact of Changing Dietary Preferences is boosting the market.
The shifting dietary preferences of consumers are having a profound impact on the oilseeds market. As people become more health conscious and environmentally aware, there is a growing demand for plant-based oils, such as soybean, canola, and sunflower oils, which are perceived as healthier alternatives to traditional animal fats. This trend is also fueled by the increasing popularity of vegetarian and vegan diets. Furthermore, the rising awareness of the sustainability issues associated with animal agriculture has led to a surge in plant-based protein consumption, particularly in the form of soy and other oilseeds. Consequently, the oilseeds market is experiencing substantial growth as it plays a crucial role in meeting the demand for both oils and proteins in a more sustainable and ethical manner. As these changing dietary preferences continue to evolve, the oilseeds market is expected to expand further, offering significant opportunities for producers and stakeholders in the industry.
Enhancing Oilseed Production through Technological Advancements in Agriculture is creating a demand in the market.
The oilseeds market is experiencing a significant surge in demand. With the world's growing population and increasing awareness of the health benefits associated with cooking oils and biofuels derived from oilseeds, the need for enhanced production has never been more pressing. Technological advancements in agriculture have played a pivotal role in this transformation. Precision farming techniques, genetically modified crops, and improved irrigation systems are just a few examples of the innovations that have allowed farmers to maximize yields and minimize resource consumption. These advancements not only ensure a more stable supply of oilseeds but also contribute to sustainable agriculture practices. As the oilseeds market continues to expand, it is not only benefiting farmers but also industries reliant on these crops, such as food processing, biodiesel, and cosmetics. The increased availability of high-quality oilseeds not only helps meet the surging global demand but also promotes economic growth and job creation in rural areas. This positive feedback loop between technological innovation and market demand underscores the importance of ongoing research and development in agriculture to ensure a secure and prosperous future for the oilseeds industry.
Market Share Analysis:
Soybean, scientifically known as Glycine max, stands tall as the undisputed champion among oilseeds in today's global agricultural landscape.
Soybean’s unrivaled dominance is attributed to several key factors. First and foremost, soybeans boast a remarkable versatility that extends far beyond oil extraction. They serve as a cornerstone in the production of various food products like tofu, soy milk, and soy sauce, while also being a primary source of high-quality protein for both human and animal consumption. Furthermore, soybeans have earned their place as a sustainable and economically significant crop. They are known for their nitrogen-fixing abilities, which enhance soil fertility, making them a preferred choice in crop rotation systems. Additionally, soybean oil is not only widely used in cooking but also in various industrial applications, including biodiesel production and the manufacturing of countless consumer goods. In the global market, the dominance of soybeans has only grown stronger over the years, with countries like the United States, Brazil, and Argentina leading the production charts. This versatile and economically vital oilseed continues to play a pivotal role in meeting the world's growing demand for food, feed, and biofuel, cementing its status as the reigning monarch of oilseeds.
Conventional oilseeds hold a significant and enduring presence in the global oilseeds market.
The traditional crops, including soybeans, sunflowers, canola, and peanuts, have established themselves as the backbone of the industry. They are favored for their versatility, widespread cultivation, and proven track record in providing essential oils for various purposes. One of the primary reasons for their dominance is their adaptability to different climatic conditions, making them accessible to farmers across the world. Additionally, conventional oilseeds serve as vital ingredients in the production of a wide array of consumer products, ranging from cooking oils to animal feed and even industrial applications like biodiesel production. Their long-standing position in the market is further solidified by extensive research and development efforts aimed at improving yields, disease resistance, and oil quality. While specialty and genetically modified oilseeds are gaining traction, the enduring appeal of conventional varieties ensures they remain a cornerstone in the oilseed industry, meeting the ever-growing demand for edible oils and other valuable by products.
The dominant application in the oilseeds market is vegetable oil.
Vegetable oil a versatile term encompassing oils extracted from plants used in various sectors, including cooking, food processing, and industry. Common oilseeds like soybeans, rapeseed, sunflower seed, and peanuts are primary sources of vegetable oil. The vegetable oil sector holds the largest market share, constituting over 60% due to its high demand in the food and beverage industry. Vegetable oil finds its way into numerous food products, including cooking oil, salad dressing, margarine, and mayonnaise, and also plays a role in biofuel production like biodiesel. Projected growth in vegetable oil demand in the future is driven by factors such as population growth, rising incomes, and urbanization, thereby supporting the oilseeds market's expansion.
The food industry holds a prominent position within the oilseeds market due to several key factors.
The versatile nature of oilseeds is essential, as they are integral to the production of various food products, including vegetable oil, margarine, mayonnaise, shortening, salad dressing, and cooking oil. Moreover, vegetable oil plays a vital role in many processed foods like baked goods, snacks, and frozen items. This dominance of the food industry in the oilseeds market can be attributed to the rising global population, leading to heightened food demand, particularly for vegetable oil. Additionally, increasing incomes in developing nations are fueling the demand for processed foods, often containing vegetable oil, while shifting dietary preferences towards healthier choices further boost the industry's significance.
Oilseeds Market Segmentation
Type
- Sunflower
- Cottonseed
- Groundnut
- Copra
- Others
Product
Application
- Oilseed Meal
- Vegetable oil
- Industry
- Food
- Feed
- Industrial
By Region
- North America (United States, Canada, Mexico)
- Europe (Germany, France, United Kingdom, Spain, Italy, Others)
- Asia Pacific (China, India, Japan, South Korea, Australia, Others)
- Latin America (Brazil, Argentina, Others)
- Middle East and Africa (Saudi Arabia, UAE, Kuwait, Other Middle East, South Africa, Nigeria, Other Africa)
Oilseeds Market Companies
- Cargill Inc
- ADM Company
- Bunge Ltd
- Wilmar International
- Buhler Group
- Loius Dreyfus Company
- AGT Food and Ingredients
- CHS Inc
- Cootamundra Oilseeds
- Oilseeds International
- Mountain States Oilseeds
- Kanematsu Corp
- Soni Soya Products Ltd
- Bora Agro Foods
- ETG Agro Pvt Ltd
*List not exhaustive
Oilseeds Market Outlook 2023
1 Market Overview
1.1 Introduction to the Oilseeds Market
1.2 Scope of the Study
1.3 Research Objective
1.3.1 Key Market Scope and Segments
1.3.2 Players Covered
1.3.3 Years Considered
2 Executive Summary
2.1 2023 Oilseeds Industry- Market Statistics
3 Market Dynamics
3.1 Market Drivers
3.2 Market Challenges
3.3 Market Opportunities
3.4 Market Trends
4 Market Factor Analysis
4.1 Porter’s Five Forces
4.2 Market Entropy
4.2.1 Global Oilseeds Market Companies with Area Served
4.2.2 Products Offerings Global Oilseeds Market
5 COVID-19 Impact Analysis and Outlook Scenarios
5.1.1 Covid-19 Impact Analysis
5.1.2 post-COVID-19 Scenario- Low Growth Case
5.1.3 post-COVID-19 Scenario- Reference Growth Case
5.1.4 post-COVID-19 Scenario- Low Growth Case
6 Global Oilseeds Market Trends
6.1 Global Oilseeds Revenue (USD Million) and CAGR (%) by Type (2018-2030)
6.2 Global Oilseeds Revenue (USD Million) and CAGR (%) by Applications (2018-2030)
6.3 Global Oilseeds Revenue (USD Million) and CAGR (%) by regions (2018-2030)
7 Global Oilseeds Market Revenue (USD Million) by Type, and Applications (2018-2022)
7.1 Global Oilseeds Revenue (USD Million) by Type (2018-2022)
7.1.1 Global Oilseeds Revenue (USD Million), Market Share (%) by Type (2018-2022)
7.2 Global Oilseeds Revenue (USD Million) by Applications (2018-2022)
7.2.1 Global Oilseeds Revenue (USD Million), Market Share (%) by Applications (2018-2022)
8 Global Oilseeds Development Regional Status and Outlook
8.1 Global Oilseeds Revenue (USD Million) By Regions (2018-2022)
8.2 North America Oilseeds Revenue (USD Million) by Type, and Application (2018-2022)
8.2.1 North America Oilseeds Revenue (USD Million) by Country (2018-2022)
8.2.2 North America Oilseeds Revenue (USD Million) by Type (2018-2022)
8.2.3 North America Oilseeds Revenue (USD Million) by Applications (2018-2022)
8.3 Europe Oilseeds Revenue (USD Million), by Type, and Applications (USD Million) (2018-2022)
8.3.1 Europe Oilseeds Revenue (USD Million), by Country (2018-2022)
8.3.2 Europe Oilseeds Revenue (USD Million) by Type (2018-2022)
8.3.3 Europe Oilseeds Revenue (USD Million) by Applications (2018-2022)
8.4 Asia Pacific Oilseeds Revenue (USD Million), and Revenue (USD Million) by Type, and Applications (2018-2022)
8.4.1 Asia Pacific Oilseeds Revenue (USD Million) by Country (2018-2022)
8.4.2 Asia Pacific Oilseeds Revenue (USD Million) by Type (2018-2022)
8.4.3 Asia Pacific Oilseeds Revenue (USD Million) by Applications (2018-2022)
8.5 South America Oilseeds Revenue (USD Million), by Type, and Applications (2018-2022)
8.5.1 South America Oilseeds Revenue (USD Million), by Country (2018-2022)
8.5.2 South America Oilseeds Revenue (USD Million) by Type (2018-2022)
8.5.3 South America Oilseeds Revenue (USD Million) by Applications (2018-2022)
8.6 Middle East and Africa Oilseeds Revenue (USD Million), by Type, Technology, Application, Thickness (2018-2022)
8.6.1 Middle East and Africa Oilseeds Revenue (USD Million) by Country (2018-2022)
8.6.2 Middle East and Africa Oilseeds Revenue (USD Million) by Type (2018-2022)
8.6.3 Middle East and Africa Oilseeds Revenue (USD Million) by Applications (2018-2022)
9 Company Profiles
10 Global Oilseeds Market Revenue (USD Million), by Type, and Applications (2023-2030)
10.1 Global Oilseeds Revenue (USD Million) and Market Share (%) by Type (2023-2030)
10.1.1 Global Oilseeds Revenue (USD Million), and Market Share (%) by Type (2023-2030)
10.2 Global Oilseeds Revenue (USD Million) and Market Share (%) by Applications (2023-2030)
10.2.1 Global Oilseeds Revenue (USD Million), and Market Share (%) by Applications (2023-2030)
11 Global Oilseeds Development Regional Status and Outlook Forecast
11.1 Global Oilseeds Revenue (USD Million) By Regions (2023-2030)
11.2 North America Oilseeds Revenue (USD Million) by Type, and Applications (2023-2030)
11.2.1 North America Oilseeds Revenue (USD) Million by Country (2023-2030)
11.2.2 North America Oilseeds Revenue (USD Million), by Type (2023-2030)
11.2.3 North America Oilseeds Revenue (USD Million), Market Share (%) by Applications (2023-2030)
11.3 Europe Oilseeds Revenue (USD Million), by Type, and Applications (2023-2030)
11.3.1 Europe Oilseeds Revenue (USD Million), by Country (2023-2030)
11.3.2 Europe Oilseeds Revenue (USD Million), by Type (2023-2030)
11.3.3 Europe Oilseeds Revenue (USD Million), by Applications (2023-2030)
11.4 Asia Pacific Oilseeds Revenue (USD Million) by Type, and Applications (2023-2030)
11.4.1 Asia Pacific Oilseeds Revenue (USD Million), by Country (2023-2030)
11.4.2 Asia Pacific Oilseeds Revenue (USD Million), by Type (2023-2030)
11.4.3 Asia Pacific Oilseeds Revenue (USD Million), by Applications (2023-2030)
11.5 South America Oilseeds Revenue (USD Million), by Type, and Applications (2023-2030)
11.5.1 South America Oilseeds Revenue (USD Million), by Country (2023-2030)
11.5.2 South America Oilseeds Revenue (USD Million), by Type (2023-2030)
11.5.3 South America Oilseeds Revenue (USD Million), by Applications (2023-2030)
11.6 Middle East and Africa Oilseeds Revenue (USD Million), by Type, and Applications (2023-2030)
11.6.1 Middle East and Africa Oilseeds Revenue (USD Million), by region (2023-2030)
11.6.2 Middle East and Africa Oilseeds Revenue (USD Million), by Type (2023-2030)
11.6.3 Middle East and Africa Oilseeds Revenue (USD Million), by Applications (2023-2030)
12 Methodology and Data Sources
12.1 Methodology/Research Approach
12.1.1 Research Programs/Design
12.1.2 Market Size Estimation
12.1.3 Market Breakdown and Data Triangulation
12.2 Data Sources
12.2.1 Secondary Sources
12.2.2 Primary Sources
12.3 Disclaimer
List of Tables
Table 1 Market Segmentation Analysis
Table 2 Global Oilseeds Market Companies with Areas Served
Table 3 Products Offerings Global Oilseeds Market
Table 4 Low Growth Scenario Forecasts
Table 5 Reference Case Growth Scenario
Table 6 High Growth Case Scenario
Table 7 Global Oilseeds Revenue (USD Million) And CAGR (%) By Type (2018-2030)
Table 8 Global Oilseeds Revenue (USD Million) And CAGR (%) By Applications (2018-2030)
Table 9 Global Oilseeds Revenue (USD Million) And CAGR (%) By Regions (2018-2030)
Table 10 Global Oilseeds Revenue (USD Million) By Type (2018-2022)
Table 11 Global Oilseeds Revenue Market Share (%) By Type (2018-2022)
Table 12 Global Oilseeds Revenue (USD Million) By Applications (2018-2022)
Table 13 Global Oilseeds Revenue Market Share (%) By Applications (2018-2022)
Table 14 Global Oilseeds Market Revenue (USD Million) By Regions (2018-2022)
Table 15 Global Oilseeds Market Share (%) By Regions (2018-2022)
Table 16 North America Oilseeds Revenue (USD Million) By Country (2018-2022)
Table 17 North America Oilseeds Revenue (USD Million) By Type (2018-2022)
Table 18 North America Oilseeds Revenue (USD Million) By Applications (2018-2022)
Table 19 Europe Oilseeds Revenue (USD Million) By Country (2018-2022)
Table 20 Europe Oilseeds Revenue (USD Million) By Type (2018-2022)
Table 21 Europe Oilseeds Revenue (USD Million) By Applications (2018-2022)
Table 22 Asia Pacific Oilseeds Revenue (USD Million) By Country (2018-2022)
Table 23 Asia Pacific Oilseeds Revenue (USD Million) By Type (2018-2022)
Table 24 Asia Pacific Oilseeds Revenue (USD Million) By Applications (2018-2022)
Table 25 South America Oilseeds Revenue (USD Million) By Country (2018-2022)
Table 26 South America Oilseeds Revenue (USD Million) By Type (2018-2022)
Table 27 South America Oilseeds Revenue (USD Million) By Applications (2018-2022)
Table 28 Middle East and Africa Oilseeds Revenue (USD Million) By Region (2018-2022)
Table 29 Middle East and Africa Oilseeds Revenue (USD Million) By Type (2018-2022)
Table 30 Middle East and Africa Oilseeds Revenue (USD Million) By Applications (2018-2022)
Table 31 Financial Analysis
Table 32 Global Oilseeds Revenue (USD Million) By Type (2023-2030)
Table 33 Global Oilseeds Revenue Market Share (%) By Type (2023-2030)
Table 34 Global Oilseeds Revenue (USD Million) By Applications (2023-2030)
Table 35 Global Oilseeds Revenue Market Share (%) By Applications (2023-2030)
Table 36 Global Oilseeds Market Revenue (USD Million), And Revenue (USD Million) By Regions (2023-2030)
Table 37 North America Oilseeds Revenue (USD)By Country (2023-2030)
Table 38 North America Oilseeds Revenue (USD Million) By Type (2023-2030)
Table 39 North America Oilseeds Revenue (USD Million) By Applications (2023-2030)
Table 40 Europe Oilseeds Revenue (USD Million) By Country (2023-2030)
Table 41 Europe Oilseeds Revenue (USD Million) By Type (2023-2030)
Table 42 Europe Oilseeds Revenue (USD Million) By Applications (2023-2030)
Table 43 Asia Pacific Oilseeds Revenue (USD Million) By Country (2023-2030)
Table 44 Asia Pacific Oilseeds Revenue (USD Million) By Type (2023-2030)
Table 45 Asia Pacific Oilseeds Revenue (USD Million) By Applications (2023-2030)
Table 46 South America Oilseeds Revenue (USD Million) By Country (2023-2030)
Table 47 South America Oilseeds Revenue (USD Million) By Type (2023-2030)
Table 48 South America Oilseeds Revenue (USD Million) By Applications (2023-2030)
Table 49 Middle East and Africa Oilseeds Revenue (USD Million) By Region (2023-2030)
Table 50 Middle East and Africa Oilseeds Revenue (USD Million) By Region (2023-2030)
Table 51 Middle East and Africa Oilseeds Revenue (USD Million) By Type (2023-2030)
Table 52 Middle East and Africa Oilseeds Revenue (USD Million) By Applications (2023-2030)
Table 53 Research Programs/Design for This Report
Table 54 Key Data Information from Secondary Sources
Table 55 Key Data Information from Primary Sources
List of Figures
Figure 1 Market Scope
Figure 2 Porter’s Five Forces
Figure 3 Global Oilseeds Revenue (USD Million) By Type (2018-2022)
Figure 4 Global Oilseeds Revenue Market Share (%) By Type (2022)
Figure 5 Global Oilseeds Revenue (USD Million) By Applications (2018-2022)
Figure 6 Global Oilseeds Revenue Market Share (%) By Applications (2022)
Figure 7 Global Oilseeds Market Revenue (USD Million) By Regions (2018-2022)
Figure 8 Global Oilseeds Market Share (%) By Regions (2022)
Figure 9 North America Oilseeds Revenue (USD Million) By Country (2018-2022)
Figure 10 North America Oilseeds Revenue (USD Million) By Type (2018-2022)
Figure 11 North America Oilseeds Revenue (USD Million) By Applications (2018-2022)
Figure 12 Europe Oilseeds Revenue (USD Million) By Country (2018-2022)
Figure 13 Europe Oilseeds Revenue (USD Million) By Type (2018-2022)
Figure 14 Europe Oilseeds Revenue (USD Million) By Applications (2018-2022)
Figure 15 Asia Pacific Oilseeds Revenue (USD Million) By Country (2018-2022)
Figure 16 Asia Pacific Oilseeds Revenue (USD Million) By Type (2018-2022)
Figure 17 Asia Pacific Oilseeds Revenue (USD Million) By Applications (2018-2022)
Figure 18 South America Oilseeds Revenue (USD Million) By Country (2018-2022)
Figure 19 South America Oilseeds Revenue (USD Million) By Type (2018-2022)
Figure 20 South America Oilseeds Revenue (USD Million) By Applications (2018-2022)
Figure 21 Middle East and Africa Oilseeds Revenue (USD Million) By Region (2018-2022)
Figure 22 Middle East and Africa Oilseeds Revenue (USD Million) By Type (2018-2022)
Figure 23 Middle East and Africa Oilseeds Revenue (USD Million) By Applications (2018-2022)
Figure 24 Global Oilseeds Revenue (USD Million) By Type (2023-2030)
Figure 25 Global Oilseeds Revenue Market Share (%) By Type (2030)
Figure 26 Global Oilseeds Revenue (USD Million) By Applications (2023-2030)
Figure 27 Global Oilseeds Revenue Market Share (%) By Applications (2030)
Figure 28 Global Oilseeds Market Revenue (USD Million) By Regions (2023-2030)
Figure 29 North America Oilseeds Revenue (USD Million) By Country (2023-2030)
Figure 30 North America Oilseeds Revenue (USD Million) By Type (2023-2030)
Figure 31 North America Oilseeds Revenue (USD Million) By Applications (2023-2030)
Figure 32 Europe Oilseeds Revenue (USD Million) By Country (2023-2030)
Figure 33 Europe Oilseeds Revenue (USD Million) By Type (2023-2030)
Figure 34 Europe Oilseeds Revenue (USD Million) By Applications (2023-2030)
Figure 35 Asia Pacific Oilseeds Revenue (USD Million) By Country (2023-2030)
Figure 36 Asia Pacific Oilseeds Revenue (USD Million) By Type (2023-2030)
Figure 37 Asia Pacific Oilseeds Revenue (USD Million) By Applications (2023-2030)
Figure 38 South America Oilseeds Revenue (USD Million) By Country (2023-2030)
Figure 39 South America Oilseeds Revenue (USD Million) By Type (2023-2030)
Figure 40 South America Oilseeds Revenue (USD Million) By Applications (2023-2030)
Figure 41 Middle East and Africa Oilseeds Revenue (USD Million) By Region (2023-2030)
Figure 42 Middle East and Africa Oilseeds Revenue (USD Million) By Region (2023-2030)
Figure 43 Middle East and Africa Oilseeds Revenue (USD Million) By Type (2023-2030)
Figure 44 Middle East and Africa Oilseeds Revenue (USD Million) By Applications (2023-2030)
Figure 45 Bottom-Up and Top-Down Approaches for This Report
Figure 46 Data Triangulation
