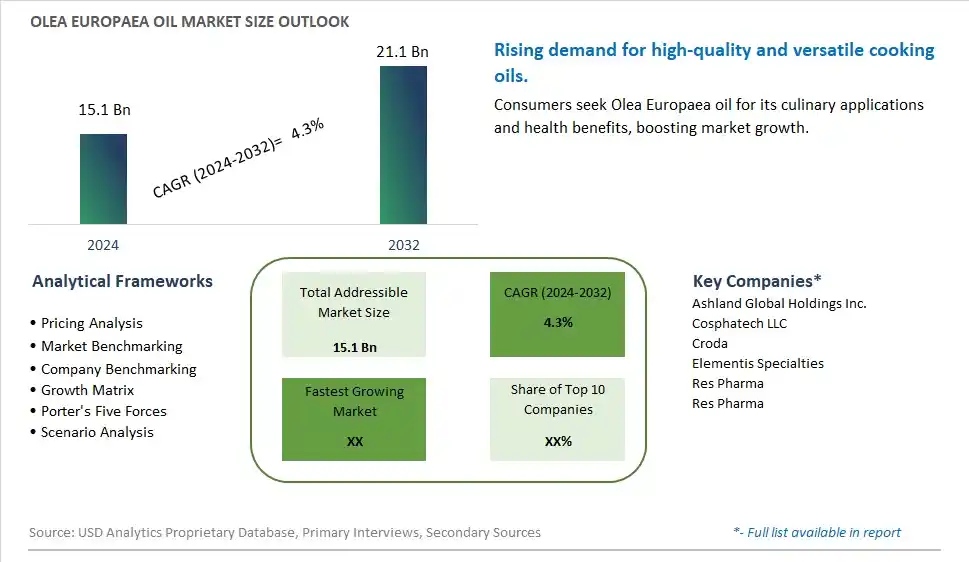
Global Olea Europaea Oil Market Size is valued at $15.1 Billion in 2024 and is forecast to register a growth rate (CAGR) of 4.3% to reach $21.1 Billion by 2032.
The global Olea Europaea Oil Market Comprehensive Study analyzes and forecasts the market size across 6 regions and 24 countries for diverse segments -By Type (Extra Virgin Olive Oil, Olive Oil, Olive Pomace Oil), By Application (Food Service, Cosmetics, Others)
An Introduction to Olea Europaea Oil Market
In 2024, the Olea europaea (olive) oil market is thriving, fueled by the demand for high-quality, healthful cooking oils. Olive oil, known for its rich flavor and nutritional benefits, is used in a variety of culinary applications. The market benefits from advancements in olive cultivation and oil extraction technologies that enhance product purity and taste. The trend towards clean label and natural ingredients is influencing product development. Increasing consumer interest in Mediterranean diets and the popularity of gourmet cooking oils are further supporting market growth.
Olea Europaea Oil Competitive Landscape
The market report analyses the leading companies in the industry including Ashland Global Holdings Inc., Cosphatech LLC, Croda, Elementis Specialties, Res Pharma, Res Pharma, and Others.
Olea Europaea Oil Market Dynamics
Olea Europaea Oil Market Trend: Growing Popularity of Mediterranean Diet
The most prominent trend in the Olea Europaea Oil Market is the growing popularity of the Mediterranean diet. Olea europaea oil, commonly known as olive oil, is a staple of this diet and is prized for its health benefits, including heart health and anti-inflammatory properties. This trend is driven by the increasing awareness of the nutritional advantages of the Mediterranean diet and the desire for natural and wholesome foods.
Olea Europaea Oil Market Driver: Health Consciousness and Demand for Natural Oils
A key driver in the Olea Europaea Oil Market is health consciousness and the demand for natural oils. As more individuals focus on improving their diet and incorporating healthy fats, there is a rising demand for olive oil that offers superior taste and nutritional value. This demand supports the growth of the market as consumers seek natural and minimally processed oil options.
Olea Europaea Oil Market Opportunity: Expansion into Premium and Specialty Olive Oils
One significant opportunity in the Olea Europaea Oil Market lies in the expansion into premium and specialty olive oils. Companies can develop new products that highlight unique olive varieties, production methods, and flavor profiles, catering to discerning consumers who appreciate high-quality and artisanal oils. By offering diverse and innovative options, manufacturers can attract a broader consumer base and drive market growth.
Olea Europaea Oil Market Share Analysis- Largest Segment by Type
In the Olea Europaea Oil Market, Extra Virgin Olive Oil is the largest segment. This dominance is due to its superior quality and higher perceived health benefits compared to other types of olive oil. Extra virgin olive oil, made from the first pressing of olives and containing the highest level of antioxidants and monounsaturated fats, is highly favored for its taste, nutritional value, and culinary uses. The segment's size reflects its broad adoption in both domestic and commercial kitchens, driven by increasing consumer awareness of its health benefits and its role in various diets, including Mediterranean cuisine. The premium nature of extra virgin olive oil and its versatility in cooking and dressings contribute to its position as the largest segment.
Olea Europaea Oil Market Share Analysis- Fastest Growing Segment by Application
In the Olea Europaea Oil Market, the Cosmetics application segment is poised to grow the fastest over the next five years. This growth is fueled by the increasing use of olive oil in cosmetic formulations due to its moisturizing, anti-aging, and antioxidant properties. Olive oil’s gentle and effective nature makes it a popular ingredient in skin care products, such as creams, lotions, and serums, which are in high demand among consumers seeking natural and organic beauty solutions. Additionally, the rise of clean beauty trends and consumer preference for ingredient transparency and sustainability are contributing to the rapid expansion of olive oil’s use in the cosmetics industry.
Olea Europaea Oil Market Segmentation
By Type
Extra Virgin Olive Oil
Olive Oil
Olive Pomace Oil
By Application
Food Service
Cosmetics
Others
Countries Analyzed
North America (US, Canada, Mexico)
Europe (Germany, UK, France, Spain, Italy, Russia, Rest of Europe)
Asia Pacific (China, India, Japan, South Korea, Australia, South East Asia, Rest of Asia)
South America (Brazil, Argentina, Rest of South America)
Middle East and Africa (Saudi Arabia, UAE, Rest of Middle East, South Africa, Egypt, Rest of Africa)
Olea Europaea Oil Companies Profiled in the Study
Ashland Global Holdings Inc.
Cosphatech LLC
Croda
Elementis Specialties
Res Pharma
Res Pharma
*- List Not Exhaustive
Chapter 1. TABLE OF CONTENTS
Chapter 2. Introduction to Olea Europaea Oil Market
2.1. Market Overview
2.2. Key Statistics and Report Highlights
2.3. Scope of the Comprehensive Study
2.3.1. Market Definition
2.3.2 Countries and Regions Covered
2.3.3 Research Objective
2.3.4 Units, Currency, and Conversions
2.3.5 Industry Value Chain
2.4. Key Market Segments
2.5. Key Companies
2.6. Study Period
Chapter 3. Strategic Analysis Review
3.1. Olea Europaea Oil Pricing Analysis and Forecast
3.2. Porter’s Five Forces
3.3. Market Ecosystem
3.4. SWOT Analysis
3.5. Regulatory Scenario
3.3. Effects of Inflation, Russia-Ukraine War, moderating economic growth, and other macroeconomic factors
Chapter 4. Competitive Landscape
4.1. Market Share Analysis
4.1.1. Global Olea Europaea Oil Market Share by Company, 2023
4.1.2. Product Offerings of Leading Olea Europaea Oil Companies
4.2. Market Entropy
4.2.1. New Product Launches in the Industry
4.2.2. Mergers, Acquisitions, Joint ventures, and Partnerships
4.3. Key Strategies and Best Practices
Chapter 5. Global Market Projections: Best, Reference, and Low Case Scenarios
5.1. Growth Analysis- Case Scenario Definitions
5.2. Low Growth Case Scenario Forecasts
5.3. Reference Growth Case Scenario Forecasts
5.4. High Growth Case Scenario Forecasts
Chapter 6. Market Dynamics
6.1. Olea Europaea Oil Market Drivers
6.2. Olea Europaea Oil Market Challenges
6.6. Olea Europaea Oil Market Opportunities
6.4. Olea Europaea Oil Market Trends
Chapter 7. Global Olea Europaea Oil Market Outlook Trends
7.1. Global Olea Europaea Oil Revenue (USD Million) and CAGR (%) by Type (2021-2032)
7.2. Global Olea Europaea Oil Revenue (USD Million) and CAGR (%) by Application (2021-2032)
7.3. Global Olea Europaea Oil Revenue (USD Million) and CAGR (%) by Product (2021-2032)
By Type
Extra Virgin Olive Oil
Olive Oil
Olive Pomace Oil
By Application
Food Service
Cosmetics
Others
Chapter 8. Global Olea Europaea Oil Regional Analysis and Outlook
8.1. Global Olea Europaea Oil Revenue (USD Million) By Regions (2021- 2032)
8.2. North America Olea Europaea Oil Revenue (USD Million) by Country (2021-2032)
8.2.1. United States Olea Europaea Oil Regional Analysis and Outlook
8.2.2. Canada Olea Europaea Oil Regional Analysis and Outlook
8.2.3. Mexico Olea Europaea Oil Regional Analysis and Outlook
8.3. Europe Olea Europaea Oil Revenue (USD Million), by Country (2021-2032)
8.3.1. Germany Olea Europaea Oil Regional Analysis and Outlook
8.3.2. France Olea Europaea Oil Regional Analysis and Outlook
8.3.3. United Kingdom Olea Europaea Oil Regional Analysis and Outlook
8.3.4. Spain Olea Europaea Oil Regional Analysis and Outlook
8.3.5. Italy Olea Europaea Oil Regional Analysis and Outlook
8.3.6. Russia Olea Europaea Oil Regional Analysis and Outlook
8.3.7. Rest of Europe Olea Europaea Oil Regional Analysis and Outlook
8.4. Asia Pacific Olea Europaea Oil Revenue (USD Million) by Country (2021-2032)
8.4.1. China Olea Europaea Oil Regional Analysis and Outlook
8.4.2. Japan Olea Europaea Oil Regional Analysis and Outlook
8.4.3. India Olea Europaea Oil Regional Analysis and Outlook
8.4.4. South Korea Olea Europaea Oil Regional Analysis and Outlook
8.4.5. Australia Olea Europaea Oil Regional Analysis and Outlook
8.4.6. South East Asia Olea Europaea Oil Regional Analysis and Outlook
8.4.7. Rest of Asia Pacific Olea Europaea Oil Regional Analysis and Outlook
8.5. South America Olea Europaea Oil Revenue (USD Million), by Country (2021-2032)
8.5.1. Brazil Olea Europaea Oil Regional Analysis and Outlook
8.5.2. Argentina Olea Europaea Oil Regional Analysis and Outlook
8.5.3. Rest of South America Olea Europaea Oil Regional Analysis and Outlook
8.6. Middle East and Africa Olea Europaea Oil Revenue (USD Million) by Country (2021-2032)
8.6.1. Middle East Olea Europaea Oil Regional Analysis and Outlook
8.6.2. Africa Olea Europaea Oil Regional Analysis and Outlook
Chapter 9. North America Olea Europaea Oil Analysis and Outlook
9.1. North America Olea Europaea Oil Revenue (USD Million) by Segments (2021-2032)
9.1.1. North America Olea Europaea Oil Revenue (USD Million) by Type (2021-2032)
9.1.2. North America Olea Europaea Oil Revenue (USD Million) by Application (2021-2032)
9.1.3. North America Olea Europaea Oil Revenue (USD Million) by Product (2021-2032)
By Type
Extra Virgin Olive Oil
Olive Oil
Olive Pomace Oil
By Application
Food Service
Cosmetics
Others
Chapter 10. Europe Olea Europaea Oil Analysis and Outlook
10.1. Europe Olea Europaea Oil Revenue (USD Million), by Segments (USD Million) (2021-2032)
10.1.1. Europe Olea Europaea Oil Revenue (USD Million) by Type (2021-2032)
10.1.2. Europe Olea Europaea Oil Revenue (USD Million) by Application (2021-2032)
10.1.3. Europe Olea Europaea Oil Revenue (USD Million) by Product (2021-2032)
By Type
Extra Virgin Olive Oil
Olive Oil
Olive Pomace Oil
By Application
Food Service
Cosmetics
Others
Chapter 11. Asia Pacific Olea Europaea Oil Analysis and Outlook
11.1. Asia Pacific Olea Europaea Oil Revenue (USD Million), and Revenue (USD Million) by Segments (2021-2032)
11.1.1. Asia Pacific Olea Europaea Oil Revenue (USD Million) by Type (2021-2032)
11.1.2. Asia Pacific Olea Europaea Oil Revenue (USD Million) by Application (2021-2032)
11.1.3. Asia Pacific Olea Europaea Oil Revenue (USD Million) by Product (2021-2032)
By Type
Extra Virgin Olive Oil
Olive Oil
Olive Pomace Oil
By Application
Food Service
Cosmetics
Others
Chapter 12. South America Olea Europaea Oil Analysis and Outlook
12.1. South America Olea Europaea Oil Revenue (USD Million), by Segments (2021-2032)
12.1.1. South America Olea Europaea Oil Revenue (USD Million) by Type (2021-2032)
12.1.2. South America Olea Europaea Oil Revenue (USD Million) by Application (2021-2032)
12.1.3. South America Olea Europaea Oil Revenue (USD Million) by Product (2021-2032)
By Type
Extra Virgin Olive Oil
Olive Oil
Olive Pomace Oil
By Application
Food Service
Cosmetics
Others
Chapter 13. Middle East and Africa Olea Europaea Oil Analysis and Outlook
13.1. Middle East and Africa Olea Europaea Oil Revenue (USD Million), by Segments (2021-2032)
13.1.1. Middle East and Africa Olea Europaea Oil Revenue (USD Million) by Type (2021-2032)
13.1.2. Middle East and Africa Olea Europaea Oil Revenue (USD Million) by Application (2021-2032)
13.1.3. Middle East and Africa Olea Europaea Oil Revenue (USD Million) by Product (2021-2032)
By Type
Extra Virgin Olive Oil
Olive Oil
Olive Pomace Oil
By Application
Food Service
Cosmetics
Others
Chapter 14. Olea Europaea Oil Company Profiles
14.1 Business Overview
14.2 Product Profiles
14.3 SWOT Profiles
14.5 Recent Developments
14.6 Financial Profile
List of Companies
Ashland Global Holdings Inc.
Cosphatech LLC
Croda
Elementis Specialties
Res Pharma
Res Pharma
15. Methodology and Data Sources
15.1 Customization Offerings
15.2 Subscription Services
15.3 Related Reports
15.4 Publisher Expertise
LIST OF TABLES
Table 1 Market Segmentation Analysis
Table 2 Global Olea Europaea Oil Market Share of Leading Companies, 2023
Table 3 Product Offerings of Leading Companies
Table 4 Low Growth Scenario Forecasts
Table 5 Reference Case Growth Scenario
Table 6 High Growth Case Scenario
Table 7 Global Olea Europaea Oil Revenue (USD Million) And CAGR (%) By Type (2021-2032)
Table 8 Global Olea Europaea Oil Revenue (USD Million) And CAGR (%) By Application (2021-2032)
Table 9 Global Olea Europaea Oil Revenue (USD Million) And CAGR (%) By Product (2021-2032)
Table 10 Global Olea Europaea Oil Market Revenue (USD Million) By Regions (2021-2032)
Table 11 Global Olea Europaea Oil Market Share (%) By Regions (2021-2032)
Table 12 North America Olea Europaea Oil Revenue (USD Million) By Country (2021-2032)
Table 13 Europe Olea Europaea Oil Revenue (USD Million) By Country (2021-2032)
Table 14 Asia Pacific Olea Europaea Oil Revenue (USD Million) By Country (2021-2032)
Table 15 South America Olea Europaea Oil Revenue (USD Million) By Country (2021-2032)
Table 16 Middle East and Africa Olea Europaea Oil Revenue (USD Million) By Region (2021-2032)
Table 17 North America Olea Europaea Oil Revenue (USD Million) By Type (2021-2032)
Table 18 North America Olea Europaea Oil Revenue (USD Million) By Application (2021-2032)
Table 19 North America Olea Europaea Oil Revenue (USD Million) By Product (2021-2032)
Table 20 Europe Olea Europaea Oil Revenue (USD Million) By Type (2021-2032)
Table 21 Europe Olea Europaea Oil Revenue (USD Million) By Application (2021-2032)
Table 22 Europe Olea Europaea Oil Revenue (USD Million) By Product (2021-2032)
Table 23 Asia Pacific Olea Europaea Oil Revenue (USD Million) By Type (2021-2032)
Table 24 Asia Pacific Olea Europaea Oil Revenue (USD Million) By Application (2021-2032)
Table 25 Asia Pacific Olea Europaea Oil Revenue (USD Million) By Product (2021-2032)
Table 26 South America Olea Europaea Oil Revenue (USD Million) By Type (2021-2032)
Table 27 South America Olea Europaea Oil Revenue (USD Million) By Application (2021-2032)
Table 28 South America Olea Europaea Oil Revenue (USD Million) By Product (2021-2032)
Table 29 Middle East and Africa Olea Europaea Oil Revenue (USD Million) By Type (2021-2032)
Table 30 Middle East and Africa Olea Europaea Oil Revenue (USD Million) By Application (2021-2032)
Table 31 Middle East and Africa Olea Europaea Oil Revenue (USD Million) By Product (2021-2032)
LIST OF FIGURES
Figure 1. Market Scope
Figure 2. Pricing Forecasts Per Unit, 2023- 2032
Figure 3. Porter’s Five Forces
Figure 4. Global Olea Europaea Oil Market Revenue (USD Million) By Regions (2021-2032)
Figure 5. Global Olea Europaea Oil Market Share (%) By Regions (2023)
Figure 6. North America Olea Europaea Oil Revenue (USD Million) By Country (2021-2032)
Figure 7. United States Olea Europaea Oil Revenue (USD Million) By Country (2021-2032)
Figure 8. Canada Olea Europaea Oil Revenue (USD Million) By Country (2021-2032)
Figure 9. Mexico Olea Europaea Oil Revenue (USD Million) By Country (2021-2032)
Figure 10. Europe Olea Europaea Oil Revenue (USD Million) By Country (2021-2032)
Figure 11. Germany Olea Europaea Oil Revenue (USD Million) By Country (2021-2032)
Figure 12. France Olea Europaea Oil Revenue (USD Million) By Country (2021-2032)
Figure 13. United Kingdom Olea Europaea Oil Revenue (USD Million) By Country (2021-2032)
Figure 14. Spain Olea Europaea Oil Revenue (USD Million) By Country (2021-2032)
Figure 15. Italy Olea Europaea Oil Revenue (USD Million) By Country (2021-2032)
Figure 16. Russia Olea Europaea Oil Revenue (USD Million) By Country (2021-2032)
Figure 17. Rest of Europe Olea Europaea Oil Revenue (USD Million) By Country (2021-2032)
Figure 11. Asia Pacific Olea Europaea Oil Revenue (USD Million) By Country (2021-2032)
Figure 12. China Olea Europaea Oil Revenue (USD Million) By Country (2021-2032)
Figure 13. Japan Olea Europaea Oil Revenue (USD Million) By Country (2021-2032)
Figure 14. India Olea Europaea Oil Revenue (USD Million) By Country (2021-2032)
Figure 15. South Korea Olea Europaea Oil Revenue (USD Million) By Country (2021-2032)
Figure 16. Australia Olea Europaea Oil Revenue (USD Million) By Country (2021-2032)
Figure 17. South East Asia Olea Europaea Oil Revenue (USD Million) By Country (2021-2032)
Figure 18. South America Olea Europaea Oil Revenue (USD Million) By Country (2021-2032)
Figure 19. Brazil Olea Europaea Oil Revenue (USD Million) By Country (2021-2032)
Figure 20. Argentina Olea Europaea Oil Revenue (USD Million) By Country (2021-2032)
Figure 21. Rest of Asia Pacific Olea Europaea Oil Revenue (USD Million) By Country (2021-2032)
Figure 22. Middle East and Africa Olea Europaea Oil Revenue (USD Million) By Region (2021-2032)
Figure 23. Saudi Arabia Olea Europaea Oil Revenue (USD Million) By Region (2021-2032)
Figure 24. The UAE Olea Europaea Oil Revenue (USD Million) By Region (2021-2032)
Figure 25. Rest of Middle East Olea Europaea Oil Revenue (USD Million) By Region (2021-2032)
Figure 26. South Africa Olea Europaea Oil Revenue (USD Million) By Region (2021-2032)
Figure 27. Africa Olea Europaea Oil Revenue (USD Million) By Region (2021-2032)
Figure 28. North America Olea Europaea Oil Revenue (USD Million) By Type (2021-2032)
Figure 29. North America Olea Europaea Oil Revenue (USD Million) By Application (2021-2032)
Figure 30. North America Olea Europaea Oil Revenue (USD Million) By Product (2021-2032)
Figure 31. Europe Olea Europaea Oil Revenue (USD Million) By Type (2021-2032)
Figure 32. Europe Olea Europaea Oil Revenue (USD Million) By Application (2021-2032)
Figure 33. Europe Olea Europaea Oil Revenue (USD Million) By Product (2021-2032)
Figure 34. Asia Pacific Olea Europaea Oil Revenue (USD Million) By Type (2021-2032)
Figure 35. Asia Pacific Olea Europaea Oil Revenue (USD Million) By Application (2021-2032)
Figure 36. Asia Pacific Olea Europaea Oil Revenue (USD Million) By Product (2021-2032)
Figure 37. South America Olea Europaea Oil Revenue (USD Million) By Type (2021-2032)
Figure 38. South America Olea Europaea Oil Revenue (USD Million) By Application (2021-2032)
Figure 39. South America Olea Europaea Oil Revenue (USD Million) By Product (2021-2032)
Figure 40. Middle East and Africa Olea Europaea Oil Revenue (USD Million) By Type (2021-2032)
Figure 41. Middle East and Africa Olea Europaea Oil Revenue (USD Million) By Application (2021-2032)
Figure 42. Middle East and Africa Olea Europaea Oil Revenue (USD Million) By Product (2021-2032)
By Type
Extra Virgin Olive Oil
Olive Oil
Olive Pomace Oil
By Application
Food Service
Cosmetics
Others
Countries Analyzed
North America (US, Canada, Mexico)
Europe (Germany, UK, France, Spain, Italy, Russia, Rest of Europe)
Asia Pacific (China, India, Japan, South Korea, Australia, South East Asia, Rest of Asia)
South America (Brazil, Argentina, Rest of South America)
Middle East and Africa (Saudi Arabia, UAE, Rest of Middle East, South Africa, Egypt, Rest of Africa)
