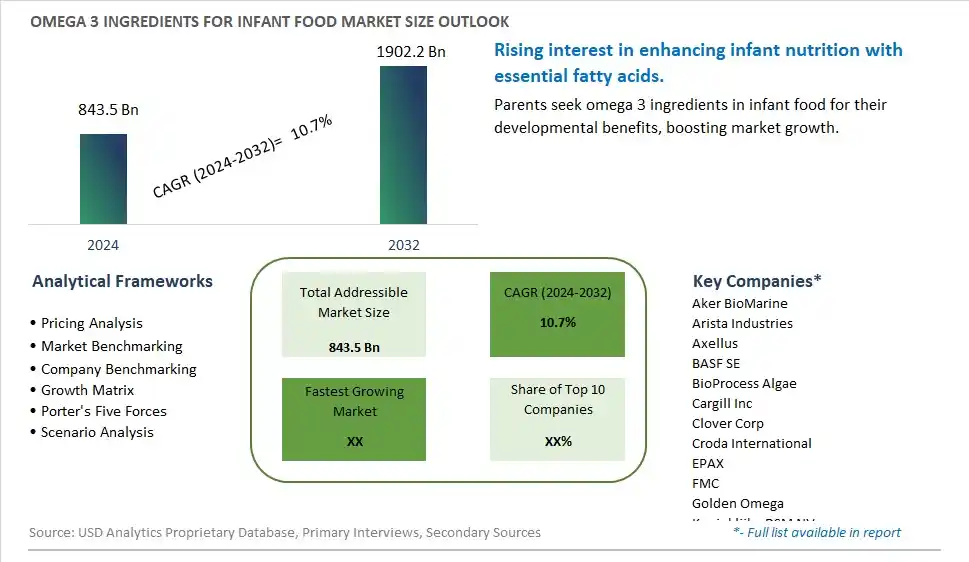
Global Omega 3 Ingredients for Infant Food Market Size is valued at $843.5 Billion in 2024 and is forecast to register a growth rate (CAGR) of 10.7% to reach $1902.2 Billion by 2032.
The global Omega 3 Ingredients for Infant Food Market Comprehensive Study analyzes and forecasts the market size across 6 regions and 24 countries for diverse segments -By Type (Marine Source, Plant Source), By Application (Supplements and Functional Foods, Pharmaceuticals, Others)
An Introduction to Omega 3 Ingredients for Infant Food Market
In 2024, the omega-3 ingredients for infant food market is thriving, fueled by the demand for high-quality, essential fatty acids that support infant growth and development. Omega-3 ingredients, such as DHA and EPA, are incorporated into infant formulas and baby foods to promote brain and eye health. The market benefits from advancements in omega-3 extraction and formulation technologies that enhance stability and bioavailability. The trend towards clean label and natural ingredients is influencing product development. Increasing awareness of the importance of early nutrition and the popularity of fortified infant foods are further supporting market growth.
Omega 3 Ingredients for Infant Food Competitive Landscape
The market report analyses the leading companies in the industry including Aker BioMarine, Arista Industries, Axellus, BASF SE, BioProcess Algae, Cargill Inc, Clover Corp, Croda International, EPAX, FMC, Golden Omega, Koninklijke DSM NV, Lonza, Martek Biosciences, Ocean Nutrition Canada, Omega Protein, Pronova BioPharma, TASA, and Others.
Omega 3 Ingredients for Infant Food Market Dynamics
Omega 3 Ingredients for Infant Food Market Trend: Increasing Focus on Infant Nutrition
The most prominent trend in the Omega 3 Ingredients for Infant Food Market is the increasing focus on infant nutrition. Parents and caregivers are becoming more aware of the critical role omega-3 fatty acids play in the development of infants, particularly for brain and eye health. This trend is driven by the demand for high-quality, nutritionally complete infant formulas that support optimal growth and development.
Omega 3 Ingredients for Infant Food Market Driver: Rising Awareness of Health Benefits
A key driver in the Omega 3 Ingredients for Infant Food Market is the rising awareness of the health benefits of omega-3 fatty acids. As scientific research continues to highlight the importance of DHA and EPA in cognitive development and immune support, there is a growing demand for infant foods fortified with omega-3 ingredients. This awareness is pushing manufacturers to include these essential nutrients in their products, supporting market growth.
Omega 3 Ingredients for Infant Food Market Opportunity: Innovation in Fortified Infant Formulas
One significant opportunity in the Omega 3 Ingredients for Infant Food Market lies in innovation in fortified infant formulas. Companies can develop new formulations that incorporate optimal levels of omega-3 fatty acids, sourced from fish oil or algae, to meet the nutritional needs of infants. By offering premium and scientifically backed products, manufacturers can attract health-conscious parents and drive market growth.
Omega 3 Ingredients for Infant Food Market Share Analysis- Largest Segment by Type
In the Omega 3 Ingredients for Infant Food Market, Marine Source is the largest segment. Marine-sourced omega-3s, primarily derived from fish oils, are preferred due to their high bioavailability and the well-documented benefits for infant development, including cognitive and visual function. These sources are rich in EPA and DHA, crucial for brain and eye health in infants, which drives their dominance in the market. The segment's size reflects the established scientific support for marine omega-3s and their incorporation into infant formulas and supplements to meet nutritional needs.
Omega 3 Ingredients for Infant Food Market Share Analysis- Fastest Growing Segment by Application
In the Omega 3 Ingredients for Infant Food Market, the Supplements and Functional Foods application segment is poised to grow the fastest over the next five years. This growth is driven by increasing parental awareness of the benefits of omega-3s for infant health and the growing trend of supplementing infants' diets with additional nutrients. Supplements and functional foods offer targeted health benefits and convenient ways to incorporate omega-3s into infants' diets, which is appealing to health-conscious parents. The expanding range of omega-3-enriched products designed for infants, including fortified foods and dedicated supplements, supports this segment's rapid growth.
Omega 3 Ingredients for Infant Food Market Segmentation
By Type
Marine Source
Plant Source
By Application
Supplements and Functional Foods
Pharmaceuticals
Others
Countries Analyzed
North America (US, Canada, Mexico)
Europe (Germany, UK, France, Spain, Italy, Russia, Rest of Europe)
Asia Pacific (China, India, Japan, South Korea, Australia, South East Asia, Rest of Asia)
South America (Brazil, Argentina, Rest of South America)
Middle East and Africa (Saudi Arabia, UAE, Rest of Middle East, South Africa, Egypt, Rest of Africa)
Omega 3 Ingredients for Infant Food Companies Profiled in the Study
Aker BioMarine
Arista Industries
Axellus
BASF SE
BioProcess Algae
Cargill Inc
Clover Corp
Croda International
EPAX
FMC
Golden Omega
Koninklijke DSM NV
Lonza
Martek Biosciences
Ocean Nutrition Canada
Omega Protein
Pronova BioPharma
TASA
*- List Not Exhaustive
Chapter 1. TABLE OF CONTENTS
Chapter 2. Introduction to Omega 3 Ingredients for Infant Food Market
2.1. Market Overview
2.2. Key Statistics and Report Highlights
2.3. Scope of the Comprehensive Study
2.3.1. Market Definition
2.3.2 Countries and Regions Covered
2.3.3 Research Objective
2.3.4 Units, Currency, and Conversions
2.3.5 Industry Value Chain
2.4. Key Market Segments
2.5. Key Companies
2.6. Study Period
Chapter 3. Strategic Analysis Review
3.1. Omega 3 Ingredients for Infant Food Pricing Analysis and Forecast
3.2. Porter’s Five Forces
3.3. Market Ecosystem
3.4. SWOT Analysis
3.5. Regulatory Scenario
3.3. Effects of Inflation, Russia-Ukraine War, moderating economic growth, and other macroeconomic factors
Chapter 4. Competitive Landscape
4.1. Market Share Analysis
4.1.1. Global Omega 3 Ingredients for Infant Food Market Share by Company, 2023
4.1.2. Product Offerings of Leading Omega 3 Ingredients for Infant Food Companies
4.2. Market Entropy
4.2.1. New Product Launches in the Industry
4.2.2. Mergers, Acquisitions, Joint ventures, and Partnerships
4.3. Key Strategies and Best Practices
Chapter 5. Global Market Projections: Best, Reference, and Low Case Scenarios
5.1. Growth Analysis- Case Scenario Definitions
5.2. Low Growth Case Scenario Forecasts
5.3. Reference Growth Case Scenario Forecasts
5.4. High Growth Case Scenario Forecasts
Chapter 6. Market Dynamics
6.1. Omega 3 Ingredients for Infant Food Market Drivers
6.2. Omega 3 Ingredients for Infant Food Market Challenges
6.6. Omega 3 Ingredients for Infant Food Market Opportunities
6.4. Omega 3 Ingredients for Infant Food Market Trends
Chapter 7. Global Omega 3 Ingredients for Infant Food Market Outlook Trends
7.1. Global Omega 3 Ingredients for Infant Food Revenue (USD Million) and CAGR (%) by Type (2021-2032)
7.2. Global Omega 3 Ingredients for Infant Food Revenue (USD Million) and CAGR (%) by Application (2021-2032)
7.3. Global Omega 3 Ingredients for Infant Food Revenue (USD Million) and CAGR (%) by Product (2021-2032)
By Type
Marine Source
Plant Source
By Application
Supplements and Functional Foods
Pharmaceuticals
Others
Chapter 8. Global Omega 3 Ingredients for Infant Food Regional Analysis and Outlook
8.1. Global Omega 3 Ingredients for Infant Food Revenue (USD Million) By Regions (2021- 2032)
8.2. North America Omega 3 Ingredients for Infant Food Revenue (USD Million) by Country (2021-2032)
8.2.1. United States Omega 3 Ingredients for Infant Food Regional Analysis and Outlook
8.2.2. Canada Omega 3 Ingredients for Infant Food Regional Analysis and Outlook
8.2.3. Mexico Omega 3 Ingredients for Infant Food Regional Analysis and Outlook
8.3. Europe Omega 3 Ingredients for Infant Food Revenue (USD Million), by Country (2021-2032)
8.3.1. Germany Omega 3 Ingredients for Infant Food Regional Analysis and Outlook
8.3.2. France Omega 3 Ingredients for Infant Food Regional Analysis and Outlook
8.3.3. United Kingdom Omega 3 Ingredients for Infant Food Regional Analysis and Outlook
8.3.4. Spain Omega 3 Ingredients for Infant Food Regional Analysis and Outlook
8.3.5. Italy Omega 3 Ingredients for Infant Food Regional Analysis and Outlook
8.3.6. Russia Omega 3 Ingredients for Infant Food Regional Analysis and Outlook
8.3.7. Rest of Europe Omega 3 Ingredients for Infant Food Regional Analysis and Outlook
8.4. Asia Pacific Omega 3 Ingredients for Infant Food Revenue (USD Million) by Country (2021-2032)
8.4.1. China Omega 3 Ingredients for Infant Food Regional Analysis and Outlook
8.4.2. Japan Omega 3 Ingredients for Infant Food Regional Analysis and Outlook
8.4.3. India Omega 3 Ingredients for Infant Food Regional Analysis and Outlook
8.4.4. South Korea Omega 3 Ingredients for Infant Food Regional Analysis and Outlook
8.4.5. Australia Omega 3 Ingredients for Infant Food Regional Analysis and Outlook
8.4.6. South East Asia Omega 3 Ingredients for Infant Food Regional Analysis and Outlook
8.4.7. Rest of Asia Pacific Omega 3 Ingredients for Infant Food Regional Analysis and Outlook
8.5. South America Omega 3 Ingredients for Infant Food Revenue (USD Million), by Country (2021-2032)
8.5.1. Brazil Omega 3 Ingredients for Infant Food Regional Analysis and Outlook
8.5.2. Argentina Omega 3 Ingredients for Infant Food Regional Analysis and Outlook
8.5.3. Rest of South America Omega 3 Ingredients for Infant Food Regional Analysis and Outlook
8.6. Middle East and Africa Omega 3 Ingredients for Infant Food Revenue (USD Million) by Country (2021-2032)
8.6.1. Middle East Omega 3 Ingredients for Infant Food Regional Analysis and Outlook
8.6.2. Africa Omega 3 Ingredients for Infant Food Regional Analysis and Outlook
Chapter 9. North America Omega 3 Ingredients for Infant Food Analysis and Outlook
9.1. North America Omega 3 Ingredients for Infant Food Revenue (USD Million) by Segments (2021-2032)
9.1.1. North America Omega 3 Ingredients for Infant Food Revenue (USD Million) by Type (2021-2032)
9.1.2. North America Omega 3 Ingredients for Infant Food Revenue (USD Million) by Application (2021-2032)
9.1.3. North America Omega 3 Ingredients for Infant Food Revenue (USD Million) by Product (2021-2032)
By Type
Marine Source
Plant Source
By Application
Supplements and Functional Foods
Pharmaceuticals
Others
Chapter 10. Europe Omega 3 Ingredients for Infant Food Analysis and Outlook
10.1. Europe Omega 3 Ingredients for Infant Food Revenue (USD Million), by Segments (USD Million) (2021-2032)
10.1.1. Europe Omega 3 Ingredients for Infant Food Revenue (USD Million) by Type (2021-2032)
10.1.2. Europe Omega 3 Ingredients for Infant Food Revenue (USD Million) by Application (2021-2032)
10.1.3. Europe Omega 3 Ingredients for Infant Food Revenue (USD Million) by Product (2021-2032)
By Type
Marine Source
Plant Source
By Application
Supplements and Functional Foods
Pharmaceuticals
Others
Chapter 11. Asia Pacific Omega 3 Ingredients for Infant Food Analysis and Outlook
11.1. Asia Pacific Omega 3 Ingredients for Infant Food Revenue (USD Million), and Revenue (USD Million) by Segments (2021-2032)
11.1.1. Asia Pacific Omega 3 Ingredients for Infant Food Revenue (USD Million) by Type (2021-2032)
11.1.2. Asia Pacific Omega 3 Ingredients for Infant Food Revenue (USD Million) by Application (2021-2032)
11.1.3. Asia Pacific Omega 3 Ingredients for Infant Food Revenue (USD Million) by Product (2021-2032)
By Type
Marine Source
Plant Source
By Application
Supplements and Functional Foods
Pharmaceuticals
Others
Chapter 12. South America Omega 3 Ingredients for Infant Food Analysis and Outlook
12.1. South America Omega 3 Ingredients for Infant Food Revenue (USD Million), by Segments (2021-2032)
12.1.1. South America Omega 3 Ingredients for Infant Food Revenue (USD Million) by Type (2021-2032)
12.1.2. South America Omega 3 Ingredients for Infant Food Revenue (USD Million) by Application (2021-2032)
12.1.3. South America Omega 3 Ingredients for Infant Food Revenue (USD Million) by Product (2021-2032)
By Type
Marine Source
Plant Source
By Application
Supplements and Functional Foods
Pharmaceuticals
Others
Chapter 13. Middle East and Africa Omega 3 Ingredients for Infant Food Analysis and Outlook
13.1. Middle East and Africa Omega 3 Ingredients for Infant Food Revenue (USD Million), by Segments (2021-2032)
13.1.1. Middle East and Africa Omega 3 Ingredients for Infant Food Revenue (USD Million) by Type (2021-2032)
13.1.2. Middle East and Africa Omega 3 Ingredients for Infant Food Revenue (USD Million) by Application (2021-2032)
13.1.3. Middle East and Africa Omega 3 Ingredients for Infant Food Revenue (USD Million) by Product (2021-2032)
By Type
Marine Source
Plant Source
By Application
Supplements and Functional Foods
Pharmaceuticals
Others
Chapter 14. Omega 3 Ingredients for Infant Food Company Profiles
14.1 Business Overview
14.2 Product Profiles
14.3 SWOT Profiles
14.5 Recent Developments
14.6 Financial Profile
List of Companies
Aker BioMarine
Arista Industries
Axellus
BASF SE
BioProcess Algae
Cargill Inc
Clover Corp
Croda International
EPAX
FMC
Golden Omega
Koninklijke DSM NV
Lonza
Martek Biosciences
Ocean Nutrition Canada
Omega Protein
Pronova BioPharma
TASA
15. Methodology and Data Sources
15.1 Customization Offerings
15.2 Subscription Services
15.3 Related Reports
15.4 Publisher Expertise
LIST OF TABLES
Table 1 Market Segmentation Analysis
Table 2 Global Omega 3 Ingredients for Infant Food Market Share of Leading Companies, 2023
Table 3 Product Offerings of Leading Companies
Table 4 Low Growth Scenario Forecasts
Table 5 Reference Case Growth Scenario
Table 6 High Growth Case Scenario
Table 7 Global Omega 3 Ingredients for Infant Food Revenue (USD Million) And CAGR (%) By Type (2021-2032)
Table 8 Global Omega 3 Ingredients for Infant Food Revenue (USD Million) And CAGR (%) By Application (2021-2032)
Table 9 Global Omega 3 Ingredients for Infant Food Revenue (USD Million) And CAGR (%) By Product (2021-2032)
Table 10 Global Omega 3 Ingredients for Infant Food Market Revenue (USD Million) By Regions (2021-2032)
Table 11 Global Omega 3 Ingredients for Infant Food Market Share (%) By Regions (2021-2032)
Table 12 North America Omega 3 Ingredients for Infant Food Revenue (USD Million) By Country (2021-2032)
Table 13 Europe Omega 3 Ingredients for Infant Food Revenue (USD Million) By Country (2021-2032)
Table 14 Asia Pacific Omega 3 Ingredients for Infant Food Revenue (USD Million) By Country (2021-2032)
Table 15 South America Omega 3 Ingredients for Infant Food Revenue (USD Million) By Country (2021-2032)
Table 16 Middle East and Africa Omega 3 Ingredients for Infant Food Revenue (USD Million) By Region (2021-2032)
Table 17 North America Omega 3 Ingredients for Infant Food Revenue (USD Million) By Type (2021-2032)
Table 18 North America Omega 3 Ingredients for Infant Food Revenue (USD Million) By Application (2021-2032)
Table 19 North America Omega 3 Ingredients for Infant Food Revenue (USD Million) By Product (2021-2032)
Table 20 Europe Omega 3 Ingredients for Infant Food Revenue (USD Million) By Type (2021-2032)
Table 21 Europe Omega 3 Ingredients for Infant Food Revenue (USD Million) By Application (2021-2032)
Table 22 Europe Omega 3 Ingredients for Infant Food Revenue (USD Million) By Product (2021-2032)
Table 23 Asia Pacific Omega 3 Ingredients for Infant Food Revenue (USD Million) By Type (2021-2032)
Table 24 Asia Pacific Omega 3 Ingredients for Infant Food Revenue (USD Million) By Application (2021-2032)
Table 25 Asia Pacific Omega 3 Ingredients for Infant Food Revenue (USD Million) By Product (2021-2032)
Table 26 South America Omega 3 Ingredients for Infant Food Revenue (USD Million) By Type (2021-2032)
Table 27 South America Omega 3 Ingredients for Infant Food Revenue (USD Million) By Application (2021-2032)
Table 28 South America Omega 3 Ingredients for Infant Food Revenue (USD Million) By Product (2021-2032)
Table 29 Middle East and Africa Omega 3 Ingredients for Infant Food Revenue (USD Million) By Type (2021-2032)
Table 30 Middle East and Africa Omega 3 Ingredients for Infant Food Revenue (USD Million) By Application (2021-2032)
Table 31 Middle East and Africa Omega 3 Ingredients for Infant Food Revenue (USD Million) By Product (2021-2032)
LIST OF FIGURES
Figure 1. Market Scope
Figure 2. Pricing Forecasts Per Unit, 2023- 2032
Figure 3. Porter’s Five Forces
Figure 4. Global Omega 3 Ingredients for Infant Food Market Revenue (USD Million) By Regions (2021-2032)
Figure 5. Global Omega 3 Ingredients for Infant Food Market Share (%) By Regions (2023)
Figure 6. North America Omega 3 Ingredients for Infant Food Revenue (USD Million) By Country (2021-2032)
Figure 7. United States Omega 3 Ingredients for Infant Food Revenue (USD Million) By Country (2021-2032)
Figure 8. Canada Omega 3 Ingredients for Infant Food Revenue (USD Million) By Country (2021-2032)
Figure 9. Mexico Omega 3 Ingredients for Infant Food Revenue (USD Million) By Country (2021-2032)
Figure 10. Europe Omega 3 Ingredients for Infant Food Revenue (USD Million) By Country (2021-2032)
Figure 11. Germany Omega 3 Ingredients for Infant Food Revenue (USD Million) By Country (2021-2032)
Figure 12. France Omega 3 Ingredients for Infant Food Revenue (USD Million) By Country (2021-2032)
Figure 13. United Kingdom Omega 3 Ingredients for Infant Food Revenue (USD Million) By Country (2021-2032)
Figure 14. Spain Omega 3 Ingredients for Infant Food Revenue (USD Million) By Country (2021-2032)
Figure 15. Italy Omega 3 Ingredients for Infant Food Revenue (USD Million) By Country (2021-2032)
Figure 16. Russia Omega 3 Ingredients for Infant Food Revenue (USD Million) By Country (2021-2032)
Figure 17. Rest of Europe Omega 3 Ingredients for Infant Food Revenue (USD Million) By Country (2021-2032)
Figure 11. Asia Pacific Omega 3 Ingredients for Infant Food Revenue (USD Million) By Country (2021-2032)
Figure 12. China Omega 3 Ingredients for Infant Food Revenue (USD Million) By Country (2021-2032)
Figure 13. Japan Omega 3 Ingredients for Infant Food Revenue (USD Million) By Country (2021-2032)
Figure 14. India Omega 3 Ingredients for Infant Food Revenue (USD Million) By Country (2021-2032)
Figure 15. South Korea Omega 3 Ingredients for Infant Food Revenue (USD Million) By Country (2021-2032)
Figure 16. Australia Omega 3 Ingredients for Infant Food Revenue (USD Million) By Country (2021-2032)
Figure 17. South East Asia Omega 3 Ingredients for Infant Food Revenue (USD Million) By Country (2021-2032)
Figure 18. South America Omega 3 Ingredients for Infant Food Revenue (USD Million) By Country (2021-2032)
Figure 19. Brazil Omega 3 Ingredients for Infant Food Revenue (USD Million) By Country (2021-2032)
Figure 20. Argentina Omega 3 Ingredients for Infant Food Revenue (USD Million) By Country (2021-2032)
Figure 21. Rest of Asia Pacific Omega 3 Ingredients for Infant Food Revenue (USD Million) By Country (2021-2032)
Figure 22. Middle East and Africa Omega 3 Ingredients for Infant Food Revenue (USD Million) By Region (2021-2032)
Figure 23. Saudi Arabia Omega 3 Ingredients for Infant Food Revenue (USD Million) By Region (2021-2032)
Figure 24. The UAE Omega 3 Ingredients for Infant Food Revenue (USD Million) By Region (2021-2032)
Figure 25. Rest of Middle East Omega 3 Ingredients for Infant Food Revenue (USD Million) By Region (2021-2032)
Figure 26. South Africa Omega 3 Ingredients for Infant Food Revenue (USD Million) By Region (2021-2032)
Figure 27. Africa Omega 3 Ingredients for Infant Food Revenue (USD Million) By Region (2021-2032)
Figure 28. North America Omega 3 Ingredients for Infant Food Revenue (USD Million) By Type (2021-2032)
Figure 29. North America Omega 3 Ingredients for Infant Food Revenue (USD Million) By Application (2021-2032)
Figure 30. North America Omega 3 Ingredients for Infant Food Revenue (USD Million) By Product (2021-2032)
Figure 31. Europe Omega 3 Ingredients for Infant Food Revenue (USD Million) By Type (2021-2032)
Figure 32. Europe Omega 3 Ingredients for Infant Food Revenue (USD Million) By Application (2021-2032)
Figure 33. Europe Omega 3 Ingredients for Infant Food Revenue (USD Million) By Product (2021-2032)
Figure 34. Asia Pacific Omega 3 Ingredients for Infant Food Revenue (USD Million) By Type (2021-2032)
Figure 35. Asia Pacific Omega 3 Ingredients for Infant Food Revenue (USD Million) By Application (2021-2032)
Figure 36. Asia Pacific Omega 3 Ingredients for Infant Food Revenue (USD Million) By Product (2021-2032)
Figure 37. South America Omega 3 Ingredients for Infant Food Revenue (USD Million) By Type (2021-2032)
Figure 38. South America Omega 3 Ingredients for Infant Food Revenue (USD Million) By Application (2021-2032)
Figure 39. South America Omega 3 Ingredients for Infant Food Revenue (USD Million) By Product (2021-2032)
Figure 40. Middle East and Africa Omega 3 Ingredients for Infant Food Revenue (USD Million) By Type (2021-2032)
Figure 41. Middle East and Africa Omega 3 Ingredients for Infant Food Revenue (USD Million) By Application (2021-2032)
Figure 42. Middle East and Africa Omega 3 Ingredients for Infant Food Revenue (USD Million) By Product (2021-2032)
By Type
Marine Source
Plant Source
By Application
Supplements and Functional Foods
Pharmaceuticals
Others
Countries Analyzed
North America (US, Canada, Mexico)
Europe (Germany, UK, France, Spain, Italy, Russia, Rest of Europe)
Asia Pacific (China, India, Japan, South Korea, Australia, South East Asia, Rest of Asia)
South America (Brazil, Argentina, Rest of South America)
Middle East and Africa (Saudi Arabia, UAE, Rest of Middle East, South Africa, Egypt, Rest of Africa)
