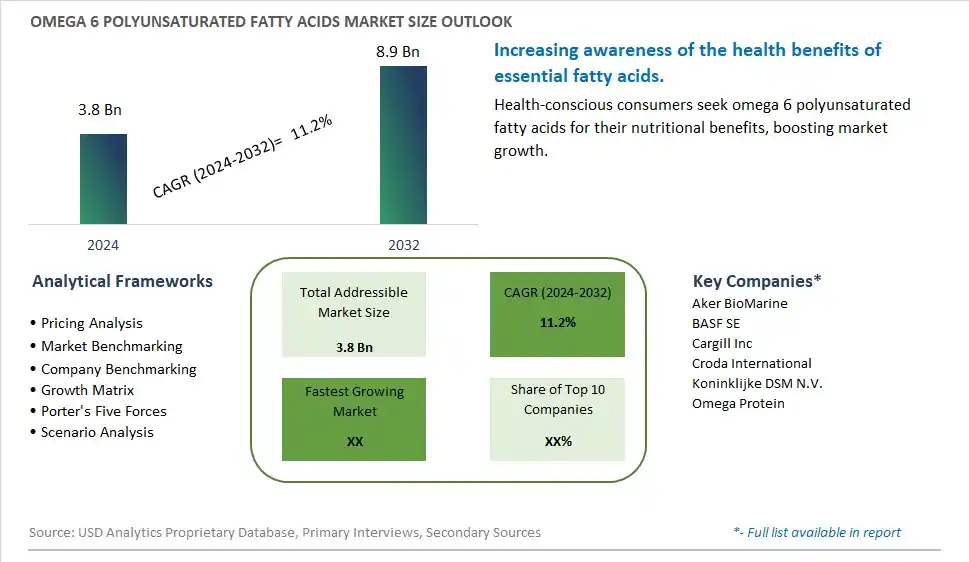
Global Omega 6 Polyunsaturated Fatty Acids Market Size is valued at $3.8 Billion in 2024 and is forecast to register a growth rate (CAGR) of 11.2% to reach $8.9 Billion by 2032.
The global Omega 6 Polyunsaturated Fatty Acids Market Comprehensive Study analyzes and forecasts the market size across 6 regions and 24 countries for diverse segments -By Type (Linolenic Acid (LA), Arachidonic Acid (AA)), By Application (Food and Beverages, Pharmaceuticals, Animal Food and Feed)
An Introduction to Omega 6 Polyunsaturated Fatty Acids Market
In 2024, the omega-6 polyunsaturated fatty acids market is thriving, driven by the demand for essential fats that support heart health, brain function, and overall wellness. Omega-6 fatty acids, such as linoleic acid, are incorporated into supplements, functional foods, and fortified products. The market benefits from advancements in extraction and formulation technologies that enhance stability and bioavailability. The trend towards clean label and natural ingredients is influencing product development. Increasing consumer awareness of the health benefits of omega-6 fatty acids and the popularity of functional foods are further supporting market growth.
Omega 6 Polyunsaturated Fatty Acids Competitive Landscape
The market report analyses the leading companies in the industry including Aker BioMarine, BASF SE, Cargill Inc, Croda International, Koninklijke DSM N.V., Omega Protein, and Others.
Omega 6 Polyunsaturated Fatty Acids Market Dynamics
Omega 6 Polyunsaturated Fatty Acids Market Trend: Increasing Use in Functional Foods and Nutraceuticals
The most prominent trend in the Omega 6 Polyunsaturated Fatty Acids Market is the increasing use in functional foods and nutraceuticals. Omega-6 polyunsaturated fatty acids (PUFAs), known for their role in cellular function and inflammation regulation, are being incorporated into a variety of health-focused products. This trend is driven by the demand for ingredients that offer specific health benefits and enhance the nutritional value of consumer products.
Omega 6 Polyunsaturated Fatty Acids Market Driver: Health Consciousness and Demand for Nutritional Enhancements
A key driver in the Omega 6 Polyunsaturated Fatty Acids Market is health consciousness and the demand for nutritional enhancements. As more individuals focus on improving their diet and incorporating beneficial nutrients, there is a rising demand for omega-6 PUFAs that support heart health, skin health, and immune function. This demand supports the growth of the market as consumers seek to include more functional ingredients in their diets.
Omega 6 Polyunsaturated Fatty Acids Market Opportunity: Innovation in Food and Beverage Applications
One significant opportunity in the Omega 6 Polyunsaturated Fatty Acids Market lies in innovation in food and beverage applications. Companies can develop new products that incorporate omega-6 PUFAs into functional foods, beverages, and dietary supplements, offering consumers convenient and effective ways to enhance their intake. By highlighting the health benefits and versatility of omega-6 PUFAs, manufacturers can attract a broader consumer base and drive market growth.
Omega 6 Polyunsaturated Fatty Acids Market Share Analysis- Largest Segment by Type
In the Omega 6 Polyunsaturated Fatty Acids Market, Linolenic Acid (LA) is the largest segment. This predominance is due to LA’s wide range of applications in both dietary supplements and functional foods, as well as its recognized benefits for cardiovascular health. Linolenic acid, a key component of omega-6 fatty acids, is integral to various health-related products because of its role in reducing inflammation and supporting cellular function. Its extensive use in consumer products and the strong market presence of LA in both over-the-counter and prescription supplements contribute to its position as the largest segment.
Omega 6 Polyunsaturated Fatty Acids Market Share Analysis- Fastest Growing Segment by Application
In the Omega 6 Polyunsaturated Fatty Acids Market, the Pharmaceuticals application segment is poised to grow the fastest over the next five years. This growth is driven by increasing research and development activities focusing on the therapeutic benefits of omega-6 fatty acids, such as their role in managing chronic inflammatory conditions and supporting mental health. As pharmaceutical companies invest more in developing omega-6-based therapies and as the demand for functional medicines rises, the pharmaceuticals segment is expected to experience substantial growth. The segment’s expansion is also supported by the increasing recognition of omega-6 fatty acids in clinical nutrition and personalized medicine.
Omega 6 Polyunsaturated Fatty Acids Market Segmentation
By Type
Linolenic Acid (LA)
Arachidonic Acid (AA)
By Application
Food and Beverages
Pharmaceuticals
Animal Food and Feed
Countries Analyzed
North America (US, Canada, Mexico)
Europe (Germany, UK, France, Spain, Italy, Russia, Rest of Europe)
Asia Pacific (China, India, Japan, South Korea, Australia, South East Asia, Rest of Asia)
South America (Brazil, Argentina, Rest of South America)
Middle East and Africa (Saudi Arabia, UAE, Rest of Middle East, South Africa, Egypt, Rest of Africa)
Omega 6 Polyunsaturated Fatty Acids Companies Profiled in the Study
Aker BioMarine
BASF SE
Cargill Inc
Croda International
Koninklijke DSM N.V.
Omega Protein
*- List Not Exhaustive
Chapter 1. TABLE OF CONTENTS
Chapter 2. Introduction to Omega 6 Polyunsaturated Fatty Acids Market
2.1. Market Overview
2.2. Key Statistics and Report Highlights
2.3. Scope of the Comprehensive Study
2.3.1. Market Definition
2.3.2 Countries and Regions Covered
2.3.3 Research Objective
2.3.4 Units, Currency, and Conversions
2.3.5 Industry Value Chain
2.4. Key Market Segments
2.5. Key Companies
2.6. Study Period
Chapter 3. Strategic Analysis Review
3.1. Omega 6 Polyunsaturated Fatty Acids Pricing Analysis and Forecast
3.2. Porter’s Five Forces
3.3. Market Ecosystem
3.4. SWOT Analysis
3.5. Regulatory Scenario
3.3. Effects of Inflation, Russia-Ukraine War, moderating economic growth, and other macroeconomic factors
Chapter 4. Competitive Landscape
4.1. Market Share Analysis
4.1.1. Global Omega 6 Polyunsaturated Fatty Acids Market Share by Company, 2023
4.1.2. Product Offerings of Leading Omega 6 Polyunsaturated Fatty Acids Companies
4.2. Market Entropy
4.2.1. New Product Launches in the Industry
4.2.2. Mergers, Acquisitions, Joint ventures, and Partnerships
4.3. Key Strategies and Best Practices
Chapter 5. Global Market Projections: Best, Reference, and Low Case Scenarios
5.1. Growth Analysis- Case Scenario Definitions
5.2. Low Growth Case Scenario Forecasts
5.3. Reference Growth Case Scenario Forecasts
5.4. High Growth Case Scenario Forecasts
Chapter 6. Market Dynamics
6.1. Omega 6 Polyunsaturated Fatty Acids Market Drivers
6.2. Omega 6 Polyunsaturated Fatty Acids Market Challenges
6.6. Omega 6 Polyunsaturated Fatty Acids Market Opportunities
6.4. Omega 6 Polyunsaturated Fatty Acids Market Trends
Chapter 7. Global Omega 6 Polyunsaturated Fatty Acids Market Outlook Trends
7.1. Global Omega 6 Polyunsaturated Fatty Acids Revenue (USD Million) and CAGR (%) by Type (2021-2032)
7.2. Global Omega 6 Polyunsaturated Fatty Acids Revenue (USD Million) and CAGR (%) by Application (2021-2032)
7.3. Global Omega 6 Polyunsaturated Fatty Acids Revenue (USD Million) and CAGR (%) by Product (2021-2032)
By Type
Linolenic Acid (LA)
Arachidonic Acid (AA)
By Application
Food and Beverages
Pharmaceuticals
Animal Food and Feed
Chapter 8. Global Omega 6 Polyunsaturated Fatty Acids Regional Analysis and Outlook
8.1. Global Omega 6 Polyunsaturated Fatty Acids Revenue (USD Million) By Regions (2021- 2032)
8.2. North America Omega 6 Polyunsaturated Fatty Acids Revenue (USD Million) by Country (2021-2032)
8.2.1. United States Omega 6 Polyunsaturated Fatty Acids Regional Analysis and Outlook
8.2.2. Canada Omega 6 Polyunsaturated Fatty Acids Regional Analysis and Outlook
8.2.3. Mexico Omega 6 Polyunsaturated Fatty Acids Regional Analysis and Outlook
8.3. Europe Omega 6 Polyunsaturated Fatty Acids Revenue (USD Million), by Country (2021-2032)
8.3.1. Germany Omega 6 Polyunsaturated Fatty Acids Regional Analysis and Outlook
8.3.2. France Omega 6 Polyunsaturated Fatty Acids Regional Analysis and Outlook
8.3.3. United Kingdom Omega 6 Polyunsaturated Fatty Acids Regional Analysis and Outlook
8.3.4. Spain Omega 6 Polyunsaturated Fatty Acids Regional Analysis and Outlook
8.3.5. Italy Omega 6 Polyunsaturated Fatty Acids Regional Analysis and Outlook
8.3.6. Russia Omega 6 Polyunsaturated Fatty Acids Regional Analysis and Outlook
8.3.7. Rest of Europe Omega 6 Polyunsaturated Fatty Acids Regional Analysis and Outlook
8.4. Asia Pacific Omega 6 Polyunsaturated Fatty Acids Revenue (USD Million) by Country (2021-2032)
8.4.1. China Omega 6 Polyunsaturated Fatty Acids Regional Analysis and Outlook
8.4.2. Japan Omega 6 Polyunsaturated Fatty Acids Regional Analysis and Outlook
8.4.3. India Omega 6 Polyunsaturated Fatty Acids Regional Analysis and Outlook
8.4.4. South Korea Omega 6 Polyunsaturated Fatty Acids Regional Analysis and Outlook
8.4.5. Australia Omega 6 Polyunsaturated Fatty Acids Regional Analysis and Outlook
8.4.6. South East Asia Omega 6 Polyunsaturated Fatty Acids Regional Analysis and Outlook
8.4.7. Rest of Asia Pacific Omega 6 Polyunsaturated Fatty Acids Regional Analysis and Outlook
8.5. South America Omega 6 Polyunsaturated Fatty Acids Revenue (USD Million), by Country (2021-2032)
8.5.1. Brazil Omega 6 Polyunsaturated Fatty Acids Regional Analysis and Outlook
8.5.2. Argentina Omega 6 Polyunsaturated Fatty Acids Regional Analysis and Outlook
8.5.3. Rest of South America Omega 6 Polyunsaturated Fatty Acids Regional Analysis and Outlook
8.6. Middle East and Africa Omega 6 Polyunsaturated Fatty Acids Revenue (USD Million) by Country (2021-2032)
8.6.1. Middle East Omega 6 Polyunsaturated Fatty Acids Regional Analysis and Outlook
8.6.2. Africa Omega 6 Polyunsaturated Fatty Acids Regional Analysis and Outlook
Chapter 9. North America Omega 6 Polyunsaturated Fatty Acids Analysis and Outlook
9.1. North America Omega 6 Polyunsaturated Fatty Acids Revenue (USD Million) by Segments (2021-2032)
9.1.1. North America Omega 6 Polyunsaturated Fatty Acids Revenue (USD Million) by Type (2021-2032)
9.1.2. North America Omega 6 Polyunsaturated Fatty Acids Revenue (USD Million) by Application (2021-2032)
9.1.3. North America Omega 6 Polyunsaturated Fatty Acids Revenue (USD Million) by Product (2021-2032)
By Type
Linolenic Acid (LA)
Arachidonic Acid (AA)
By Application
Food and Beverages
Pharmaceuticals
Animal Food and Feed
Chapter 10. Europe Omega 6 Polyunsaturated Fatty Acids Analysis and Outlook
10.1. Europe Omega 6 Polyunsaturated Fatty Acids Revenue (USD Million), by Segments (USD Million) (2021-2032)
10.1.1. Europe Omega 6 Polyunsaturated Fatty Acids Revenue (USD Million) by Type (2021-2032)
10.1.2. Europe Omega 6 Polyunsaturated Fatty Acids Revenue (USD Million) by Application (2021-2032)
10.1.3. Europe Omega 6 Polyunsaturated Fatty Acids Revenue (USD Million) by Product (2021-2032)
By Type
Linolenic Acid (LA)
Arachidonic Acid (AA)
By Application
Food and Beverages
Pharmaceuticals
Animal Food and Feed
Chapter 11. Asia Pacific Omega 6 Polyunsaturated Fatty Acids Analysis and Outlook
11.1. Asia Pacific Omega 6 Polyunsaturated Fatty Acids Revenue (USD Million), and Revenue (USD Million) by Segments (2021-2032)
11.1.1. Asia Pacific Omega 6 Polyunsaturated Fatty Acids Revenue (USD Million) by Type (2021-2032)
11.1.2. Asia Pacific Omega 6 Polyunsaturated Fatty Acids Revenue (USD Million) by Application (2021-2032)
11.1.3. Asia Pacific Omega 6 Polyunsaturated Fatty Acids Revenue (USD Million) by Product (2021-2032)
By Type
Linolenic Acid (LA)
Arachidonic Acid (AA)
By Application
Food and Beverages
Pharmaceuticals
Animal Food and Feed
Chapter 12. South America Omega 6 Polyunsaturated Fatty Acids Analysis and Outlook
12.1. South America Omega 6 Polyunsaturated Fatty Acids Revenue (USD Million), by Segments (2021-2032)
12.1.1. South America Omega 6 Polyunsaturated Fatty Acids Revenue (USD Million) by Type (2021-2032)
12.1.2. South America Omega 6 Polyunsaturated Fatty Acids Revenue (USD Million) by Application (2021-2032)
12.1.3. South America Omega 6 Polyunsaturated Fatty Acids Revenue (USD Million) by Product (2021-2032)
By Type
Linolenic Acid (LA)
Arachidonic Acid (AA)
By Application
Food and Beverages
Pharmaceuticals
Animal Food and Feed
Chapter 13. Middle East and Africa Omega 6 Polyunsaturated Fatty Acids Analysis and Outlook
13.1. Middle East and Africa Omega 6 Polyunsaturated Fatty Acids Revenue (USD Million), by Segments (2021-2032)
13.1.1. Middle East and Africa Omega 6 Polyunsaturated Fatty Acids Revenue (USD Million) by Type (2021-2032)
13.1.2. Middle East and Africa Omega 6 Polyunsaturated Fatty Acids Revenue (USD Million) by Application (2021-2032)
13.1.3. Middle East and Africa Omega 6 Polyunsaturated Fatty Acids Revenue (USD Million) by Product (2021-2032)
By Type
Linolenic Acid (LA)
Arachidonic Acid (AA)
By Application
Food and Beverages
Pharmaceuticals
Animal Food and Feed
Chapter 14. Omega 6 Polyunsaturated Fatty Acids Company Profiles
14.1 Business Overview
14.2 Product Profiles
14.3 SWOT Profiles
14.5 Recent Developments
14.6 Financial Profile
List of Companies
Aker BioMarine
BASF SE
Cargill Inc
Croda International
Koninklijke DSM N.V.
Omega Protein
15. Methodology and Data Sources
15.1 Customization Offerings
15.2 Subscription Services
15.3 Related Reports
15.4 Publisher Expertise
LIST OF TABLES
Table 1 Market Segmentation Analysis
Table 2 Global Omega 6 Polyunsaturated Fatty Acids Market Share of Leading Companies, 2023
Table 3 Product Offerings of Leading Companies
Table 4 Low Growth Scenario Forecasts
Table 5 Reference Case Growth Scenario
Table 6 High Growth Case Scenario
Table 7 Global Omega 6 Polyunsaturated Fatty Acids Revenue (USD Million) And CAGR (%) By Type (2021-2032)
Table 8 Global Omega 6 Polyunsaturated Fatty Acids Revenue (USD Million) And CAGR (%) By Application (2021-2032)
Table 9 Global Omega 6 Polyunsaturated Fatty Acids Revenue (USD Million) And CAGR (%) By Product (2021-2032)
Table 10 Global Omega 6 Polyunsaturated Fatty Acids Market Revenue (USD Million) By Regions (2021-2032)
Table 11 Global Omega 6 Polyunsaturated Fatty Acids Market Share (%) By Regions (2021-2032)
Table 12 North America Omega 6 Polyunsaturated Fatty Acids Revenue (USD Million) By Country (2021-2032)
Table 13 Europe Omega 6 Polyunsaturated Fatty Acids Revenue (USD Million) By Country (2021-2032)
Table 14 Asia Pacific Omega 6 Polyunsaturated Fatty Acids Revenue (USD Million) By Country (2021-2032)
Table 15 South America Omega 6 Polyunsaturated Fatty Acids Revenue (USD Million) By Country (2021-2032)
Table 16 Middle East and Africa Omega 6 Polyunsaturated Fatty Acids Revenue (USD Million) By Region (2021-2032)
Table 17 North America Omega 6 Polyunsaturated Fatty Acids Revenue (USD Million) By Type (2021-2032)
Table 18 North America Omega 6 Polyunsaturated Fatty Acids Revenue (USD Million) By Application (2021-2032)
Table 19 North America Omega 6 Polyunsaturated Fatty Acids Revenue (USD Million) By Product (2021-2032)
Table 20 Europe Omega 6 Polyunsaturated Fatty Acids Revenue (USD Million) By Type (2021-2032)
Table 21 Europe Omega 6 Polyunsaturated Fatty Acids Revenue (USD Million) By Application (2021-2032)
Table 22 Europe Omega 6 Polyunsaturated Fatty Acids Revenue (USD Million) By Product (2021-2032)
Table 23 Asia Pacific Omega 6 Polyunsaturated Fatty Acids Revenue (USD Million) By Type (2021-2032)
Table 24 Asia Pacific Omega 6 Polyunsaturated Fatty Acids Revenue (USD Million) By Application (2021-2032)
Table 25 Asia Pacific Omega 6 Polyunsaturated Fatty Acids Revenue (USD Million) By Product (2021-2032)
Table 26 South America Omega 6 Polyunsaturated Fatty Acids Revenue (USD Million) By Type (2021-2032)
Table 27 South America Omega 6 Polyunsaturated Fatty Acids Revenue (USD Million) By Application (2021-2032)
Table 28 South America Omega 6 Polyunsaturated Fatty Acids Revenue (USD Million) By Product (2021-2032)
Table 29 Middle East and Africa Omega 6 Polyunsaturated Fatty Acids Revenue (USD Million) By Type (2021-2032)
Table 30 Middle East and Africa Omega 6 Polyunsaturated Fatty Acids Revenue (USD Million) By Application (2021-2032)
Table 31 Middle East and Africa Omega 6 Polyunsaturated Fatty Acids Revenue (USD Million) By Product (2021-2032)
LIST OF FIGURES
Figure 1. Market Scope
Figure 2. Pricing Forecasts Per Unit, 2023- 2032
Figure 3. Porter’s Five Forces
Figure 4. Global Omega 6 Polyunsaturated Fatty Acids Market Revenue (USD Million) By Regions (2021-2032)
Figure 5. Global Omega 6 Polyunsaturated Fatty Acids Market Share (%) By Regions (2023)
Figure 6. North America Omega 6 Polyunsaturated Fatty Acids Revenue (USD Million) By Country (2021-2032)
Figure 7. United States Omega 6 Polyunsaturated Fatty Acids Revenue (USD Million) By Country (2021-2032)
Figure 8. Canada Omega 6 Polyunsaturated Fatty Acids Revenue (USD Million) By Country (2021-2032)
Figure 9. Mexico Omega 6 Polyunsaturated Fatty Acids Revenue (USD Million) By Country (2021-2032)
Figure 10. Europe Omega 6 Polyunsaturated Fatty Acids Revenue (USD Million) By Country (2021-2032)
Figure 11. Germany Omega 6 Polyunsaturated Fatty Acids Revenue (USD Million) By Country (2021-2032)
Figure 12. France Omega 6 Polyunsaturated Fatty Acids Revenue (USD Million) By Country (2021-2032)
Figure 13. United Kingdom Omega 6 Polyunsaturated Fatty Acids Revenue (USD Million) By Country (2021-2032)
Figure 14. Spain Omega 6 Polyunsaturated Fatty Acids Revenue (USD Million) By Country (2021-2032)
Figure 15. Italy Omega 6 Polyunsaturated Fatty Acids Revenue (USD Million) By Country (2021-2032)
Figure 16. Russia Omega 6 Polyunsaturated Fatty Acids Revenue (USD Million) By Country (2021-2032)
Figure 17. Rest of Europe Omega 6 Polyunsaturated Fatty Acids Revenue (USD Million) By Country (2021-2032)
Figure 11. Asia Pacific Omega 6 Polyunsaturated Fatty Acids Revenue (USD Million) By Country (2021-2032)
Figure 12. China Omega 6 Polyunsaturated Fatty Acids Revenue (USD Million) By Country (2021-2032)
Figure 13. Japan Omega 6 Polyunsaturated Fatty Acids Revenue (USD Million) By Country (2021-2032)
Figure 14. India Omega 6 Polyunsaturated Fatty Acids Revenue (USD Million) By Country (2021-2032)
Figure 15. South Korea Omega 6 Polyunsaturated Fatty Acids Revenue (USD Million) By Country (2021-2032)
Figure 16. Australia Omega 6 Polyunsaturated Fatty Acids Revenue (USD Million) By Country (2021-2032)
Figure 17. South East Asia Omega 6 Polyunsaturated Fatty Acids Revenue (USD Million) By Country (2021-2032)
Figure 18. South America Omega 6 Polyunsaturated Fatty Acids Revenue (USD Million) By Country (2021-2032)
Figure 19. Brazil Omega 6 Polyunsaturated Fatty Acids Revenue (USD Million) By Country (2021-2032)
Figure 20. Argentina Omega 6 Polyunsaturated Fatty Acids Revenue (USD Million) By Country (2021-2032)
Figure 21. Rest of Asia Pacific Omega 6 Polyunsaturated Fatty Acids Revenue (USD Million) By Country (2021-2032)
Figure 22. Middle East and Africa Omega 6 Polyunsaturated Fatty Acids Revenue (USD Million) By Region (2021-2032)
Figure 23. Saudi Arabia Omega 6 Polyunsaturated Fatty Acids Revenue (USD Million) By Region (2021-2032)
Figure 24. The UAE Omega 6 Polyunsaturated Fatty Acids Revenue (USD Million) By Region (2021-2032)
Figure 25. Rest of Middle East Omega 6 Polyunsaturated Fatty Acids Revenue (USD Million) By Region (2021-2032)
Figure 26. South Africa Omega 6 Polyunsaturated Fatty Acids Revenue (USD Million) By Region (2021-2032)
Figure 27. Africa Omega 6 Polyunsaturated Fatty Acids Revenue (USD Million) By Region (2021-2032)
Figure 28. North America Omega 6 Polyunsaturated Fatty Acids Revenue (USD Million) By Type (2021-2032)
Figure 29. North America Omega 6 Polyunsaturated Fatty Acids Revenue (USD Million) By Application (2021-2032)
Figure 30. North America Omega 6 Polyunsaturated Fatty Acids Revenue (USD Million) By Product (2021-2032)
Figure 31. Europe Omega 6 Polyunsaturated Fatty Acids Revenue (USD Million) By Type (2021-2032)
Figure 32. Europe Omega 6 Polyunsaturated Fatty Acids Revenue (USD Million) By Application (2021-2032)
Figure 33. Europe Omega 6 Polyunsaturated Fatty Acids Revenue (USD Million) By Product (2021-2032)
Figure 34. Asia Pacific Omega 6 Polyunsaturated Fatty Acids Revenue (USD Million) By Type (2021-2032)
Figure 35. Asia Pacific Omega 6 Polyunsaturated Fatty Acids Revenue (USD Million) By Application (2021-2032)
Figure 36. Asia Pacific Omega 6 Polyunsaturated Fatty Acids Revenue (USD Million) By Product (2021-2032)
Figure 37. South America Omega 6 Polyunsaturated Fatty Acids Revenue (USD Million) By Type (2021-2032)
Figure 38. South America Omega 6 Polyunsaturated Fatty Acids Revenue (USD Million) By Application (2021-2032)
Figure 39. South America Omega 6 Polyunsaturated Fatty Acids Revenue (USD Million) By Product (2021-2032)
Figure 40. Middle East and Africa Omega 6 Polyunsaturated Fatty Acids Revenue (USD Million) By Type (2021-2032)
Figure 41. Middle East and Africa Omega 6 Polyunsaturated Fatty Acids Revenue (USD Million) By Application (2021-2032)
Figure 42. Middle East and Africa Omega 6 Polyunsaturated Fatty Acids Revenue (USD Million) By Product (2021-2032)
By Type
Linolenic Acid (LA)
Arachidonic Acid (AA)
By Application
Food and Beverages
Pharmaceuticals
Animal Food and Feed
Countries Analyzed
North America (US, Canada, Mexico)
Europe (Germany, UK, France, Spain, Italy, Russia, Rest of Europe)
Asia Pacific (China, India, Japan, South Korea, Australia, South East Asia, Rest of Asia)
South America (Brazil, Argentina, Rest of South America)
Middle East and Africa (Saudi Arabia, UAE, Rest of Middle East, South Africa, Egypt, Rest of Africa)
