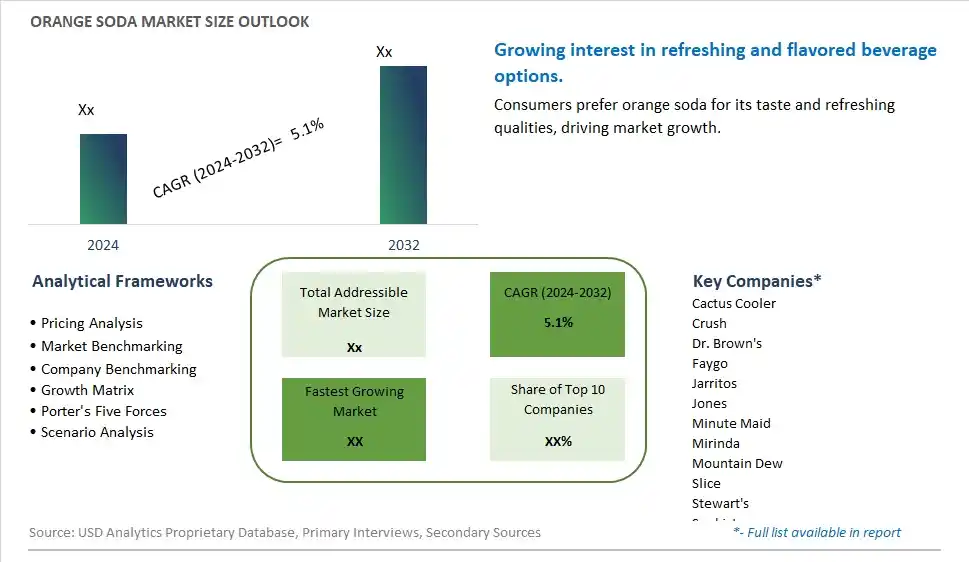
Global Orange Soda Market Size is valued at $XX Million in 2024 and is forecast to register a growth rate (CAGR) of 5.1% to reach $XX Million by 2032.
The global Orange Soda Market Comprehensive Study analyzes and forecasts the market size across 6 regions and 24 countries for diverse segments -By Type (0 Kcal Type, Above 0 Kcal Type), By Application (Supermarkets/Hypermarkets, Convenience Stores, Independent Retailers, Online Sales, Others)
An Introduction to Orange Soda Market
In 2024, the orange soda market is thriving, fueled by the demand for refreshing and fruity soft drinks. Orange soda, made with natural orange flavors and sweeteners, offers a popular alternative to traditional colas. The market benefits from innovations in flavor development and carbonation technologies that enhance taste and mouthfeel. The trend towards clean label and natural ingredients is influencing product development. Increasing consumer interest in flavored sodas and the popularity of nostalgic and retro beverages are further supporting market growth.
Orange Soda Competitive Landscape
The market report analyses the leading companies in the industry including Cactus Cooler, Crush, Dr. Brown's, Faygo, Jarritos, Jones, Minute Maid, Mirinda, Mountain Dew, Slice, Stewart's, Sunkist, Tango, and Others.
Orange Soda Market Dynamics
Orange Soda Market Trend: Increasing Demand for Natural and Healthier Soda Options
The most prominent trend in the Orange Soda Market is the increasing demand for natural and healthier soda options. Consumers are seeking sodas made with natural flavors, real fruit juice, and reduced sugar content, driven by the desire for refreshing beverages that align with healthier lifestyles. This trend is fueled by the growing awareness of the health risks associated with high sugar consumption and artificial additives.
Orange Soda Market Driver: Health Consciousness and Beverage Innovation
A key driver in the Orange Soda Market is health consciousness and beverage innovation. As more individuals focus on improving their diet and reducing their intake of sugary drinks, there is a rising demand for orange soda that offers a healthier alternative without compromising on taste. This demand supports the growth of the market as consumers seek innovative and better-for-you beverage options.
Orange Soda Market Opportunity: Development of Low-Calorie and Functional Sodas
One significant opportunity in the Orange Soda Market lies in the development of low-calorie and functional sodas. Companies can create new orange soda products that are fortified with vitamins, antioxidants, and other beneficial ingredients, offering consumers a refreshing and health-enhancing beverage. By highlighting the nutritional benefits and appealing flavors, manufacturers can attract a broader consumer base and drive market growth.
Orange Soda Market Share Analysis- Largest Segment by Type
The Above 0 Kcal Type segment is the largest in the Orange Soda Market. This segment's dominance can be attributed to the enduring consumer preference for traditional, full-calorie sodas that offer rich flavor and a satisfying drinking experience. Despite the rising trend of health-conscious consumption, full-calorie orange sodas continue to be popular for their taste and enjoyment factor. The extensive market presence of well-established brands producing calorie-containing orange sodas supports this segment's leading position.
Orange Soda Market Share Analysis- Fastest Growing Segment by Application
The Online Sales segment is poised to grow the fastest in the Orange Soda Market over the next five years. This anticipated growth is driven by the increasing adoption of e-commerce for grocery shopping and the convenience of online ordering. Consumers are increasingly purchasing beverages online for the ease of home delivery and the ability to access a broader range of products. The rise of direct-to-consumer brands and subscription models further fuels this trend. As online shopping continues to gain traction, the orange soda market's online sales segment is expected to expand rapidly.
Orange Soda Market Segmentation
By Type
0 Kcal Type
Above 0 Kcal Type
By Application
Supermarkets/Hypermarkets
Convenience Stores
Independent Retailers
Online Sales
Others
Countries Analyzed
North America (US, Canada, Mexico)
Europe (Germany, UK, France, Spain, Italy, Russia, Rest of Europe)
Asia Pacific (China, India, Japan, South Korea, Australia, South East Asia, Rest of Asia)
South America (Brazil, Argentina, Rest of South America)
Middle East and Africa (Saudi Arabia, UAE, Rest of Middle East, South Africa, Egypt, Rest of Africa)
Orange Soda Companies Profiled in the Study
Cactus Cooler
Crush
Dr. Brown's
Faygo
Jarritos
Jones
Minute Maid
Mirinda
Mountain Dew
Slice
Stewart's
Sunkist
Tango
*- List Not Exhaustive
Chapter 1. TABLE OF CONTENTS
Chapter 2. Introduction to Orange Soda Market
2.1. Market Overview
2.2. Key Statistics and Report Highlights
2.3. Scope of the Comprehensive Study
2.3.1. Market Definition
2.3.2 Countries and Regions Covered
2.3.3 Research Objective
2.3.4 Units, Currency, and Conversions
2.3.5 Industry Value Chain
2.4. Key Market Segments
2.5. Key Companies
2.6. Study Period
Chapter 3. Strategic Analysis Review
3.1. Orange Soda Pricing Analysis and Forecast
3.2. Porter’s Five Forces
3.3. Market Ecosystem
3.4. SWOT Analysis
3.5. Regulatory Scenario
3.3. Effects of Inflation, Russia-Ukraine War, moderating economic growth, and other macroeconomic factors
Chapter 4. Competitive Landscape
4.1. Market Share Analysis
4.1.1. Global Orange Soda Market Share by Company, 2023
4.1.2. Product Offerings of Leading Orange Soda Companies
4.2. Market Entropy
4.2.1. New Product Launches in the Industry
4.2.2. Mergers, Acquisitions, Joint ventures, and Partnerships
4.3. Key Strategies and Best Practices
Chapter 5. Global Market Projections: Best, Reference, and Low Case Scenarios
5.1. Growth Analysis- Case Scenario Definitions
5.2. Low Growth Case Scenario Forecasts
5.3. Reference Growth Case Scenario Forecasts
5.4. High Growth Case Scenario Forecasts
Chapter 6. Market Dynamics
6.1. Orange Soda Market Drivers
6.2. Orange Soda Market Challenges
6.6. Orange Soda Market Opportunities
6.4. Orange Soda Market Trends
Chapter 7. Global Orange Soda Market Outlook Trends
7.1. Global Orange Soda Revenue (USD Million) and CAGR (%) by Type (2021-2032)
7.2. Global Orange Soda Revenue (USD Million) and CAGR (%) by Application (2021-2032)
7.3. Global Orange Soda Revenue (USD Million) and CAGR (%) by Product (2021-2032)
By Type
0 Kcal Type
Above 0 Kcal Type
By Application
Supermarkets/Hypermarkets
Convenience Stores
Independent Retailers
Online Sales
Others
Chapter 8. Global Orange Soda Regional Analysis and Outlook
8.1. Global Orange Soda Revenue (USD Million) By Regions (2021- 2032)
8.2. North America Orange Soda Revenue (USD Million) by Country (2021-2032)
8.2.1. United States Orange Soda Regional Analysis and Outlook
8.2.2. Canada Orange Soda Regional Analysis and Outlook
8.2.3. Mexico Orange Soda Regional Analysis and Outlook
8.3. Europe Orange Soda Revenue (USD Million), by Country (2021-2032)
8.3.1. Germany Orange Soda Regional Analysis and Outlook
8.3.2. France Orange Soda Regional Analysis and Outlook
8.3.3. United Kingdom Orange Soda Regional Analysis and Outlook
8.3.4. Spain Orange Soda Regional Analysis and Outlook
8.3.5. Italy Orange Soda Regional Analysis and Outlook
8.3.6. Russia Orange Soda Regional Analysis and Outlook
8.3.7. Rest of Europe Orange Soda Regional Analysis and Outlook
8.4. Asia Pacific Orange Soda Revenue (USD Million) by Country (2021-2032)
8.4.1. China Orange Soda Regional Analysis and Outlook
8.4.2. Japan Orange Soda Regional Analysis and Outlook
8.4.3. India Orange Soda Regional Analysis and Outlook
8.4.4. South Korea Orange Soda Regional Analysis and Outlook
8.4.5. Australia Orange Soda Regional Analysis and Outlook
8.4.6. South East Asia Orange Soda Regional Analysis and Outlook
8.4.7. Rest of Asia Pacific Orange Soda Regional Analysis and Outlook
8.5. South America Orange Soda Revenue (USD Million), by Country (2021-2032)
8.5.1. Brazil Orange Soda Regional Analysis and Outlook
8.5.2. Argentina Orange Soda Regional Analysis and Outlook
8.5.3. Rest of South America Orange Soda Regional Analysis and Outlook
8.6. Middle East and Africa Orange Soda Revenue (USD Million) by Country (2021-2032)
8.6.1. Middle East Orange Soda Regional Analysis and Outlook
8.6.2. Africa Orange Soda Regional Analysis and Outlook
Chapter 9. North America Orange Soda Analysis and Outlook
9.1. North America Orange Soda Revenue (USD Million) by Segments (2021-2032)
9.1.1. North America Orange Soda Revenue (USD Million) by Type (2021-2032)
9.1.2. North America Orange Soda Revenue (USD Million) by Application (2021-2032)
9.1.3. North America Orange Soda Revenue (USD Million) by Product (2021-2032)
By Type
0 Kcal Type
Above 0 Kcal Type
By Application
Supermarkets/Hypermarkets
Convenience Stores
Independent Retailers
Online Sales
Others
Chapter 10. Europe Orange Soda Analysis and Outlook
10.1. Europe Orange Soda Revenue (USD Million), by Segments (USD Million) (2021-2032)
10.1.1. Europe Orange Soda Revenue (USD Million) by Type (2021-2032)
10.1.2. Europe Orange Soda Revenue (USD Million) by Application (2021-2032)
10.1.3. Europe Orange Soda Revenue (USD Million) by Product (2021-2032)
By Type
0 Kcal Type
Above 0 Kcal Type
By Application
Supermarkets/Hypermarkets
Convenience Stores
Independent Retailers
Online Sales
Others
Chapter 11. Asia Pacific Orange Soda Analysis and Outlook
11.1. Asia Pacific Orange Soda Revenue (USD Million), and Revenue (USD Million) by Segments (2021-2032)
11.1.1. Asia Pacific Orange Soda Revenue (USD Million) by Type (2021-2032)
11.1.2. Asia Pacific Orange Soda Revenue (USD Million) by Application (2021-2032)
11.1.3. Asia Pacific Orange Soda Revenue (USD Million) by Product (2021-2032)
By Type
0 Kcal Type
Above 0 Kcal Type
By Application
Supermarkets/Hypermarkets
Convenience Stores
Independent Retailers
Online Sales
Others
Chapter 12. South America Orange Soda Analysis and Outlook
12.1. South America Orange Soda Revenue (USD Million), by Segments (2021-2032)
12.1.1. South America Orange Soda Revenue (USD Million) by Type (2021-2032)
12.1.2. South America Orange Soda Revenue (USD Million) by Application (2021-2032)
12.1.3. South America Orange Soda Revenue (USD Million) by Product (2021-2032)
By Type
0 Kcal Type
Above 0 Kcal Type
By Application
Supermarkets/Hypermarkets
Convenience Stores
Independent Retailers
Online Sales
Others
Chapter 13. Middle East and Africa Orange Soda Analysis and Outlook
13.1. Middle East and Africa Orange Soda Revenue (USD Million), by Segments (2021-2032)
13.1.1. Middle East and Africa Orange Soda Revenue (USD Million) by Type (2021-2032)
13.1.2. Middle East and Africa Orange Soda Revenue (USD Million) by Application (2021-2032)
13.1.3. Middle East and Africa Orange Soda Revenue (USD Million) by Product (2021-2032)
By Type
0 Kcal Type
Above 0 Kcal Type
By Application
Supermarkets/Hypermarkets
Convenience Stores
Independent Retailers
Online Sales
Others
Chapter 14. Orange Soda Company Profiles
14.1 Business Overview
14.2 Product Profiles
14.3 SWOT Profiles
14.5 Recent Developments
14.6 Financial Profile
List of Companies
Cactus Cooler
Crush
Dr. Brown's
Faygo
Jarritos
Jones
Minute Maid
Mirinda
Mountain Dew
Slice
Stewart's
Sunkist
Tango
15. Methodology and Data Sources
15.1 Customization Offerings
15.2 Subscription Services
15.3 Related Reports
15.4 Publisher Expertise
LIST OF TABLES
Table 1 Market Segmentation Analysis
Table 2 Global Orange Soda Market Share of Leading Companies, 2023
Table 3 Product Offerings of Leading Companies
Table 4 Low Growth Scenario Forecasts
Table 5 Reference Case Growth Scenario
Table 6 High Growth Case Scenario
Table 7 Global Orange Soda Revenue (USD Million) And CAGR (%) By Type (2021-2032)
Table 8 Global Orange Soda Revenue (USD Million) And CAGR (%) By Application (2021-2032)
Table 9 Global Orange Soda Revenue (USD Million) And CAGR (%) By Product (2021-2032)
Table 10 Global Orange Soda Market Revenue (USD Million) By Regions (2021-2032)
Table 11 Global Orange Soda Market Share (%) By Regions (2021-2032)
Table 12 North America Orange Soda Revenue (USD Million) By Country (2021-2032)
Table 13 Europe Orange Soda Revenue (USD Million) By Country (2021-2032)
Table 14 Asia Pacific Orange Soda Revenue (USD Million) By Country (2021-2032)
Table 15 South America Orange Soda Revenue (USD Million) By Country (2021-2032)
Table 16 Middle East and Africa Orange Soda Revenue (USD Million) By Region (2021-2032)
Table 17 North America Orange Soda Revenue (USD Million) By Type (2021-2032)
Table 18 North America Orange Soda Revenue (USD Million) By Application (2021-2032)
Table 19 North America Orange Soda Revenue (USD Million) By Product (2021-2032)
Table 20 Europe Orange Soda Revenue (USD Million) By Type (2021-2032)
Table 21 Europe Orange Soda Revenue (USD Million) By Application (2021-2032)
Table 22 Europe Orange Soda Revenue (USD Million) By Product (2021-2032)
Table 23 Asia Pacific Orange Soda Revenue (USD Million) By Type (2021-2032)
Table 24 Asia Pacific Orange Soda Revenue (USD Million) By Application (2021-2032)
Table 25 Asia Pacific Orange Soda Revenue (USD Million) By Product (2021-2032)
Table 26 South America Orange Soda Revenue (USD Million) By Type (2021-2032)
Table 27 South America Orange Soda Revenue (USD Million) By Application (2021-2032)
Table 28 South America Orange Soda Revenue (USD Million) By Product (2021-2032)
Table 29 Middle East and Africa Orange Soda Revenue (USD Million) By Type (2021-2032)
Table 30 Middle East and Africa Orange Soda Revenue (USD Million) By Application (2021-2032)
Table 31 Middle East and Africa Orange Soda Revenue (USD Million) By Product (2021-2032)
LIST OF FIGURES
Figure 1. Market Scope
Figure 2. Pricing Forecasts Per Unit, 2023- 2032
Figure 3. Porter’s Five Forces
Figure 4. Global Orange Soda Market Revenue (USD Million) By Regions (2021-2032)
Figure 5. Global Orange Soda Market Share (%) By Regions (2023)
Figure 6. North America Orange Soda Revenue (USD Million) By Country (2021-2032)
Figure 7. United States Orange Soda Revenue (USD Million) By Country (2021-2032)
Figure 8. Canada Orange Soda Revenue (USD Million) By Country (2021-2032)
Figure 9. Mexico Orange Soda Revenue (USD Million) By Country (2021-2032)
Figure 10. Europe Orange Soda Revenue (USD Million) By Country (2021-2032)
Figure 11. Germany Orange Soda Revenue (USD Million) By Country (2021-2032)
Figure 12. France Orange Soda Revenue (USD Million) By Country (2021-2032)
Figure 13. United Kingdom Orange Soda Revenue (USD Million) By Country (2021-2032)
Figure 14. Spain Orange Soda Revenue (USD Million) By Country (2021-2032)
Figure 15. Italy Orange Soda Revenue (USD Million) By Country (2021-2032)
Figure 16. Russia Orange Soda Revenue (USD Million) By Country (2021-2032)
Figure 17. Rest of Europe Orange Soda Revenue (USD Million) By Country (2021-2032)
Figure 11. Asia Pacific Orange Soda Revenue (USD Million) By Country (2021-2032)
Figure 12. China Orange Soda Revenue (USD Million) By Country (2021-2032)
Figure 13. Japan Orange Soda Revenue (USD Million) By Country (2021-2032)
Figure 14. India Orange Soda Revenue (USD Million) By Country (2021-2032)
Figure 15. South Korea Orange Soda Revenue (USD Million) By Country (2021-2032)
Figure 16. Australia Orange Soda Revenue (USD Million) By Country (2021-2032)
Figure 17. South East Asia Orange Soda Revenue (USD Million) By Country (2021-2032)
Figure 18. South America Orange Soda Revenue (USD Million) By Country (2021-2032)
Figure 19. Brazil Orange Soda Revenue (USD Million) By Country (2021-2032)
Figure 20. Argentina Orange Soda Revenue (USD Million) By Country (2021-2032)
Figure 21. Rest of Asia Pacific Orange Soda Revenue (USD Million) By Country (2021-2032)
Figure 22. Middle East and Africa Orange Soda Revenue (USD Million) By Region (2021-2032)
Figure 23. Saudi Arabia Orange Soda Revenue (USD Million) By Region (2021-2032)
Figure 24. The UAE Orange Soda Revenue (USD Million) By Region (2021-2032)
Figure 25. Rest of Middle East Orange Soda Revenue (USD Million) By Region (2021-2032)
Figure 26. South Africa Orange Soda Revenue (USD Million) By Region (2021-2032)
Figure 27. Africa Orange Soda Revenue (USD Million) By Region (2021-2032)
Figure 28. North America Orange Soda Revenue (USD Million) By Type (2021-2032)
Figure 29. North America Orange Soda Revenue (USD Million) By Application (2021-2032)
Figure 30. North America Orange Soda Revenue (USD Million) By Product (2021-2032)
Figure 31. Europe Orange Soda Revenue (USD Million) By Type (2021-2032)
Figure 32. Europe Orange Soda Revenue (USD Million) By Application (2021-2032)
Figure 33. Europe Orange Soda Revenue (USD Million) By Product (2021-2032)
Figure 34. Asia Pacific Orange Soda Revenue (USD Million) By Type (2021-2032)
Figure 35. Asia Pacific Orange Soda Revenue (USD Million) By Application (2021-2032)
Figure 36. Asia Pacific Orange Soda Revenue (USD Million) By Product (2021-2032)
Figure 37. South America Orange Soda Revenue (USD Million) By Type (2021-2032)
Figure 38. South America Orange Soda Revenue (USD Million) By Application (2021-2032)
Figure 39. South America Orange Soda Revenue (USD Million) By Product (2021-2032)
Figure 40. Middle East and Africa Orange Soda Revenue (USD Million) By Type (2021-2032)
Figure 41. Middle East and Africa Orange Soda Revenue (USD Million) By Application (2021-2032)
Figure 42. Middle East and Africa Orange Soda Revenue (USD Million) By Product (2021-2032)
By Type
0 Kcal Type
Above 0 Kcal Type
By Application
Supermarkets/Hypermarkets
Convenience Stores
Independent Retailers
Online Sales
Others
Countries Analyzed
North America (US, Canada, Mexico)
Europe (Germany, UK, France, Spain, Italy, Russia, Rest of Europe)
Asia Pacific (China, India, Japan, South Korea, Australia, South East Asia, Rest of Asia)
South America (Brazil, Argentina, Rest of South America)
Middle East and Africa (Saudi Arabia, UAE, Rest of Middle East, South Africa, Egypt, Rest of Africa)
