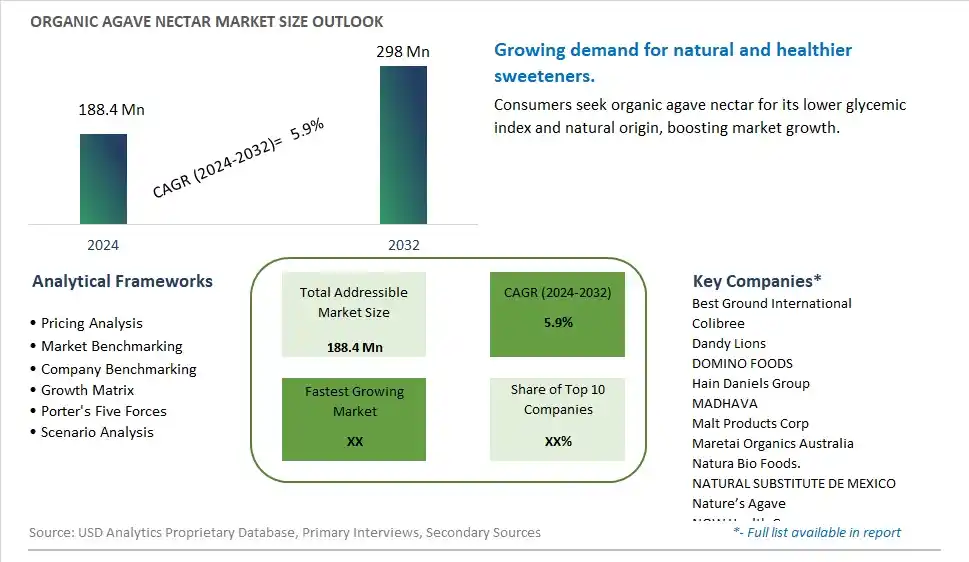
Global Organic Agave Nectar Market Size is valued at $188.4 Million in 2024 and is forecast to register a growth rate (CAGR) of 5.9% to reach $298 Million by 2032.
The global Organic Agave Nectar Market Comprehensive Study analyzes and forecasts the market size across 6 regions and 24 countries for diverse segments -By Type (Light Agave Syrup, Dark Agave Syrup), By Application (Bakery, Beverages, Confectionery, Others)
An Introduction to Organic Agave Nectar Market
The organic agave nectar market in 2024 is expanding rapidly, driven by the demand for natural and low-glycemic sweeteners. Organic agave nectar, derived from the agave plant, offers a sweet taste with a lower impact on blood sugar levels. The market benefits from advancements in agave cultivation and nectar extraction technologies that enhance product purity and consistency. The trend towards clean label and natural ingredients is influencing product development. Increasing consumer interest in healthier sweetening options and the popularity of natural and organic foods are further propelling market growth.
Organic Agave Nectar Competitive Landscape
The market report analyses the leading companies in the industry including Best Ground International, Colibree, Dandy Lions, DOMINO FOODS, Hain Daniels Group, MADHAVA, Malt Products Corp, Maretai Organics Australia, Natura Bio Foods., NATURAL SUBSTITUTE DE MEXICO, Nature’s Agave, NOW Health Group, Sisana Sweeteners, The Agave Sweetener Company, The Groovy Food, The Simple Syrup Co, The Tierra Group, Wholesome Sweeteners, and Others.
Organic Agave Nectar Market Dynamics
Organic Agave Nectar Market Trend: Growing Popularity of Natural Sweeteners
The most prominent trend in the Organic Agave Nectar Market is the growing popularity of natural sweeteners. Organic agave nectar is becoming a preferred alternative to traditional sugar and artificial sweeteners, driven by the desire for natural and minimally processed sweetening options. This trend is fueled by the increasing awareness of the health risks associated with high sugar consumption and artificial additives.
Organic Agave Nectar Market Driver: Health Consciousness and Demand for Low Glycemic Index Sweeteners
A key driver in the Organic Agave Nectar Market is health consciousness and the demand for low glycemic index sweeteners. As more individuals focus on managing their blood sugar levels and reducing their intake of refined sugars, there is a rising demand for organic agave nectar that offers a natural and healthier alternative. This demand supports the growth of the market as consumers seek sweeteners that align with their health goals.
Organic Agave Nectar Market Opportunity: Innovation in Food and Beverage Applications
One significant opportunity in the Organic Agave Nectar Market lies in innovation in food and beverage applications. Companies can develop new products that incorporate organic agave nectar into various formulations, such as beverages, baked goods, and sauces, offering consumers natural and health-focused sweetening options. By highlighting the versatility and benefits of organic agave nectar, manufacturers can attract a broader consumer base and drive market growth.
Organic Agave Nectar Market Share Analysis- Largest Segment by Type
The Light Agave Syrup segment is the largest in the Organic Agave Nectar Market. This is due to light agave syrup's milder flavor and versatility, which make it a preferred choice for a wide range of applications, from sweetening beverages to baking. Its lighter color and taste allow it to blend seamlessly into various recipes without altering the final product's appearance or flavor profile significantly. This adaptability and consumer preference for lighter, less intense flavors contribute to its leading market position.
Organic Agave Nectar Market Share Analysis- Fastest Growing Segment by Application
The Beverages segment is poised to grow fastest in the Organic Agave Nectar Market over the next five years. This growth is driven by the increasing consumer demand for natural and organic ingredients in beverages, including smoothies, energy drinks, and flavored waters. Organic agave nectar is valued for its low glycemic index and natural sweetness, making it an attractive alternative to refined sugars and artificial sweeteners. As consumers become more health-conscious and seek clean label products, the application of organic agave nectar in beverages is expected to expand significantly.
Organic Agave Nectar Market Segmentation
By Type
Light Agave Syrup
Dark Agave Syrup
By Application
Bakery
Beverages
Confectionery
Others
Countries Analyzed
North America (US, Canada, Mexico)
Europe (Germany, UK, France, Spain, Italy, Russia, Rest of Europe)
Asia Pacific (China, India, Japan, South Korea, Australia, South East Asia, Rest of Asia)
South America (Brazil, Argentina, Rest of South America)
Middle East and Africa (Saudi Arabia, UAE, Rest of Middle East, South Africa, Egypt, Rest of Africa)
Organic Agave Nectar Companies Profiled in the Study
Best Ground International
Colibree
Dandy Lions
DOMINO FOODS
Hain Daniels Group
MADHAVA
Malt Products Corp
Maretai Organics Australia
Natura Bio Foods.
NATURAL SUBSTITUTE DE MEXICO
Nature’s Agave
NOW Health Group
Sisana Sweeteners
The Agave Sweetener Company
The Groovy Food
The Simple Syrup Co
The Tierra Group
Wholesome Sweeteners
*- List Not Exhaustive
Chapter 1. TABLE OF CONTENTS
Chapter 2. Introduction to Organic Agave Nectar Market
2.1. Market Overview
2.2. Key Statistics and Report Highlights
2.3. Scope of the Comprehensive Study
2.3.1. Market Definition
2.3.2 Countries and Regions Covered
2.3.3 Research Objective
2.3.4 Units, Currency, and Conversions
2.3.5 Industry Value Chain
2.4. Key Market Segments
2.5. Key Companies
2.6. Study Period
Chapter 3. Strategic Analysis Review
3.1. Organic Agave Nectar Pricing Analysis and Forecast
3.2. Porter’s Five Forces
3.3. Market Ecosystem
3.4. SWOT Analysis
3.5. Regulatory Scenario
3.3. Effects of Inflation, Russia-Ukraine War, moderating economic growth, and other macroeconomic factors
Chapter 4. Competitive Landscape
4.1. Market Share Analysis
4.1.1. Global Organic Agave Nectar Market Share by Company, 2023
4.1.2. Product Offerings of Leading Organic Agave Nectar Companies
4.2. Market Entropy
4.2.1. New Product Launches in the Industry
4.2.2. Mergers, Acquisitions, Joint ventures, and Partnerships
4.3. Key Strategies and Best Practices
Chapter 5. Global Market Projections: Best, Reference, and Low Case Scenarios
5.1. Growth Analysis- Case Scenario Definitions
5.2. Low Growth Case Scenario Forecasts
5.3. Reference Growth Case Scenario Forecasts
5.4. High Growth Case Scenario Forecasts
Chapter 6. Market Dynamics
6.1. Organic Agave Nectar Market Drivers
6.2. Organic Agave Nectar Market Challenges
6.6. Organic Agave Nectar Market Opportunities
6.4. Organic Agave Nectar Market Trends
Chapter 7. Global Organic Agave Nectar Market Outlook Trends
7.1. Global Organic Agave Nectar Revenue (USD Million) and CAGR (%) by Type (2021-2032)
7.2. Global Organic Agave Nectar Revenue (USD Million) and CAGR (%) by Application (2021-2032)
7.3. Global Organic Agave Nectar Revenue (USD Million) and CAGR (%) by Product (2021-2032)
By Type
Light Agave Syrup
Dark Agave Syrup
By Application
Bakery
Beverages
Confectionery
Others
Chapter 8. Global Organic Agave Nectar Regional Analysis and Outlook
8.1. Global Organic Agave Nectar Revenue (USD Million) By Regions (2021- 2032)
8.2. North America Organic Agave Nectar Revenue (USD Million) by Country (2021-2032)
8.2.1. United States Organic Agave Nectar Regional Analysis and Outlook
8.2.2. Canada Organic Agave Nectar Regional Analysis and Outlook
8.2.3. Mexico Organic Agave Nectar Regional Analysis and Outlook
8.3. Europe Organic Agave Nectar Revenue (USD Million), by Country (2021-2032)
8.3.1. Germany Organic Agave Nectar Regional Analysis and Outlook
8.3.2. France Organic Agave Nectar Regional Analysis and Outlook
8.3.3. United Kingdom Organic Agave Nectar Regional Analysis and Outlook
8.3.4. Spain Organic Agave Nectar Regional Analysis and Outlook
8.3.5. Italy Organic Agave Nectar Regional Analysis and Outlook
8.3.6. Russia Organic Agave Nectar Regional Analysis and Outlook
8.3.7. Rest of Europe Organic Agave Nectar Regional Analysis and Outlook
8.4. Asia Pacific Organic Agave Nectar Revenue (USD Million) by Country (2021-2032)
8.4.1. China Organic Agave Nectar Regional Analysis and Outlook
8.4.2. Japan Organic Agave Nectar Regional Analysis and Outlook
8.4.3. India Organic Agave Nectar Regional Analysis and Outlook
8.4.4. South Korea Organic Agave Nectar Regional Analysis and Outlook
8.4.5. Australia Organic Agave Nectar Regional Analysis and Outlook
8.4.6. South East Asia Organic Agave Nectar Regional Analysis and Outlook
8.4.7. Rest of Asia Pacific Organic Agave Nectar Regional Analysis and Outlook
8.5. South America Organic Agave Nectar Revenue (USD Million), by Country (2021-2032)
8.5.1. Brazil Organic Agave Nectar Regional Analysis and Outlook
8.5.2. Argentina Organic Agave Nectar Regional Analysis and Outlook
8.5.3. Rest of South America Organic Agave Nectar Regional Analysis and Outlook
8.6. Middle East and Africa Organic Agave Nectar Revenue (USD Million) by Country (2021-2032)
8.6.1. Middle East Organic Agave Nectar Regional Analysis and Outlook
8.6.2. Africa Organic Agave Nectar Regional Analysis and Outlook
Chapter 9. North America Organic Agave Nectar Analysis and Outlook
9.1. North America Organic Agave Nectar Revenue (USD Million) by Segments (2021-2032)
9.1.1. North America Organic Agave Nectar Revenue (USD Million) by Type (2021-2032)
9.1.2. North America Organic Agave Nectar Revenue (USD Million) by Application (2021-2032)
9.1.3. North America Organic Agave Nectar Revenue (USD Million) by Product (2021-2032)
By Type
Light Agave Syrup
Dark Agave Syrup
By Application
Bakery
Beverages
Confectionery
Others
Chapter 10. Europe Organic Agave Nectar Analysis and Outlook
10.1. Europe Organic Agave Nectar Revenue (USD Million), by Segments (USD Million) (2021-2032)
10.1.1. Europe Organic Agave Nectar Revenue (USD Million) by Type (2021-2032)
10.1.2. Europe Organic Agave Nectar Revenue (USD Million) by Application (2021-2032)
10.1.3. Europe Organic Agave Nectar Revenue (USD Million) by Product (2021-2032)
By Type
Light Agave Syrup
Dark Agave Syrup
By Application
Bakery
Beverages
Confectionery
Others
Chapter 11. Asia Pacific Organic Agave Nectar Analysis and Outlook
11.1. Asia Pacific Organic Agave Nectar Revenue (USD Million), and Revenue (USD Million) by Segments (2021-2032)
11.1.1. Asia Pacific Organic Agave Nectar Revenue (USD Million) by Type (2021-2032)
11.1.2. Asia Pacific Organic Agave Nectar Revenue (USD Million) by Application (2021-2032)
11.1.3. Asia Pacific Organic Agave Nectar Revenue (USD Million) by Product (2021-2032)
By Type
Light Agave Syrup
Dark Agave Syrup
By Application
Bakery
Beverages
Confectionery
Others
Chapter 12. South America Organic Agave Nectar Analysis and Outlook
12.1. South America Organic Agave Nectar Revenue (USD Million), by Segments (2021-2032)
12.1.1. South America Organic Agave Nectar Revenue (USD Million) by Type (2021-2032)
12.1.2. South America Organic Agave Nectar Revenue (USD Million) by Application (2021-2032)
12.1.3. South America Organic Agave Nectar Revenue (USD Million) by Product (2021-2032)
By Type
Light Agave Syrup
Dark Agave Syrup
By Application
Bakery
Beverages
Confectionery
Others
Chapter 13. Middle East and Africa Organic Agave Nectar Analysis and Outlook
13.1. Middle East and Africa Organic Agave Nectar Revenue (USD Million), by Segments (2021-2032)
13.1.1. Middle East and Africa Organic Agave Nectar Revenue (USD Million) by Type (2021-2032)
13.1.2. Middle East and Africa Organic Agave Nectar Revenue (USD Million) by Application (2021-2032)
13.1.3. Middle East and Africa Organic Agave Nectar Revenue (USD Million) by Product (2021-2032)
By Type
Light Agave Syrup
Dark Agave Syrup
By Application
Bakery
Beverages
Confectionery
Others
Chapter 14. Organic Agave Nectar Company Profiles
14.1 Business Overview
14.2 Product Profiles
14.3 SWOT Profiles
14.5 Recent Developments
14.6 Financial Profile
List of Companies
Best Ground International
Colibree
Dandy Lions
DOMINO FOODS
Hain Daniels Group
MADHAVA
Malt Products Corp
Maretai Organics Australia
Natura Bio Foods.
NATURAL SUBSTITUTE DE MEXICO
Nature’s Agave
NOW Health Group
Sisana Sweeteners
The Agave Sweetener Company
The Groovy Food
The Simple Syrup Co
The Tierra Group
Wholesome Sweeteners
15. Methodology and Data Sources
15.1 Customization Offerings
15.2 Subscription Services
15.3 Related Reports
15.4 Publisher Expertise
LIST OF TABLES
Table 1 Market Segmentation Analysis
Table 2 Global Organic Agave Nectar Market Share of Leading Companies, 2023
Table 3 Product Offerings of Leading Companies
Table 4 Low Growth Scenario Forecasts
Table 5 Reference Case Growth Scenario
Table 6 High Growth Case Scenario
Table 7 Global Organic Agave Nectar Revenue (USD Million) And CAGR (%) By Type (2021-2032)
Table 8 Global Organic Agave Nectar Revenue (USD Million) And CAGR (%) By Application (2021-2032)
Table 9 Global Organic Agave Nectar Revenue (USD Million) And CAGR (%) By Product (2021-2032)
Table 10 Global Organic Agave Nectar Market Revenue (USD Million) By Regions (2021-2032)
Table 11 Global Organic Agave Nectar Market Share (%) By Regions (2021-2032)
Table 12 North America Organic Agave Nectar Revenue (USD Million) By Country (2021-2032)
Table 13 Europe Organic Agave Nectar Revenue (USD Million) By Country (2021-2032)
Table 14 Asia Pacific Organic Agave Nectar Revenue (USD Million) By Country (2021-2032)
Table 15 South America Organic Agave Nectar Revenue (USD Million) By Country (2021-2032)
Table 16 Middle East and Africa Organic Agave Nectar Revenue (USD Million) By Region (2021-2032)
Table 17 North America Organic Agave Nectar Revenue (USD Million) By Type (2021-2032)
Table 18 North America Organic Agave Nectar Revenue (USD Million) By Application (2021-2032)
Table 19 North America Organic Agave Nectar Revenue (USD Million) By Product (2021-2032)
Table 20 Europe Organic Agave Nectar Revenue (USD Million) By Type (2021-2032)
Table 21 Europe Organic Agave Nectar Revenue (USD Million) By Application (2021-2032)
Table 22 Europe Organic Agave Nectar Revenue (USD Million) By Product (2021-2032)
Table 23 Asia Pacific Organic Agave Nectar Revenue (USD Million) By Type (2021-2032)
Table 24 Asia Pacific Organic Agave Nectar Revenue (USD Million) By Application (2021-2032)
Table 25 Asia Pacific Organic Agave Nectar Revenue (USD Million) By Product (2021-2032)
Table 26 South America Organic Agave Nectar Revenue (USD Million) By Type (2021-2032)
Table 27 South America Organic Agave Nectar Revenue (USD Million) By Application (2021-2032)
Table 28 South America Organic Agave Nectar Revenue (USD Million) By Product (2021-2032)
Table 29 Middle East and Africa Organic Agave Nectar Revenue (USD Million) By Type (2021-2032)
Table 30 Middle East and Africa Organic Agave Nectar Revenue (USD Million) By Application (2021-2032)
Table 31 Middle East and Africa Organic Agave Nectar Revenue (USD Million) By Product (2021-2032)
LIST OF FIGURES
Figure 1. Market Scope
Figure 2. Pricing Forecasts Per Unit, 2023- 2032
Figure 3. Porter’s Five Forces
Figure 4. Global Organic Agave Nectar Market Revenue (USD Million) By Regions (2021-2032)
Figure 5. Global Organic Agave Nectar Market Share (%) By Regions (2023)
Figure 6. North America Organic Agave Nectar Revenue (USD Million) By Country (2021-2032)
Figure 7. United States Organic Agave Nectar Revenue (USD Million) By Country (2021-2032)
Figure 8. Canada Organic Agave Nectar Revenue (USD Million) By Country (2021-2032)
Figure 9. Mexico Organic Agave Nectar Revenue (USD Million) By Country (2021-2032)
Figure 10. Europe Organic Agave Nectar Revenue (USD Million) By Country (2021-2032)
Figure 11. Germany Organic Agave Nectar Revenue (USD Million) By Country (2021-2032)
Figure 12. France Organic Agave Nectar Revenue (USD Million) By Country (2021-2032)
Figure 13. United Kingdom Organic Agave Nectar Revenue (USD Million) By Country (2021-2032)
Figure 14. Spain Organic Agave Nectar Revenue (USD Million) By Country (2021-2032)
Figure 15. Italy Organic Agave Nectar Revenue (USD Million) By Country (2021-2032)
Figure 16. Russia Organic Agave Nectar Revenue (USD Million) By Country (2021-2032)
Figure 17. Rest of Europe Organic Agave Nectar Revenue (USD Million) By Country (2021-2032)
Figure 11. Asia Pacific Organic Agave Nectar Revenue (USD Million) By Country (2021-2032)
Figure 12. China Organic Agave Nectar Revenue (USD Million) By Country (2021-2032)
Figure 13. Japan Organic Agave Nectar Revenue (USD Million) By Country (2021-2032)
Figure 14. India Organic Agave Nectar Revenue (USD Million) By Country (2021-2032)
Figure 15. South Korea Organic Agave Nectar Revenue (USD Million) By Country (2021-2032)
Figure 16. Australia Organic Agave Nectar Revenue (USD Million) By Country (2021-2032)
Figure 17. South East Asia Organic Agave Nectar Revenue (USD Million) By Country (2021-2032)
Figure 18. South America Organic Agave Nectar Revenue (USD Million) By Country (2021-2032)
Figure 19. Brazil Organic Agave Nectar Revenue (USD Million) By Country (2021-2032)
Figure 20. Argentina Organic Agave Nectar Revenue (USD Million) By Country (2021-2032)
Figure 21. Rest of Asia Pacific Organic Agave Nectar Revenue (USD Million) By Country (2021-2032)
Figure 22. Middle East and Africa Organic Agave Nectar Revenue (USD Million) By Region (2021-2032)
Figure 23. Saudi Arabia Organic Agave Nectar Revenue (USD Million) By Region (2021-2032)
Figure 24. The UAE Organic Agave Nectar Revenue (USD Million) By Region (2021-2032)
Figure 25. Rest of Middle East Organic Agave Nectar Revenue (USD Million) By Region (2021-2032)
Figure 26. South Africa Organic Agave Nectar Revenue (USD Million) By Region (2021-2032)
Figure 27. Africa Organic Agave Nectar Revenue (USD Million) By Region (2021-2032)
Figure 28. North America Organic Agave Nectar Revenue (USD Million) By Type (2021-2032)
Figure 29. North America Organic Agave Nectar Revenue (USD Million) By Application (2021-2032)
Figure 30. North America Organic Agave Nectar Revenue (USD Million) By Product (2021-2032)
Figure 31. Europe Organic Agave Nectar Revenue (USD Million) By Type (2021-2032)
Figure 32. Europe Organic Agave Nectar Revenue (USD Million) By Application (2021-2032)
Figure 33. Europe Organic Agave Nectar Revenue (USD Million) By Product (2021-2032)
Figure 34. Asia Pacific Organic Agave Nectar Revenue (USD Million) By Type (2021-2032)
Figure 35. Asia Pacific Organic Agave Nectar Revenue (USD Million) By Application (2021-2032)
Figure 36. Asia Pacific Organic Agave Nectar Revenue (USD Million) By Product (2021-2032)
Figure 37. South America Organic Agave Nectar Revenue (USD Million) By Type (2021-2032)
Figure 38. South America Organic Agave Nectar Revenue (USD Million) By Application (2021-2032)
Figure 39. South America Organic Agave Nectar Revenue (USD Million) By Product (2021-2032)
Figure 40. Middle East and Africa Organic Agave Nectar Revenue (USD Million) By Type (2021-2032)
Figure 41. Middle East and Africa Organic Agave Nectar Revenue (USD Million) By Application (2021-2032)
Figure 42. Middle East and Africa Organic Agave Nectar Revenue (USD Million) By Product (2021-2032)
By Type
Light Agave Syrup
Dark Agave Syrup
By Application
Bakery
Beverages
Confectionery
Others
Countries Analyzed
North America (US, Canada, Mexico)
Europe (Germany, UK, France, Spain, Italy, Russia, Rest of Europe)
Asia Pacific (China, India, Japan, South Korea, Australia, South East Asia, Rest of Asia)
South America (Brazil, Argentina, Rest of South America)
Middle East and Africa (Saudi Arabia, UAE, Rest of Middle East, South Africa, Egypt, Rest of Africa)
