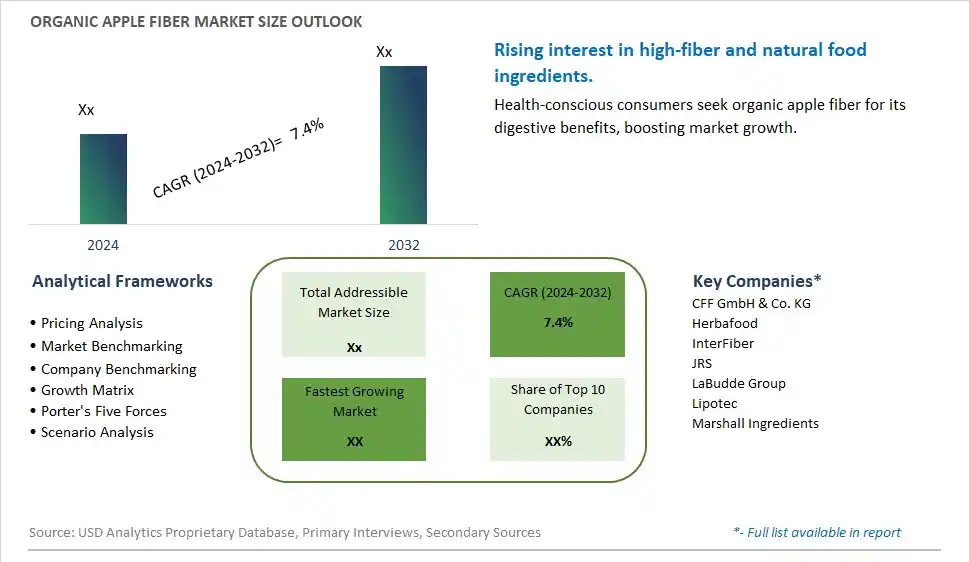
Global Organic Apple Fiber Market Size is valued at $XX Million in 2024 and is forecast to register a growth rate (CAGR) of 7.4% to reach $XX Million by 2032.
The global Organic Apple Fiber Market Comprehensive Study analyzes and forecasts the market size across 6 regions and 24 countries for diverse segments -By Type (Dietary Fiber<50%, Dietary Fiber≥50%), By Application (Bakery Products, Meat Products, Beverage Products, Desserts Products, Others)
An Introduction to Organic Apple Fiber Market
The organic apple fiber market in 2024 is expanding rapidly, driven by the demand for natural dietary fibers that support digestive health. Organic apple fiber, derived from organic apples, offers a rich source of soluble and insoluble fibers. The market benefits from innovations in fiber extraction and formulation technologies that enhance product quality and functionality. The trend towards clean label and natural ingredients is influencing product development. Increasing consumer awareness of the health benefits of dietary fiber and the popularity of functional foods are further propelling market growth.
Organic Apple Fiber Competitive Landscape
The market report analyses the leading companies in the industry including CFF GmbH & Co. KG, Herbafood, InterFiber, JRS, LaBudde Group, Lipotec, Marshall Ingredients, and Others.
Organic Apple Fiber Market Dynamics
Organic Apple Fiber Market Trend: Increasing Demand for Functional and Fiber-Rich Ingredients
The most prominent trend in the Organic Apple Fiber Market is the increasing demand for functional and fiber-rich ingredients. Organic apple fiber is gaining popularity as a natural source of dietary fiber, driven by the desire for ingredients that enhance digestive health and support overall wellness. This trend is fueled by the growing recognition of fiber's role in maintaining a healthy diet and preventing chronic diseases.
Organic Apple Fiber Market Driver: Health Consciousness and Clean Label Products
A key driver in the Organic Apple Fiber Market is health consciousness and the demand for clean label products. As more individuals focus on improving their digestive health and avoiding synthetic additives, there is a rising demand for organic apple fiber that provides a natural and effective source of dietary fiber. This demand supports the growth of the market as consumers seek out natural and minimally processed food ingredients.
Organic Apple Fiber Market Opportunity: Innovation in Food and Beverage Applications
One significant opportunity in the Organic Apple Fiber Market lies in innovation in food and beverage applications. Companies can develop new products that incorporate organic apple fiber into various formulations, such as smoothies, baked goods, and dietary supplements, offering consumers convenient and health-focused options. By highlighting the benefits and versatility of organic apple fiber, manufacturers can attract a broader consumer base and drive market growth.
Organic Apple Fiber Market Share Analysis- Largest Segment by Type
The Dietary Fiber≥50% segment is the largest in the Organic Apple Fiber Market. This segment's dominance is due to the high fiber content's benefits for digestive health and its suitability for use in a variety of food products. Higher fiber concentrations are preferred for their enhanced health benefits and functionality in bakery products, meat substitutes, and dietary supplements. The demand for high-fiber ingredients in health-conscious and functional foods supports the leading position of this segment.
Organic Apple Fiber Market Share Analysis- Fastest Growing Segment by Application
The Bakery Products segment is poised to grow fastest in the Organic Apple Fiber Market over the next five years. This growth is driven by the increasing demand for high-fiber, healthier alternatives in baked goods. Organic apple fiber is valued for its ability to improve the texture and nutritional profile of bakery items while adding dietary fiber. As consumers seek to enhance the health benefits of their diets through baked goods, the application of organic apple fiber in this segment is expected to see significant expansion.
Organic Apple Fiber Market Segmentation
By Type
Dietary Fiber<50%
Dietary Fiber≥50%
By Application
Bakery Products
Meat Products
Beverage Products
Desserts Products
Others
Countries Analyzed
North America (US, Canada, Mexico)
Europe (Germany, UK, France, Spain, Italy, Russia, Rest of Europe)
Asia Pacific (China, India, Japan, South Korea, Australia, South East Asia, Rest of Asia)
South America (Brazil, Argentina, Rest of South America)
Middle East and Africa (Saudi Arabia, UAE, Rest of Middle East, South Africa, Egypt, Rest of Africa)
Organic Apple Fiber Companies Profiled in the Study
CFF GmbH & Co. KG
Herbafood
InterFiber
JRS
LaBudde Group
Lipotec
Marshall Ingredients
*- List Not Exhaustive
Chapter 1. TABLE OF CONTENTS
Chapter 2. Introduction to Organic Apple Fiber Market
2.1. Market Overview
2.2. Key Statistics and Report Highlights
2.3. Scope of the Comprehensive Study
2.3.1. Market Definition
2.3.2 Countries and Regions Covered
2.3.3 Research Objective
2.3.4 Units, Currency, and Conversions
2.3.5 Industry Value Chain
2.4. Key Market Segments
2.5. Key Companies
2.6. Study Period
Chapter 3. Strategic Analysis Review
3.1. Organic Apple Fiber Pricing Analysis and Forecast
3.2. Porter’s Five Forces
3.3. Market Ecosystem
3.4. SWOT Analysis
3.5. Regulatory Scenario
3.3. Effects of Inflation, Russia-Ukraine War, moderating economic growth, and other macroeconomic factors
Chapter 4. Competitive Landscape
4.1. Market Share Analysis
4.1.1. Global Organic Apple Fiber Market Share by Company, 2023
4.1.2. Product Offerings of Leading Organic Apple Fiber Companies
4.2. Market Entropy
4.2.1. New Product Launches in the Industry
4.2.2. Mergers, Acquisitions, Joint ventures, and Partnerships
4.3. Key Strategies and Best Practices
Chapter 5. Global Market Projections: Best, Reference, and Low Case Scenarios
5.1. Growth Analysis- Case Scenario Definitions
5.2. Low Growth Case Scenario Forecasts
5.3. Reference Growth Case Scenario Forecasts
5.4. High Growth Case Scenario Forecasts
Chapter 6. Market Dynamics
6.1. Organic Apple Fiber Market Drivers
6.2. Organic Apple Fiber Market Challenges
6.6. Organic Apple Fiber Market Opportunities
6.4. Organic Apple Fiber Market Trends
Chapter 7. Global Organic Apple Fiber Market Outlook Trends
7.1. Global Organic Apple Fiber Revenue (USD Million) and CAGR (%) by Type (2021-2032)
7.2. Global Organic Apple Fiber Revenue (USD Million) and CAGR (%) by Application (2021-2032)
7.3. Global Organic Apple Fiber Revenue (USD Million) and CAGR (%) by Product (2021-2032)
By Type
Dietary Fiber<50%
Dietary Fiber≥50%
By Application
Bakery Products
Meat Products
Beverage Products
Desserts Products
Others
Chapter 8. Global Organic Apple Fiber Regional Analysis and Outlook
8.1. Global Organic Apple Fiber Revenue (USD Million) By Regions (2021- 2032)
8.2. North America Organic Apple Fiber Revenue (USD Million) by Country (2021-2032)
8.2.1. United States Organic Apple Fiber Regional Analysis and Outlook
8.2.2. Canada Organic Apple Fiber Regional Analysis and Outlook
8.2.3. Mexico Organic Apple Fiber Regional Analysis and Outlook
8.3. Europe Organic Apple Fiber Revenue (USD Million), by Country (2021-2032)
8.3.1. Germany Organic Apple Fiber Regional Analysis and Outlook
8.3.2. France Organic Apple Fiber Regional Analysis and Outlook
8.3.3. United Kingdom Organic Apple Fiber Regional Analysis and Outlook
8.3.4. Spain Organic Apple Fiber Regional Analysis and Outlook
8.3.5. Italy Organic Apple Fiber Regional Analysis and Outlook
8.3.6. Russia Organic Apple Fiber Regional Analysis and Outlook
8.3.7. Rest of Europe Organic Apple Fiber Regional Analysis and Outlook
8.4. Asia Pacific Organic Apple Fiber Revenue (USD Million) by Country (2021-2032)
8.4.1. China Organic Apple Fiber Regional Analysis and Outlook
8.4.2. Japan Organic Apple Fiber Regional Analysis and Outlook
8.4.3. India Organic Apple Fiber Regional Analysis and Outlook
8.4.4. South Korea Organic Apple Fiber Regional Analysis and Outlook
8.4.5. Australia Organic Apple Fiber Regional Analysis and Outlook
8.4.6. South East Asia Organic Apple Fiber Regional Analysis and Outlook
8.4.7. Rest of Asia Pacific Organic Apple Fiber Regional Analysis and Outlook
8.5. South America Organic Apple Fiber Revenue (USD Million), by Country (2021-2032)
8.5.1. Brazil Organic Apple Fiber Regional Analysis and Outlook
8.5.2. Argentina Organic Apple Fiber Regional Analysis and Outlook
8.5.3. Rest of South America Organic Apple Fiber Regional Analysis and Outlook
8.6. Middle East and Africa Organic Apple Fiber Revenue (USD Million) by Country (2021-2032)
8.6.1. Middle East Organic Apple Fiber Regional Analysis and Outlook
8.6.2. Africa Organic Apple Fiber Regional Analysis and Outlook
Chapter 9. North America Organic Apple Fiber Analysis and Outlook
9.1. North America Organic Apple Fiber Revenue (USD Million) by Segments (2021-2032)
9.1.1. North America Organic Apple Fiber Revenue (USD Million) by Type (2021-2032)
9.1.2. North America Organic Apple Fiber Revenue (USD Million) by Application (2021-2032)
9.1.3. North America Organic Apple Fiber Revenue (USD Million) by Product (2021-2032)
By Type
Dietary Fiber<50%
Dietary Fiber≥50%
By Application
Bakery Products
Meat Products
Beverage Products
Desserts Products
Others
Chapter 10. Europe Organic Apple Fiber Analysis and Outlook
10.1. Europe Organic Apple Fiber Revenue (USD Million), by Segments (USD Million) (2021-2032)
10.1.1. Europe Organic Apple Fiber Revenue (USD Million) by Type (2021-2032)
10.1.2. Europe Organic Apple Fiber Revenue (USD Million) by Application (2021-2032)
10.1.3. Europe Organic Apple Fiber Revenue (USD Million) by Product (2021-2032)
By Type
Dietary Fiber<50%
Dietary Fiber≥50%
By Application
Bakery Products
Meat Products
Beverage Products
Desserts Products
Others
Chapter 11. Asia Pacific Organic Apple Fiber Analysis and Outlook
11.1. Asia Pacific Organic Apple Fiber Revenue (USD Million), and Revenue (USD Million) by Segments (2021-2032)
11.1.1. Asia Pacific Organic Apple Fiber Revenue (USD Million) by Type (2021-2032)
11.1.2. Asia Pacific Organic Apple Fiber Revenue (USD Million) by Application (2021-2032)
11.1.3. Asia Pacific Organic Apple Fiber Revenue (USD Million) by Product (2021-2032)
By Type
Dietary Fiber<50%
Dietary Fiber≥50%
By Application
Bakery Products
Meat Products
Beverage Products
Desserts Products
Others
Chapter 12. South America Organic Apple Fiber Analysis and Outlook
12.1. South America Organic Apple Fiber Revenue (USD Million), by Segments (2021-2032)
12.1.1. South America Organic Apple Fiber Revenue (USD Million) by Type (2021-2032)
12.1.2. South America Organic Apple Fiber Revenue (USD Million) by Application (2021-2032)
12.1.3. South America Organic Apple Fiber Revenue (USD Million) by Product (2021-2032)
By Type
Dietary Fiber<50%
Dietary Fiber≥50%
By Application
Bakery Products
Meat Products
Beverage Products
Desserts Products
Others
Chapter 13. Middle East and Africa Organic Apple Fiber Analysis and Outlook
13.1. Middle East and Africa Organic Apple Fiber Revenue (USD Million), by Segments (2021-2032)
13.1.1. Middle East and Africa Organic Apple Fiber Revenue (USD Million) by Type (2021-2032)
13.1.2. Middle East and Africa Organic Apple Fiber Revenue (USD Million) by Application (2021-2032)
13.1.3. Middle East and Africa Organic Apple Fiber Revenue (USD Million) by Product (2021-2032)
By Type
Dietary Fiber<50%
Dietary Fiber≥50%
By Application
Bakery Products
Meat Products
Beverage Products
Desserts Products
Others
Chapter 14. Organic Apple Fiber Company Profiles
14.1 Business Overview
14.2 Product Profiles
14.3 SWOT Profiles
14.5 Recent Developments
14.6 Financial Profile
List of Companies
CFF GmbH & Co. KG
Herbafood
InterFiber
JRS
LaBudde Group
Lipotec
Marshall Ingredients
15. Methodology and Data Sources
15.1 Customization Offerings
15.2 Subscription Services
15.3 Related Reports
15.4 Publisher Expertise
LIST OF TABLES
Table 1 Market Segmentation Analysis
Table 2 Global Organic Apple Fiber Market Share of Leading Companies, 2023
Table 3 Product Offerings of Leading Companies
Table 4 Low Growth Scenario Forecasts
Table 5 Reference Case Growth Scenario
Table 6 High Growth Case Scenario
Table 7 Global Organic Apple Fiber Revenue (USD Million) And CAGR (%) By Type (2021-2032)
Table 8 Global Organic Apple Fiber Revenue (USD Million) And CAGR (%) By Application (2021-2032)
Table 9 Global Organic Apple Fiber Revenue (USD Million) And CAGR (%) By Product (2021-2032)
Table 10 Global Organic Apple Fiber Market Revenue (USD Million) By Regions (2021-2032)
Table 11 Global Organic Apple Fiber Market Share (%) By Regions (2021-2032)
Table 12 North America Organic Apple Fiber Revenue (USD Million) By Country (2021-2032)
Table 13 Europe Organic Apple Fiber Revenue (USD Million) By Country (2021-2032)
Table 14 Asia Pacific Organic Apple Fiber Revenue (USD Million) By Country (2021-2032)
Table 15 South America Organic Apple Fiber Revenue (USD Million) By Country (2021-2032)
Table 16 Middle East and Africa Organic Apple Fiber Revenue (USD Million) By Region (2021-2032)
Table 17 North America Organic Apple Fiber Revenue (USD Million) By Type (2021-2032)
Table 18 North America Organic Apple Fiber Revenue (USD Million) By Application (2021-2032)
Table 19 North America Organic Apple Fiber Revenue (USD Million) By Product (2021-2032)
Table 20 Europe Organic Apple Fiber Revenue (USD Million) By Type (2021-2032)
Table 21 Europe Organic Apple Fiber Revenue (USD Million) By Application (2021-2032)
Table 22 Europe Organic Apple Fiber Revenue (USD Million) By Product (2021-2032)
Table 23 Asia Pacific Organic Apple Fiber Revenue (USD Million) By Type (2021-2032)
Table 24 Asia Pacific Organic Apple Fiber Revenue (USD Million) By Application (2021-2032)
Table 25 Asia Pacific Organic Apple Fiber Revenue (USD Million) By Product (2021-2032)
Table 26 South America Organic Apple Fiber Revenue (USD Million) By Type (2021-2032)
Table 27 South America Organic Apple Fiber Revenue (USD Million) By Application (2021-2032)
Table 28 South America Organic Apple Fiber Revenue (USD Million) By Product (2021-2032)
Table 29 Middle East and Africa Organic Apple Fiber Revenue (USD Million) By Type (2021-2032)
Table 30 Middle East and Africa Organic Apple Fiber Revenue (USD Million) By Application (2021-2032)
Table 31 Middle East and Africa Organic Apple Fiber Revenue (USD Million) By Product (2021-2032)
LIST OF FIGURES
Figure 1. Market Scope
Figure 2. Pricing Forecasts Per Unit, 2023- 2032
Figure 3. Porter’s Five Forces
Figure 4. Global Organic Apple Fiber Market Revenue (USD Million) By Regions (2021-2032)
Figure 5. Global Organic Apple Fiber Market Share (%) By Regions (2023)
Figure 6. North America Organic Apple Fiber Revenue (USD Million) By Country (2021-2032)
Figure 7. United States Organic Apple Fiber Revenue (USD Million) By Country (2021-2032)
Figure 8. Canada Organic Apple Fiber Revenue (USD Million) By Country (2021-2032)
Figure 9. Mexico Organic Apple Fiber Revenue (USD Million) By Country (2021-2032)
Figure 10. Europe Organic Apple Fiber Revenue (USD Million) By Country (2021-2032)
Figure 11. Germany Organic Apple Fiber Revenue (USD Million) By Country (2021-2032)
Figure 12. France Organic Apple Fiber Revenue (USD Million) By Country (2021-2032)
Figure 13. United Kingdom Organic Apple Fiber Revenue (USD Million) By Country (2021-2032)
Figure 14. Spain Organic Apple Fiber Revenue (USD Million) By Country (2021-2032)
Figure 15. Italy Organic Apple Fiber Revenue (USD Million) By Country (2021-2032)
Figure 16. Russia Organic Apple Fiber Revenue (USD Million) By Country (2021-2032)
Figure 17. Rest of Europe Organic Apple Fiber Revenue (USD Million) By Country (2021-2032)
Figure 11. Asia Pacific Organic Apple Fiber Revenue (USD Million) By Country (2021-2032)
Figure 12. China Organic Apple Fiber Revenue (USD Million) By Country (2021-2032)
Figure 13. Japan Organic Apple Fiber Revenue (USD Million) By Country (2021-2032)
Figure 14. India Organic Apple Fiber Revenue (USD Million) By Country (2021-2032)
Figure 15. South Korea Organic Apple Fiber Revenue (USD Million) By Country (2021-2032)
Figure 16. Australia Organic Apple Fiber Revenue (USD Million) By Country (2021-2032)
Figure 17. South East Asia Organic Apple Fiber Revenue (USD Million) By Country (2021-2032)
Figure 18. South America Organic Apple Fiber Revenue (USD Million) By Country (2021-2032)
Figure 19. Brazil Organic Apple Fiber Revenue (USD Million) By Country (2021-2032)
Figure 20. Argentina Organic Apple Fiber Revenue (USD Million) By Country (2021-2032)
Figure 21. Rest of Asia Pacific Organic Apple Fiber Revenue (USD Million) By Country (2021-2032)
Figure 22. Middle East and Africa Organic Apple Fiber Revenue (USD Million) By Region (2021-2032)
Figure 23. Saudi Arabia Organic Apple Fiber Revenue (USD Million) By Region (2021-2032)
Figure 24. The UAE Organic Apple Fiber Revenue (USD Million) By Region (2021-2032)
Figure 25. Rest of Middle East Organic Apple Fiber Revenue (USD Million) By Region (2021-2032)
Figure 26. South Africa Organic Apple Fiber Revenue (USD Million) By Region (2021-2032)
Figure 27. Africa Organic Apple Fiber Revenue (USD Million) By Region (2021-2032)
Figure 28. North America Organic Apple Fiber Revenue (USD Million) By Type (2021-2032)
Figure 29. North America Organic Apple Fiber Revenue (USD Million) By Application (2021-2032)
Figure 30. North America Organic Apple Fiber Revenue (USD Million) By Product (2021-2032)
Figure 31. Europe Organic Apple Fiber Revenue (USD Million) By Type (2021-2032)
Figure 32. Europe Organic Apple Fiber Revenue (USD Million) By Application (2021-2032)
Figure 33. Europe Organic Apple Fiber Revenue (USD Million) By Product (2021-2032)
Figure 34. Asia Pacific Organic Apple Fiber Revenue (USD Million) By Type (2021-2032)
Figure 35. Asia Pacific Organic Apple Fiber Revenue (USD Million) By Application (2021-2032)
Figure 36. Asia Pacific Organic Apple Fiber Revenue (USD Million) By Product (2021-2032)
Figure 37. South America Organic Apple Fiber Revenue (USD Million) By Type (2021-2032)
Figure 38. South America Organic Apple Fiber Revenue (USD Million) By Application (2021-2032)
Figure 39. South America Organic Apple Fiber Revenue (USD Million) By Product (2021-2032)
Figure 40. Middle East and Africa Organic Apple Fiber Revenue (USD Million) By Type (2021-2032)
Figure 41. Middle East and Africa Organic Apple Fiber Revenue (USD Million) By Application (2021-2032)
Figure 42. Middle East and Africa Organic Apple Fiber Revenue (USD Million) By Product (2021-2032)
By Type
Dietary Fiber<50%
Dietary Fiber≥50%
By Application
Bakery Products
Meat Products
Beverage Products
Desserts Products
Others
Countries Analyzed
North America (US, Canada, Mexico)
Europe (Germany, UK, France, Spain, Italy, Russia, Rest of Europe)
Asia Pacific (China, India, Japan, South Korea, Australia, South East Asia, Rest of Asia)
South America (Brazil, Argentina, Rest of South America)
Middle East and Africa (Saudi Arabia, UAE, Rest of Middle East, South Africa, Egypt, Rest of Africa)
