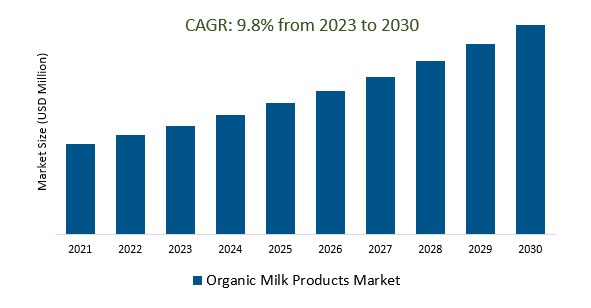
The Global Organic Milk Products Market Size is estimated to register 9.8% growth over the forecast period from 2023 to 2030.
The market growth is driven by increasing growth in organic farming practices, which include organic dairy farming, contributing to the availability and affordability of organic milk products. Leading Companies focusing on Continued Consumer Demand, Global Expansion, Innovation and Product Diversification, Online and Direct-to-Consumer Sales, Health and Wellness Trends, Education and Awareness, Government Support, and others to boost market shares in the industry.
Market Overview
The organic milk products market is characterized by steady growth driven by increasing consumer demand for healthier, environmentally friendly options. Consumers seek organic dairy products due to their perceived health benefits and sustainability practices, though they often come at a premium price. Major players in the industry include companies like Horizon Organic and Organic Valley, with distribution through various channels and region-specific variations. Challenges include production costs and competition from plant-based alternatives, while opportunities lie in consumer education and product innovation.
Market Dynamics
Market Trends- The growing popularity of dairy-free and plant-based milk alternatives is driving the demand for organic milk products.
The surge in demand for dairy-free and plant-based milk alternatives is reshaping the organic milk products market, driven by changing consumer preferences for healthier, more sustainable options. As consumers increasingly opt for plant-based diets and reduce dairy consumption for various reasons, the organic dairy industry is diversifying to offer organic plant-based milk alternatives such as almond, soy, and oat milk. This trend fosters innovation, competition, and the development of niche organic plant-based products, addressing health, sustainability, and ethical concerns while expanding the market's product offerings. The presence of organic plant-based options on retail shelves reflects the industry's adaptability to meet evolving consumer needs and is expected to drive continued growth in organic milk products.
Market Driver- The growing popularity of e-commerce and direct-to-consumer sales is making it easier for consumers to purchase organic milk products, driving the demand for these products.
The increasing popularity of e-commerce and direct-to-consumer (DTC) sales channels is significantly boosting the demand for organic milk products by providing consumers with convenient access to a wider selection of products, greater product transparency, educational resources, and competitive pricing. This trend appeals to a broad and diverse consumer base, particularly those seeking the convenience of home shopping, and the availability of subscription services further fosters brand loyalty. E-commerce and DTC sales are poised to continue driving the growth of the organic milk products market in the future.
Market Opportunity- The increasing demand for organic milk products sourced from local and small-scale producers is driving the growth of the organic milk products market.\
The organic milk products market is experiencing growth due to the rising consumer demand for products sourced from local and small-scale producers. Consumers are drawn to these products because of their perceived higher quality, better taste, transparent production methods, and alignment with sustainability. The emphasis on supporting local communities and fostering personal connections with producers also drives the preference for organic milk products from local sources, contributing to the overall growth of this market.
Market Share Analysis- Organic Whole Milk The Organic Milk Products Market will register the fastest growth
The Global Organic Milk Products Market is analyzed across Organic Whole Milk, Organic 2% Milk, Organic 1% Milk, Organic Fat-free Milk, and others. Organic Whole Milk is poised to register the fastest growth. Organic whole milk is a significant segment in the organic milk products market, offering a full-fat, unaltered dairy product produced using organic farming methods. It is favored by consumers looking for a healthier and more sustainable milk option, with a focus on natural farming practices, increased nutrient content, and the absence of synthetic additives, contributing to its prominence in the organic milk market.
Market Share Analysis- Pouches held a significant market share in 2023
The Global Organic Milk Products Market is analyzed across various Packaging including Pouches, Cartons, Bottles, Cans, and others. Of these, Pouches held a significant market share in 2023. Pouches are gaining popularity in the organic milk products market as a convenient, eco-friendly, and lightweight packaging choice, addressing consumer demands for sustainability and convenience while extending product shelf life and reducing environmental impact.
Organic Milk Products Market Segmentation
By Type
- Organic Whole Milk
- Organic 2% Milk
- Organic 1% Milk
- Organic Fat-free Milk
- Others
By Packaging
- Pouches
- Cartons
- Bottles
- Cans
By Distribution Channel
- Hypermarkets/Supermarkets
- Convenience Stores
- Online Stores
- Others
By Source
By Region
- North America (United States, Canada, Mexico)
- Europe (Germany, France, United Kingdom, Spain, Italy, Others)
- Asia Pacific (China, India, Japan, South Korea, Australia, Others)
- Latin America (Brazil, Argentina, Others)
- Middle East and Africa (Saudi Arabia, UAE, Kuwait, Other Middle East, South Africa, Nigeria, Other Africa)
Organic Milk Products Market Companies
- Nestle S.A.
- Andechser Dairy
- Arla Food
- Fonterra Co-operative Group
- Danone Group
- Aurora Organic Dairy
- Avalon Dairy
- Emmi
- Horizon Organic
- Organic Dairy Farmers
- Organic Valley
- Yeo Valley
- Lactalis International
- Bruton Dairy
*List not exhaustive
Organic Milk Products Market Outlook 2023
1 Market Overview
1.1 Introduction to the Organic Milk Products Market
1.2 Scope of the Study
1.3 Research Objective
1.3.1 Key Market Scope and Segments
1.3.2 Players Covered
1.3.3 Years Considered
2 Executive Summary
2.1 2023 Organic Milk Products Industry- Market Statistics
3 Market Dynamics
3.1 Market Drivers
3.2 Market Challenges
3.3 Market Opportunities
3.4 Market Trends
4 Market Factor Analysis
4.1 Porter’s Five Forces
4.2 Market Entropy
4.2.1 Global Organic Milk Products Market Companies with Area Served
4.2.2 Products Offerings Global Organic Milk Products Market
5 COVID-19 Impact Analysis and Outlook Scenarios
5.1.1 Covid-19 Impact Analysis
5.1.2 post-COVID-19 Scenario- Low Growth Case
5.1.3 post-COVID-19 Scenario- Reference Growth Case
5.1.4 post-COVID-19 Scenario- Low Growth Case
6 Global Organic Milk Products Market Trends
6.1 Global Organic Milk Products Revenue (USD Million) and CAGR (%) by Type (2018-2030)
6.2 Global Organic Milk Products Revenue (USD Million) and CAGR (%) by Applications (2018-2030)
6.3 Global Organic Milk Products Revenue (USD Million) and CAGR (%) by regions (2018-2030)
7 Global Organic Milk Products Market Revenue (USD Million) by Type, and Applications (2018-2022)
7.1 Global Organic Milk Products Revenue (USD Million) by Type (2018-2022)
7.1.1 Global Organic Milk Products Revenue (USD Million), Market Share (%) by Type (2018-2022)
7.2 Global Organic Milk Products Revenue (USD Million) by Applications (2018-2022)
7.2.1 Global Organic Milk Products Revenue (USD Million), Market Share (%) by Applications (2018-2022)
8 Global Organic Milk Products Development Regional Status and Outlook
8.1 Global Organic Milk Products Revenue (USD Million) By Regions (2018-2022)
8.2 North America Organic Milk Products Revenue (USD Million) by Type, and Application (2018-2022)
8.2.1 North America Organic Milk Products Revenue (USD Million) by Country (2018-2022)
8.2.2 North America Organic Milk Products Revenue (USD Million) by Type (2018-2022)
8.2.3 North America Organic Milk Products Revenue (USD Million) by Applications (2018-2022)
8.3 Europe Organic Milk Products Revenue (USD Million), by Type, and Applications (USD Million) (2018-2022)
8.3.1 Europe Organic Milk Products Revenue (USD Million), by Country (2018-2022)
8.3.2 Europe Organic Milk Products Revenue (USD Million) by Type (2018-2022)
8.3.3 Europe Organic Milk Products Revenue (USD Million) by Applications (2018-2022)
8.4 Asia Pacific Organic Milk Products Revenue (USD Million), and Revenue (USD Million) by Type, and Applications (2018-2022)
8.4.1 Asia Pacific Organic Milk Products Revenue (USD Million) by Country (2018-2022)
8.4.2 Asia Pacific Organic Milk Products Revenue (USD Million) by Type (2018-2022)
8.4.3 Asia Pacific Organic Milk Products Revenue (USD Million) by Applications (2018-2022)
8.5 South America Organic Milk Products Revenue (USD Million), by Type, and Applications (2018-2022)
8.5.1 South America Organic Milk Products Revenue (USD Million), by Country (2018-2022)
8.5.2 South America Organic Milk Products Revenue (USD Million) by Type (2018-2022)
8.5.3 South America Organic Milk Products Revenue (USD Million) by Applications (2018-2022)
8.6 Middle East and Africa Organic Milk Products Revenue (USD Million), by Type, Technology, Application, Thickness (2018-2022)
8.6.1 Middle East and Africa Organic Milk Products Revenue (USD Million) by Country (2018-2022)
8.6.2 Middle East and Africa Organic Milk Products Revenue (USD Million) by Type (2018-2022)
8.6.3 Middle East and Africa Organic Milk Products Revenue (USD Million) by Applications (2018-2022)
9 Company Profiles
10 Global Organic Milk Products Market Revenue (USD Million), by Type, and Applications (2023-2030)
10.1 Global Organic Milk Products Revenue (USD Million) and Market Share (%) by Type (2023-2030)
10.1.1 Global Organic Milk Products Revenue (USD Million), and Market Share (%) by Type (2023-2030)
10.2 Global Organic Milk Products Revenue (USD Million) and Market Share (%) by Applications (2023-2030)
10.2.1 Global Organic Milk Products Revenue (USD Million), and Market Share (%) by Applications (2023-2030)
11 Global Organic Milk Products Development Regional Status and Outlook Forecast
11.1 Global Organic Milk Products Revenue (USD Million) By Regions (2023-2030)
11.2 North America Organic Milk Products Revenue (USD Million) by Type, and Applications (2023-2030)
11.2.1 North America Organic Milk Products Revenue (USD) Million by Country (2023-2030)
11.2.2 North America Organic Milk Products Revenue (USD Million), by Type (2023-2030)
11.2.3 North America Organic Milk Products Revenue (USD Million), Market Share (%) by Applications (2023-2030)
11.3 Europe Organic Milk Products Revenue (USD Million), by Type, and Applications (2023-2030)
11.3.1 Europe Organic Milk Products Revenue (USD Million), by Country (2023-2030)
11.3.2 Europe Organic Milk Products Revenue (USD Million), by Type (2023-2030)
11.3.3 Europe Organic Milk Products Revenue (USD Million), by Applications (2023-2030)
11.4 Asia Pacific Organic Milk Products Revenue (USD Million) by Type, and Applications (2023-2030)
11.4.1 Asia Pacific Organic Milk Products Revenue (USD Million), by Country (2023-2030)
11.4.2 Asia Pacific Organic Milk Products Revenue (USD Million), by Type (2023-2030)
11.4.3 Asia Pacific Organic Milk Products Revenue (USD Million), by Applications (2023-2030)
11.5 South America Organic Milk Products Revenue (USD Million), by Type, and Applications (2023-2030)
11.5.1 South America Organic Milk Products Revenue (USD Million), by Country (2023-2030)
11.5.2 South America Organic Milk Products Revenue (USD Million), by Type (2023-2030)
11.5.3 South America Organic Milk Products Revenue (USD Million), by Applications (2023-2030)
11.6 Middle East and Africa Organic Milk Products Revenue (USD Million), by Type, and Applications (2023-2030)
11.6.1 Middle East and Africa Organic Milk Products Revenue (USD Million), by region (2023-2030)
11.6.2 Middle East and Africa Organic Milk Products Revenue (USD Million), by Type (2023-2030)
11.6.3 Middle East and Africa Organic Milk Products Revenue (USD Million), by Applications (2023-2030)
12 Methodology and Data Sources
12.1 Methodology/Research Approach
12.1.1 Research Programs/Design
12.1.2 Market Size Estimation
12.1.3 Market Breakdown and Data Triangulation
12.2 Data Sources
12.2.1 Secondary Sources
12.2.2 Primary Sources
12.3 Disclaimer
List of Tables
Table 1 Market Segmentation Analysis
Table 2 Global Organic Milk Products Market Companies with Areas Served
Table 3 Products Offerings Global Organic Milk Products Market
Table 4 Low Growth Scenario Forecasts
Table 5 Reference Case Growth Scenario
Table 6 High Growth Case Scenario
Table 7 Global Organic Milk Products Revenue (USD Million) And CAGR (%) By Type (2018-2030)
Table 8 Global Organic Milk Products Revenue (USD Million) And CAGR (%) By Applications (2018-2030)
Table 9 Global Organic Milk Products Revenue (USD Million) And CAGR (%) By Regions (2018-2030)
Table 10 Global Organic Milk Products Revenue (USD Million) By Type (2018-2022)
Table 11 Global Organic Milk Products Revenue Market Share (%) By Type (2018-2022)
Table 12 Global Organic Milk Products Revenue (USD Million) By Applications (2018-2022)
Table 13 Global Organic Milk Products Revenue Market Share (%) By Applications (2018-2022)
Table 14 Global Organic Milk Products Market Revenue (USD Million) By Regions (2018-2022)
Table 15 Global Organic Milk Products Market Share (%) By Regions (2018-2022)
Table 16 North America Organic Milk Products Revenue (USD Million) By Country (2018-2022)
Table 17 North America Organic Milk Products Revenue (USD Million) By Type (2018-2022)
Table 18 North America Organic Milk Products Revenue (USD Million) By Applications (2018-2022)
Table 19 Europe Organic Milk Products Revenue (USD Million) By Country (2018-2022)
Table 20 Europe Organic Milk Products Revenue (USD Million) By Type (2018-2022)
Table 21 Europe Organic Milk Products Revenue (USD Million) By Applications (2018-2022)
Table 22 Asia Pacific Organic Milk Products Revenue (USD Million) By Country (2018-2022)
Table 23 Asia Pacific Organic Milk Products Revenue (USD Million) By Type (2018-2022)
Table 24 Asia Pacific Organic Milk Products Revenue (USD Million) By Applications (2018-2022)
Table 25 South America Organic Milk Products Revenue (USD Million) By Country (2018-2022)
Table 26 South America Organic Milk Products Revenue (USD Million) By Type (2018-2022)
Table 27 South America Organic Milk Products Revenue (USD Million) By Applications (2018-2022)
Table 28 Middle East and Africa Organic Milk Products Revenue (USD Million) By Region (2018-2022)
Table 29 Middle East and Africa Organic Milk Products Revenue (USD Million) By Type (2018-2022)
Table 30 Middle East and Africa Organic Milk Products Revenue (USD Million) By Applications (2018-2022)
Table 31 Financial Analysis
Table 32 Global Organic Milk Products Revenue (USD Million) By Type (2023-2030)
Table 33 Global Organic Milk Products Revenue Market Share (%) By Type (2023-2030)
Table 34 Global Organic Milk Products Revenue (USD Million) By Applications (2023-2030)
Table 35 Global Organic Milk Products Revenue Market Share (%) By Applications (2023-2030)
Table 36 Global Organic Milk Products Market Revenue (USD Million), And Revenue (USD Million) By Regions (2023-2030)
Table 37 North America Organic Milk Products Revenue (USD)By Country (2023-2030)
Table 38 North America Organic Milk Products Revenue (USD Million) By Type (2023-2030)
Table 39 North America Organic Milk Products Revenue (USD Million) By Applications (2023-2030)
Table 40 Europe Organic Milk Products Revenue (USD Million) By Country (2023-2030)
Table 41 Europe Organic Milk Products Revenue (USD Million) By Type (2023-2030)
Table 42 Europe Organic Milk Products Revenue (USD Million) By Applications (2023-2030)
Table 43 Asia Pacific Organic Milk Products Revenue (USD Million) By Country (2023-2030)
Table 44 Asia Pacific Organic Milk Products Revenue (USD Million) By Type (2023-2030)
Table 45 Asia Pacific Organic Milk Products Revenue (USD Million) By Applications (2023-2030)
Table 46 South America Organic Milk Products Revenue (USD Million) By Country (2023-2030)
Table 47 South America Organic Milk Products Revenue (USD Million) By Type (2023-2030)
Table 48 South America Organic Milk Products Revenue (USD Million) By Applications (2023-2030)
Table 49 Middle East and Africa Organic Milk Products Revenue (USD Million) By Region (2023-2030)
Table 50 Middle East and Africa Organic Milk Products Revenue (USD Million) By Region (2023-2030)
Table 51 Middle East and Africa Organic Milk Products Revenue (USD Million) By Type (2023-2030)
Table 52 Middle East and Africa Organic Milk Products Revenue (USD Million) By Applications (2023-2030)
Table 53 Research Programs/Design for This Report
Table 54 Key Data Information from Secondary Sources
Table 55 Key Data Information from Primary Sources
List of Figures
Figure 1 Market Scope
Figure 2 Porter’s Five Forces
Figure 3 Global Organic Milk Products Revenue (USD Million) By Type (2018-2022)
Figure 4 Global Organic Milk Products Revenue Market Share (%) By Type (2022)
Figure 5 Global Organic Milk Products Revenue (USD Million) By Applications (2018-2022)
Figure 6 Global Organic Milk Products Revenue Market Share (%) By Applications (2022)
Figure 7 Global Organic Milk Products Market Revenue (USD Million) By Regions (2018-2022)
Figure 8 Global Organic Milk Products Market Share (%) By Regions (2022)
Figure 9 North America Organic Milk Products Revenue (USD Million) By Country (2018-2022)
Figure 10 North America Organic Milk Products Revenue (USD Million) By Type (2018-2022)
Figure 11 North America Organic Milk Products Revenue (USD Million) By Applications (2018-2022)
Figure 12 Europe Organic Milk Products Revenue (USD Million) By Country (2018-2022)
Figure 13 Europe Organic Milk Products Revenue (USD Million) By Type (2018-2022)
Figure 14 Europe Organic Milk Products Revenue (USD Million) By Applications (2018-2022)
Figure 15 Asia Pacific Organic Milk Products Revenue (USD Million) By Country (2018-2022)
Figure 16 Asia Pacific Organic Milk Products Revenue (USD Million) By Type (2018-2022)
Figure 17 Asia Pacific Organic Milk Products Revenue (USD Million) By Applications (2018-2022)
Figure 18 South America Organic Milk Products Revenue (USD Million) By Country (2018-2022)
Figure 19 South America Organic Milk Products Revenue (USD Million) By Type (2018-2022)
Figure 20 South America Organic Milk Products Revenue (USD Million) By Applications (2018-2022)
Figure 21 Middle East and Africa Organic Milk Products Revenue (USD Million) By Region (2018-2022)
Figure 22 Middle East and Africa Organic Milk Products Revenue (USD Million) By Type (2018-2022)
Figure 23 Middle East and Africa Organic Milk Products Revenue (USD Million) By Applications (2018-2022)
Figure 24 Global Organic Milk Products Revenue (USD Million) By Type (2023-2030)
Figure 25 Global Organic Milk Products Revenue Market Share (%) By Type (2030)
Figure 26 Global Organic Milk Products Revenue (USD Million) By Applications (2023-2030)
Figure 27 Global Organic Milk Products Revenue Market Share (%) By Applications (2030)
Figure 28 Global Organic Milk Products Market Revenue (USD Million) By Regions (2023-2030)
Figure 29 North America Organic Milk Products Revenue (USD Million) By Country (2023-2030)
Figure 30 North America Organic Milk Products Revenue (USD Million) By Type (2023-2030)
Figure 31 North America Organic Milk Products Revenue (USD Million) By Applications (2023-2030)
Figure 32 Europe Organic Milk Products Revenue (USD Million) By Country (2023-2030)
Figure 33 Europe Organic Milk Products Revenue (USD Million) By Type (2023-2030)
Figure 34 Europe Organic Milk Products Revenue (USD Million) By Applications (2023-2030)
Figure 35 Asia Pacific Organic Milk Products Revenue (USD Million) By Country (2023-2030)
Figure 36 Asia Pacific Organic Milk Products Revenue (USD Million) By Type (2023-2030)
Figure 37 Asia Pacific Organic Milk Products Revenue (USD Million) By Applications (2023-2030)
Figure 38 South America Organic Milk Products Revenue (USD Million) By Country (2023-2030)
Figure 39 South America Organic Milk Products Revenue (USD Million) By Type (2023-2030)
Figure 40 South America Organic Milk Products Revenue (USD Million) By Applications (2023-2030)
Figure 41 Middle East and Africa Organic Milk Products Revenue (USD Million) By Region (2023-2030)
Figure 42 Middle East and Africa Organic Milk Products Revenue (USD Million) By Region (2023-2030)
Figure 43 Middle East and Africa Organic Milk Products Revenue (USD Million) By Type (2023-2030)
Figure 44 Middle East and Africa Organic Milk Products Revenue (USD Million) By Applications (2023-2030)
Figure 45 Bottom-Up and Top-Down Approaches for This Report
Figure 46 Data Triangulation
