The Global Pan Masala Market Size is estimated to register 4.1% growth over the forecast period from 2025 to 2034.
The market growth is driven by Increasing Economic growth and rising disposable incomes in certain regions can boost the Pan Masala market as consumers may have more spending power for such products. Leading companies are focusing on Healthier and Natural Alternatives, Innovation in Flavors and Varieties, Sustainability and Eco-Friendly Packaging, Digital Marketing and E-commerce, Regulatory Compliance, Health and Wellness Promotion, and others to boost market shares in the industry.
Pan Masala Market Overview
The Pan Masala market, prevalent in South Asia, offers chewable tobacco products with diverse ingredients. It has grown due to cultural practices and affordability but faces health concerns and regulations, impacting both domestic and international manufacturers. Future trends may involve healthier alternatives, regulatory changes, and increased sustainability focus in packaging.
The global Pan Masala Market Study analyzes and forecasts the market size across 6 regions and 24 countries for diverse segments - By Type (Pan Masala with Tobacco, Plain Pan Masala, Flavored Pan Masala) By Application (Retail Stores, Supermarket, Online Stores)
Pan Masala Market Competitive Analysis
The market research study provides in-depth insights into leading companies including the SWOT analyses, product profile, financial details, and recent developments across DS Group, Manicaland, A & C- Pan Bahar, Kothari Products, Lalwani Group, Dinesh Pouches Limited, Godfrey Phillips, and Others.
Pan Masala Market Dynamics
Market Trends- The Impact of Pan Masala on Oral Health
Pan Masala consumption is linked to detrimental effects on oral health, including teeth staining, gum disease, and an elevated risk of oral cancer due to the presence of areca nut and abrasive components. These health concerns have prompted increased awareness and regulatory measures, potentially impacting consumer preferences within the Pan Masala market.
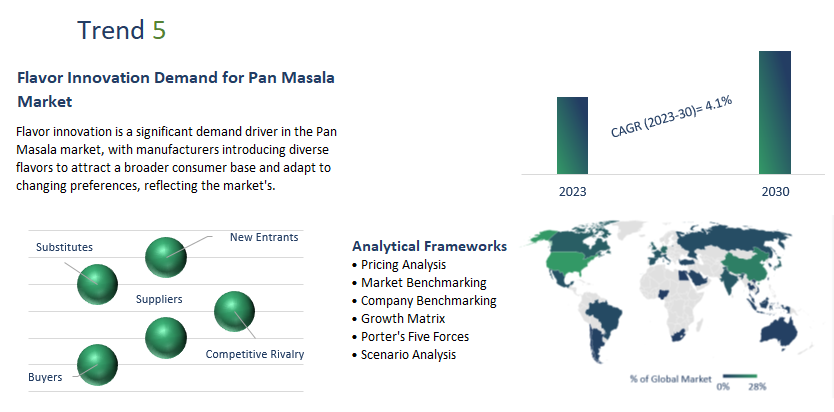
Market Driver- Flavor Innovation Demand for Pan Masala Market
Flavor innovation is a significant demand driver in the Pan Masala market, with manufacturers introducing diverse flavors to attract a broader consumer base and adapt to changing preferences, reflecting the market's responsiveness to evolving consumer choices and the need for variety to maintain consumer interest and loyalty.
Market Opportunity-Introduction of Marketing and Branding
Marketing and branding are pivotal in the Pan Masala market, involving digital marketing, celebrity endorsements, and innovative campaigns to target audiences and establish brand identity. Product differentiation through unique flavors, ingredients, and health benefits is common to gain a competitive edge. Effective branding builds consumer trust and compliance with health regulations through clear labeling and health warnings is crucial.
Market Share Analysis- Flavored pan masala Pan Masala Market will register the fastest growth
The Global Pan Masala Market is analyzed by Flavored, Pan Masala Plain Pan Masala, Flavored Pan Masala, and others. Of these, Flavored pan masala will register the fastest growth. Flavored pan masala is a significant category within the Pan Masala Market, featuring pan masala products infused with various flavors like spices, herbs, sweeteners, and natural or artificial flavors. These offerings cater to diverse consumer preferences, expanding the market's appeal and allowing manufacturers to adapt to changing demands, thus contributing to market growth and competitiveness.
Market Share Analysis – Retail Stores held a significant market share in 2024
The Global Pan Masala Market is analyzed across various applications including, Retail Stores, supermarkets, Online Stores, and Others. Of these, Retail Stores held a significant market share in 2024. Retail stores are a critical distribution channel in the Pan Masala Market, encompassing convenience stores, supermarkets, hypermarkets, and specialty tobacco and pan shops. They provide consumers with easy access to a variety of pan masala products, contributing significantly to market reach and sales volume. Retail stores play a vital role in promoting brand visibility and product availability, making them a cornerstone of the pan masala industry's distribution strategy.
United States Pan Masala Market Size Outlook
The pan masala market in the United States remains niche, primarily catering to South Asian expatriates and consumers seeking traditional Indian and South Asian products. The market is supported by the increasing availability of specialty grocery stores, ethnic supermarkets, and online platforms that offer imported pan masala brands. However, regulatory scrutiny around tobacco-infused variants, particularly gutkha and flavored chewing tobacco, limits widespread expansion. Rising health consciousness and growing concerns over carcinogenic additives have also led to a shift toward herbal and tobacco-free alternatives. Despite these challenges, the demand for premium, scented, and sugar-coated pan masala products is growing within diaspora communities, particularly in states with large Indian and Pakistani populations such as California, New York, and Texas.
Europe Pan Masala Market Size Outlook
In Europe, the pan masala market is largely concentrated within South Asian immigrant communities, with demand driven by cultural preferences and traditional consumption habits. The UK, Germany, and France are key markets due to their sizable Indian, Pakistani, and Bangladeshi populations. However, stringent European Union regulations on tobacco-containing products, including bans on gutkha, have limited the market's growth potential. As a result, there is a rising preference for non-tobacco and mouth-freshener variants of pan masala, which are more widely available in South Asian grocery stores. Despite these regulatory constraints, increasing online sales and the premiumization of herbal and silver-coated pan masala varieties are helping sustain market growth in select diaspora-driven retail segments.
Southeast Asia Pan Masala Market Size Outlook
The pan masala market in Southeast Asia is relatively small but growing, particularly in countries with a strong Indian expatriate presence such as Malaysia, Singapore, and Thailand. The market is fueled by cultural affinity and the increasing availability of Indian grocery stores and international brands. However, stringent health regulations in countries like Singapore have restricted the sale of tobacco-containing pan masala products, pushing consumers toward herbal and flavored alternatives. In markets like Thailand, where chewing betel nut remains a cultural tradition, pan masala has some crossover appeal. Despite these trends, awareness regarding the health risks associated with pan masala consumption poses a challenge to mainstream acceptance outside niche consumer groups.
Saudi Arabia Pan Masala Market Size Outlook
Saudi Arabia represents a notable market for pan masala, primarily driven by demand from the South Asian expatriate workforce. The product is widely available in South Asian grocery stores and informal retail channels, with premium and flavored variants gaining popularity. However, increasing government regulations on tobacco products, as part of broader public health initiatives, have impacted the market for gutkha and tobacco-infused pan masala. Additionally, growing health awareness among consumers is pushing demand for safer alternatives such as herbal and sugar-free pan masala. While market restrictions pose challenges, the presence of a large expatriate population and the growing convenience store segment continue to support demand for non-tobacco pan masala products.
Pan Masala Market Report Scope
Pan Masala Market
|
Parameter
|
Details
|
|
Market Growth Rate
|
4.1%
|
|
Segments
|
By Type (Pan Masala with Tobacco, Plain Pan Masala, Flavored Pan Masala) By Application (Retail Stores, Supermarket, Online Stores)
|
|
Study Period
|
2019- 2024 and 2025-2034
|
|
Units
|
Revenue (USD)
|
|
Qualitative Analysis
|
Porter’s Five Forces, SWOT Profile, Market Share, Scenario Forecasts, Market Ecosystem, Company Ranking, Market Dynamics, Industry Benchmarking
|
|
Companies
|
DS Group, Manicaland, A & C- Pan Bahar, Kothari Products, Lalwani Group, Dinesh Pouches Limited, Godfrey Phillips, and Others.
|
|
Countries
|
US, Canada, Mexico, Germany, France, Spain, Italy, UK, Russia, China, India, Japan, South Korea, Australia, South East Asia, Brazil, Argentina, Middle East, Africa
|
Pan Masala Market Segmentation
By Type
By Application
By Region
- North America (United States, Canada, Mexico)
- Europe (Germany, France, United Kingdom, Spain, Italy, Others)
- Asia Pacific (China, India, Japan, South Korea, Australia, Others)
- Latin America (Brazil, Argentina, Others)
- Middle East and Africa (Saudi Arabia, UAE, Kuwait, Other Middle East, South Africa, Nigeria, Other Africa)
Pan Masala Companies Profiled in the Study
- DS Group
- Manicaland
- A & C- Pan Bahar
- Kothari Products
- Lalwani Group
- Dinesh Pouches Limited
- Godfrey Phillips
* List not exhaustive
Pan Masala Market Outlook 2023
1 Market Overview
1.1 Introduction to the Pan Masala Market
1.2 Scope of the Study
1.3 Research Objective
1.3.1 Key Market Scope and Segments
1.3.2 Players Covered
1.3.3 Years Considered
2 Executive Summary
2.1 2023 Pan Masala Industry- Market Statistics
3 Market Dynamics
3.1 Market Drivers
3.2 Market Challenges
3.3 Market Opportunities
3.4 Market Trends
4 Market Factor Analysis
4.1 Porter’s Five Forces
4.2 Market Entropy
4.2.1 Global Pan Masala Market Companies with Area Served
4.2.2 Products Offerings Global Pan Masala Market
5 COVID-19 Impact Analysis and Outlook Scenarios
5.1.1 Covid-19 Impact Analysis
5.1.2 post-COVID-19 Scenario- Low Growth Case
5.1.3 post-COVID-19 Scenario- Reference Growth Case
5.1.4 post-COVID-19 Scenario- Low Growth Case
6 Global Pan Masala Market Trends
6.1 Global Pan Masala Revenue (USD Million) and CAGR (%) by Type (2018-2030)
6.2 Global Pan Masala Revenue (USD Million) and CAGR (%) by Applications (2018-2030)
6.3 Global Pan Masala Revenue (USD Million) and CAGR (%) by regions (2018-2030)
7 Global Pan Masala Market Revenue (USD Million) by Type, and Applications (2018-2022)
7.1 Global Pan Masala Revenue (USD Million) by Type (2018-2022)
7.1.1 Global Pan Masala Revenue (USD Million), Market Share (%) by Type (2018-2022)
7.2 Global Pan Masala Revenue (USD Million) by Applications (2018-2022)
7.2.1 Global Pan Masala Revenue (USD Million), Market Share (%) by Applications (2018-2022)
8 Global Pan Masala Development Regional Status and Outlook
8.1 Global Pan Masala Revenue (USD Million) By Regions (2018-2022)
8.2 North America Pan Masala Revenue (USD Million) by Type, and Application (2018-2022)
8.2.1 North America Pan Masala Revenue (USD Million) by Country (2018-2022)
8.2.2 North America Pan Masala Revenue (USD Million) by Type (2018-2022)
8.2.3 North America Pan Masala Revenue (USD Million) by Applications (2018-2022)
8.3 Europe Pan Masala Revenue (USD Million), by Type, and Applications (USD Million) (2018-2022)
8.3.1 Europe Pan Masala Revenue (USD Million), by Country (2018-2022)
8.3.2 Europe Pan Masala Revenue (USD Million) by Type (2018-2022)
8.3.3 Europe Pan Masala Revenue (USD Million) by Applications (2018-2022)
8.4 Asia Pacific Pan Masala Revenue (USD Million), and Revenue (USD Million) by Type, and Applications (2018-2022)
8.4.1 Asia Pacific Pan Masala Revenue (USD Million) by Country (2018-2022)
8.4.2 Asia Pacific Pan Masala Revenue (USD Million) by Type (2018-2022)
8.4.3 Asia Pacific Pan Masala Revenue (USD Million) by Applications (2018-2022)
8.5 South America Pan Masala Revenue (USD Million), by Type, and Applications (2018-2022)
8.5.1 South America Pan Masala Revenue (USD Million), by Country (2018-2022)
8.5.2 South America Pan Masala Revenue (USD Million) by Type (2018-2022)
8.5.3 South America Pan Masala Revenue (USD Million) by Applications (2018-2022)
8.6 Middle East and Africa Pan Masala Revenue (USD Million), by Type, Technology, Application, Thickness (2018-2022)
8.6.1 Middle East and Africa Pan Masala Revenue (USD Million) by Country (2018-2022)
8.6.2 Middle East and Africa Pan Masala Revenue (USD Million) by Type (2018-2022)
8.6.3 Middle East and Africa Pan Masala Revenue (USD Million) by Applications (2018-2022)
9 Company Profiles
10 Global Pan Masala Market Revenue (USD Million), by Type, and Applications (2023-2030)
10.1 Global Pan Masala Revenue (USD Million) and Market Share (%) by Type (2023-2030)
10.1.1 Global Pan Masala Revenue (USD Million), and Market Share (%) by Type (2023-2030)
10.2 Global Pan Masala Revenue (USD Million) and Market Share (%) by Applications (2023-2030)
10.2.1 Global Pan Masala Revenue (USD Million), and Market Share (%) by Applications (2023-2030)
11 Global Pan Masala Development Regional Status and Outlook Forecast
11.1 Global Pan Masala Revenue (USD Million) By Regions (2023-2030)
11.2 North America Pan Masala Revenue (USD Million) by Type, and Applications (2023-2030)
11.2.1 North America Pan Masala Revenue (USD) Million by Country (2023-2030)
11.2.2 North America Pan Masala Revenue (USD Million), by Type (2023-2030)
11.2.3 North America Pan Masala Revenue (USD Million), Market Share (%) by Applications (2023-2030)
11.3 Europe Pan Masala Revenue (USD Million), by Type, and Applications (2023-2030)
11.3.1 Europe Pan Masala Revenue (USD Million), by Country (2023-2030)
11.3.2 Europe Pan Masala Revenue (USD Million), by Type (2023-2030)
11.3.3 Europe Pan Masala Revenue (USD Million), by Applications (2023-2030)
11.4 Asia Pacific Pan Masala Revenue (USD Million) by Type, and Applications (2023-2030)
11.4.1 Asia Pacific Pan Masala Revenue (USD Million), by Country (2023-2030)
11.4.2 Asia Pacific Pan Masala Revenue (USD Million), by Type (2023-2030)
11.4.3 Asia Pacific Pan Masala Revenue (USD Million), by Applications (2023-2030)
11.5 South America Pan Masala Revenue (USD Million), by Type, and Applications (2023-2030)
11.5.1 South America Pan Masala Revenue (USD Million), by Country (2023-2030)
11.5.2 South America Pan Masala Revenue (USD Million), by Type (2023-2030)
11.5.3 South America Pan Masala Revenue (USD Million), by Applications (2023-2030)
11.6 Middle East and Africa Pan Masala Revenue (USD Million), by Type, and Applications (2023-2030)
11.6.1 Middle East and Africa Pan Masala Revenue (USD Million), by region (2023-2030)
11.6.2 Middle East and Africa Pan Masala Revenue (USD Million), by Type (2023-2030)
11.6.3 Middle East and Africa Pan Masala Revenue (USD Million), by Applications (2023-2030)
12 Methodology and Data Sources
12.1 Methodology/Research Approach
12.1.1 Research Programs/Design
12.1.2 Market Size Estimation
12.1.3 Market Breakdown and Data Triangulation
12.2 Data Sources
12.2.1 Secondary Sources
12.2.2 Primary Sources
12.3 Disclaimer
List of Tables
Table 1 Market Segmentation Analysis
Table 2 Global Pan Masala Market Companies with Areas Served
Table 3 Products Offerings Global Pan Masala Market
Table 4 Low Growth Scenario Forecasts
Table 5 Reference Case Growth Scenario
Table 6 High Growth Case Scenario
Table 7 Global Pan Masala Revenue (USD Million) And CAGR (%) By Type (2018-2030)
Table 8 Global Pan Masala Revenue (USD Million) And CAGR (%) By Applications (2018-2030)
Table 9 Global Pan Masala Revenue (USD Million) And CAGR (%) By Regions (2018-2030)
Table 10 Global Pan Masala Revenue (USD Million) By Type (2018-2022)
Table 11 Global Pan Masala Revenue Market Share (%) By Type (2018-2022)
Table 12 Global Pan Masala Revenue (USD Million) By Applications (2018-2022)
Table 13 Global Pan Masala Revenue Market Share (%) By Applications (2018-2022)
Table 14 Global Pan Masala Market Revenue (USD Million) By Regions (2018-2022)
Table 15 Global Pan Masala Market Share (%) By Regions (2018-2022)
Table 16 North America Pan Masala Revenue (USD Million) By Country (2018-2022)
Table 17 North America Pan Masala Revenue (USD Million) By Type (2018-2022)
Table 18 North America Pan Masala Revenue (USD Million) By Applications (2018-2022)
Table 19 Europe Pan Masala Revenue (USD Million) By Country (2018-2022)
Table 20 Europe Pan Masala Revenue (USD Million) By Type (2018-2022)
Table 21 Europe Pan Masala Revenue (USD Million) By Applications (2018-2022)
Table 22 Asia Pacific Pan Masala Revenue (USD Million) By Country (2018-2022)
Table 23 Asia Pacific Pan Masala Revenue (USD Million) By Type (2018-2022)
Table 24 Asia Pacific Pan Masala Revenue (USD Million) By Applications (2018-2022)
Table 25 South America Pan Masala Revenue (USD Million) By Country (2018-2022)
Table 26 South America Pan Masala Revenue (USD Million) By Type (2018-2022)
Table 27 South America Pan Masala Revenue (USD Million) By Applications (2018-2022)
Table 28 Middle East and Africa Pan Masala Revenue (USD Million) By Region (2018-2022)
Table 29 Middle East and Africa Pan Masala Revenue (USD Million) By Type (2018-2022)
Table 30 Middle East and Africa Pan Masala Revenue (USD Million) By Applications (2018-2022)
Table 31 Financial Analysis
Table 32 Global Pan Masala Revenue (USD Million) By Type (2023-2030)
Table 33 Global Pan Masala Revenue Market Share (%) By Type (2023-2030)
Table 34 Global Pan Masala Revenue (USD Million) By Applications (2023-2030)
Table 35 Global Pan Masala Revenue Market Share (%) By Applications (2023-2030)
Table 36 Global Pan Masala Market Revenue (USD Million), And Revenue (USD Million) By Regions (2023-2030)
Table 37 North America Pan Masala Revenue (USD)By Country (2023-2030)
Table 38 North America Pan Masala Revenue (USD Million) By Type (2023-2030)
Table 39 North America Pan Masala Revenue (USD Million) By Applications (2023-2030)
Table 40 Europe Pan Masala Revenue (USD Million) By Country (2023-2030)
Table 41 Europe Pan Masala Revenue (USD Million) By Type (2023-2030)
Table 42 Europe Pan Masala Revenue (USD Million) By Applications (2023-2030)
Table 43 Asia Pacific Pan Masala Revenue (USD Million) By Country (2023-2030)
Table 44 Asia Pacific Pan Masala Revenue (USD Million) By Type (2023-2030)
Table 45 Asia Pacific Pan Masala Revenue (USD Million) By Applications (2023-2030)
Table 46 South America Pan Masala Revenue (USD Million) By Country (2023-2030)
Table 47 South America Pan Masala Revenue (USD Million) By Type (2023-2030)
Table 48 South America Pan Masala Revenue (USD Million) By Applications (2023-2030)
Table 49 Middle East and Africa Pan Masala Revenue (USD Million) By Region (2023-2030)
Table 50 Middle East and Africa Pan Masala Revenue (USD Million) By Region (2023-2030)
Table 51 Middle East and Africa Pan Masala Revenue (USD Million) By Type (2023-2030)
Table 52 Middle East and Africa Pan Masala Revenue (USD Million) By Applications (2023-2030)
Table 53 Research Programs/Design for This Report
Table 54 Key Data Information from Secondary Sources
Table 55 Key Data Information from Primary Sources
List of Figures
Figure 1 Market Scope
Figure 2 Porter’s Five Forces
Figure 3 Global Pan Masala Revenue (USD Million) By Type (2018-2022)
Figure 4 Global Pan Masala Revenue Market Share (%) By Type (2022)
Figure 5 Global Pan Masala Revenue (USD Million) By Applications (2018-2022)
Figure 6 Global Pan Masala Revenue Market Share (%) By Applications (2022)
Figure 7 Global Pan Masala Market Revenue (USD Million) By Regions (2018-2022)
Figure 8 Global Pan Masala Market Share (%) By Regions (2022)
Figure 9 North America Pan Masala Revenue (USD Million) By Country (2018-2022)
Figure 10 North America Pan Masala Revenue (USD Million) By Type (2018-2022)
Figure 11 North America Pan Masala Revenue (USD Million) By Applications (2018-2022)
Figure 12 Europe Pan Masala Revenue (USD Million) By Country (2018-2022)
Figure 13 Europe Pan Masala Revenue (USD Million) By Type (2018-2022)
Figure 14 Europe Pan Masala Revenue (USD Million) By Applications (2018-2022)
Figure 15 Asia Pacific Pan Masala Revenue (USD Million) By Country (2018-2022)
Figure 16 Asia Pacific Pan Masala Revenue (USD Million) By Type (2018-2022)
Figure 17 Asia Pacific Pan Masala Revenue (USD Million) By Applications (2018-2022)
Figure 18 South America Pan Masala Revenue (USD Million) By Country (2018-2022)
Figure 19 South America Pan Masala Revenue (USD Million) By Type (2018-2022)
Figure 20 South America Pan Masala Revenue (USD Million) By Applications (2018-2022)
Figure 21 Middle East and Africa Pan Masala Revenue (USD Million) By Region (2018-2022)
Figure 22 Middle East and Africa Pan Masala Revenue (USD Million) By Type (2018-2022)
Figure 23 Middle East and Africa Pan Masala Revenue (USD Million) By Applications (2018-2022)
Figure 24 Global Pan Masala Revenue (USD Million) By Type (2023-2030)
Figure 25 Global Pan Masala Revenue Market Share (%) By Type (2030)
Figure 26 Global Pan Masala Revenue (USD Million) By Applications (2023-2030)
Figure 27 Global Pan Masala Revenue Market Share (%) By Applications (2030)
Figure 28 Global Pan Masala Market Revenue (USD Million) By Regions (2023-2030)
Figure 29 North America Pan Masala Revenue (USD Million) By Country (2023-2030)
Figure 30 North America Pan Masala Revenue (USD Million) By Type (2023-2030)
Figure 31 North America Pan Masala Revenue (USD Million) By Applications (2023-2030)
Figure 32 Europe Pan Masala Revenue (USD Million) By Country (2023-2030)
Figure 33 Europe Pan Masala Revenue (USD Million) By Type (2023-2030)
Figure 34 Europe Pan Masala Revenue (USD Million) By Applications (2023-2030)
Figure 35 Asia Pacific Pan Masala Revenue (USD Million) By Country (2023-2030)
Figure 36 Asia Pacific Pan Masala Revenue (USD Million) By Type (2023-2030)
Figure 37 Asia Pacific Pan Masala Revenue (USD Million) By Applications (2023-2030)
Figure 38 South America Pan Masala Revenue (USD Million) By Country (2023-2030)
Figure 39 South America Pan Masala Revenue (USD Million) By Type (2023-2030)
Figure 40 South America Pan Masala Revenue (USD Million) By Applications (2023-2030)
Figure 41 Middle East and Africa Pan Masala Revenue (USD Million) By Region (2023-2030)
Figure 42 Middle East and Africa Pan Masala Revenue (USD Million) By Region (2023-2030)
Figure 43 Middle East and Africa Pan Masala Revenue (USD Million) By Type (2023-2030)
Figure 44 Middle East and Africa Pan Masala Revenue (USD Million) By Applications (2023-2030)
Figure 45 Bottom-Up and Top-Down Approaches for This Report
Figure 46 Data Triangulation
