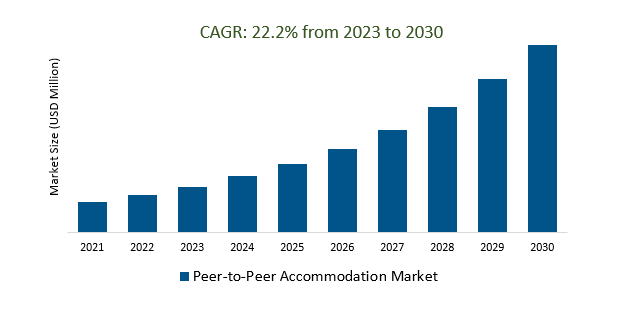
The Global Peer-to-Peer Accommodation Market Size is estimated to register 22.2% growth over the forecast period from 2023 to 2030.
An increasing drive for the market growth integration of new technologies like AI, IoT, and blockchain into P2P platforms has improved the user experience, security, and efficiency of booking and staying in P2P accommodations. Leading Companies focusing on Global Expansion, Integration of New Technologies, Hybrid Accommodation Models, Long-Term Rentals, Regulatory Adaptation, Niche Markets, User-Generated Content, Social Engagement, Health and Safety Protocols, and others to boost market shares in the industry.
Market Overview
The Peer-to-Peer (P2P) Accommodation Market, led by platforms like Airbnb and Vrbo, offers a variety of accommodations, from private rooms to unique lodging experiences, providing travelers with local, authentic, and often budget-friendly options. However, it faces regulatory challenges, relies heavily on user reviews, and prioritizes security and verification measures. Despite these challenges, it continues to expand globally, adapting to emerging trends like long-term rentals and niche markets, while offering travelers diverse and affordable lodging choices.
Market Dynamics
Market Trends- The peer-to-peer accommodation market is booming, driven by its affordability compared to traditional hotels.
The Peer-to-Peer Accommodation Market's remarkable growth is driven by its affordability compared to traditional hotels. P2P platforms like Airbnb and Vrbo have disrupted the hospitality industry by providing budget-conscious travelers with a wide range of cost-effective lodging options, including private homes and unique accommodations. Many P2P accommodations also offer kitchen facilities, reducing dining expenses. This affordability has broadened travel accessibility, allocating more budget for experiences, and contributing to the market's continuous expansion and success.
Market Driver- The growing popularity of workstations and remote work is driving the demand for peer-to-peer accommodation, as people seek flexible and affordable living arrangements that allow them to work and travel remotely.
The growing popularity of workstations and remote work is driving demand in the Peer-to-Peer Accommodation Market, with platforms like Airbnb and Vrbo offering a diverse range of accommodations well-suited for remote work. These options provide features such as high-speed internet and dedicated workspaces, appealing to individuals seeking flexible and affordable living arrangements that enable work and travel. This trend not only benefits remote workers but also presents an opportunity for hosts to market their properties to this niche, contributing to the market's continued growth and diversification.
Market Opportunity- The integration of peer-to-peer accommodation platforms with the travel ecosystem is making it easier for travelers to book and manage their entire trip in one place.
Integration of peer-to-peer accommodation platforms with the broader travel ecosystem is simplifying the travel experience, enabling travelers to book and manage their entire trip in one place. Platforms like Airbnb and Vrbo are expanding their services to encompass flights, car rentals, and local activities, creating a seamless travel planning process and enhancing user convenience. This integration not only improves the overall user experience but also strengthens the position of P2P platforms as comprehensive travel hubs, driving user loyalty and contributing to their continued growth within the travel industry.
Market Share Analysis- Apartments Peer-to-Peer Accommodation Market will register the fastest growth
The Global Peer-to-Peer Accommodation Market is analyzed across Houses, Villas, Apartments, and others. Apartments are poised to register the fastest growth. The "Apartments Peer-to-Peer Accommodation Market" is a segment within the broader P2P accommodation market, focusing on short-term apartment rentals offered by individual hosts on platforms like Airbnb. It caters to travelers seeking the convenience and comfort of apartment living, providing diverse options in terms of size, location, and amenities. This market segment is known for its affordability, offering a more localized and home-like experience during travel, and is characterized by a straightforward booking process.
Market Share Analysis- Business Travellers held a significant market share in 2023
The Global Peer-to-Peer Accommodation Market is analyzed across various applications Tourists, Business Travellers, and others. Of these, Business Travellers held a significant market share in 2023. The "Business Travelers Peer-to-Peer Accommodation Market" is a segment within the P2P accommodation market that caters to business travelers by providing work-friendly accommodations such as apartments with workspaces and high-speed internet. It recognizes the trend of blending business and leisure travel and aims to offer professionals a comfortable and cost-effective home-away-from-home experience with the flexibility to mix work and leisure during their stays.
Peer-to-Peer Accommodation Market Segmentation
By Type
- Houses
- Villas
- Apartments
- Others
By Application
- Tourist
- Business Travellers
- Others
By Price Range
By Duration
- Short-Term Rental
- Long-Term Rental
By Region
- North America (United States, Canada, Mexico)
- Europe (Germany, France, United Kingdom, Spain, Italy, Others)
- Asia Pacific (China, India, Japan, South Korea, Australia, Others)
- Latin America (Brazil, Argentina, Others)
- Middle East and Africa (Saudi Arabia, UAE, Kuwait, Other Middle East, South Africa, Nigeria, Other Africa)
Peer-to-Peer Accommodation Market Companies
- Vrbo (United States)
- Agoda Homes (Singapore)
- Airbnb (United States)
- Booking.com (Netherlands)
- FlipKey (United States)
- OneFineStay (United Kingdom)
- 9flats (Germany)
- Homestay (United Kingdom)
- Wimdu (Germany)
- Tujia (China)
- Roomorama (United States)
- Misterbnb (France)
- Tripping.com (United States)
- Holidu (Germany)
*List not exhaustive
Peer-to-Peer Accommodation Market Outlook 2023
1 Market Overview
1.1 Introduction to the Peer-to-Peer Accommodation Market
1.2 Scope of the Study
1.3 Research Objective
1.3.1 Key Market Scope and Segments
1.3.2 Players Covered
1.3.3 Years Considered
2 Executive Summary
2.1 2023 Peer-to-Peer Accommodation Industry- Market Statistics
3 Market Dynamics
3.1 Market Drivers
3.2 Market Challenges
3.3 Market Opportunities
3.4 Market Trends
4 Market Factor Analysis
4.1 Porter’s Five Forces
4.2 Market Entropy
4.2.1 Global Peer-to-Peer Accommodation Market Companies with Area Served
4.2.2 Products Offerings Global Peer-to-Peer Accommodation Market
5 COVID-19 Impact Analysis and Outlook Scenarios
5.1.1 Covid-19 Impact Analysis
5.1.2 Post-COVID-19 Scenario- Low Growth Case
5.1.3 Post-COVID-19 Scenario- Reference Growth Case
5.1.4 Post-COVID-19 Scenario- Low Growth Case
6 Global Peer-to-Peer Accommodation Market Trends
6.1 Global Peer-to-Peer Accommodation Revenue (USD Million) and CAGR (%) by Type (2018-2030)
6.2 Global Peer-to-Peer Accommodation Revenue (USD Million) and CAGR (%) by Applications (2018-2030)
6.3 Global Peer-to-Peer Accommodation Revenue (USD Million) and CAGR (%) by Regions (2018-2030)
7 Global Peer-to-Peer Accommodation Market Revenue (USD Million) by Type, and Applications (2018-2022)
7.1 Global Peer-to-Peer Accommodation Revenue (USD Million) by Type (2018-2022)
7.1.1 Global Peer-to-Peer Accommodation Revenue (USD Million), Market Share (%) by Type (2018-2022)
7.2 Global Peer-to-Peer Accommodation Revenue (USD Million) by Applications (2018-2022)
7.2.1 Global Peer-to-Peer Accommodation Revenue (USD Million), Market Share (%) by Applications (2018-2022)
8 Global Peer-to-Peer Accommodation Development Regional Status and Outlook
8.1 Global Peer-to-Peer Accommodation Revenue (USD Million) By Regions (2018-2022)
8.2 North America Peer-to-Peer Accommodation Revenue (USD Million) by Type, and Application (2018-2022)
8.2.1 North America Peer-to-Peer Accommodation Revenue (USD Million) by Country (2018-2022)
8.2.2 North America Peer-to-Peer Accommodation Revenue (USD Million) by Type (2018-2022)
8.2.3 North America Peer-to-Peer Accommodation Revenue (USD Million) by Applications (2018-2022)
8.3 Europe Peer-to-Peer Accommodation Revenue (USD Million), by Type, and Applications (USD Million) (2018-2022)
8.3.1 Europe Peer-to-Peer Accommodation Revenue (USD Million), by Country (2018-2022)
8.3.2 Europe Peer-to-Peer Accommodation Revenue (USD Million) by Type (2018-2022)
8.3.3 Europe Peer-to-Peer Accommodation Revenue (USD Million) by Applications (2018-2022)
8.4 Asia Pacific Peer-to-Peer Accommodation Revenue (USD Million), and Revenue (USD Million) by Type, and Applications (2018-2022)
8.4.1 Asia Pacific Peer-to-Peer Accommodation Revenue (USD Million) by Country (2018-2022)
8.4.2 Asia Pacific Peer-to-Peer Accommodation Revenue (USD Million) by Type (2018-2022)
8.4.3 Asia Pacific Peer-to-Peer Accommodation Revenue (USD Million) by Applications (2018-2022)
8.5 South America Peer-to-Peer Accommodation Revenue (USD Million), by Type, and Applications (2018-2022)
8.5.1 South America Peer-to-Peer Accommodation Revenue (USD Million), by Country (2018-2022)
8.5.2 South America Peer-to-Peer Accommodation Revenue (USD Million) by Type (2018-2022)
8.5.3 South America Peer-to-Peer Accommodation Revenue (USD Million) by Applications (2018-2022)
8.6 Middle East and Africa Peer-to-Peer Accommodation Revenue (USD Million), by Type, Technology, Application, Thickness (2018-2022)
8.6.1 Middle East and Africa Peer-to-Peer Accommodation Revenue (USD Million) by Country (2018-2022)
8.6.2 Middle East and Africa Peer-to-Peer Accommodation Revenue (USD Million) by Type (2018-2022)
8.6.3 Middle East and Africa Peer-to-Peer Accommodation Revenue (USD Million) by Applications (2018-2022)
9 Company Profiles
10 Global Peer-to-Peer Accommodation Market Revenue (USD Million), by Type, and Applications (2023-2030)
10.1 Global Peer-to-Peer Accommodation Revenue (USD Million) and Market Share (%) by Type (2023-2030)
10.1.1 Global Peer-to-Peer Accommodation Revenue (USD Million), and Market Share (%) by Type (2023-2030)
10.2 Global Peer-to-Peer Accommodation Revenue (USD Million) and Market Share (%) by Applications (2023-2030)
10.2.1 Global Peer-to-Peer Accommodation Revenue (USD Million), and Market Share (%) by Applications (2023-2030)
11 Global Peer-to-Peer Accommodation Development Regional Status and Outlook Forecast
11.1 Global Peer-to-Peer Accommodation Revenue (USD Million) By Regions (2023-2030)
11.2 North America Peer-to-Peer Accommodation Revenue (USD Million) by Type, and Applications (2023-2030)
11.2.1 North America Peer-to-Peer Accommodation Revenue (USD) Million by Country (2023-2030)
11.2.2 North America Peer-to-Peer Accommodation Revenue (USD Million), by Type (2023-2030)
11.2.3 North America Peer-to-Peer Accommodation Revenue (USD Million), Market Share (%) by Applications (2023-2030)
11.3 Europe Peer-to-Peer Accommodation Revenue (USD Million), by Type, and Applications (2023-2030)
11.3.1 Europe Peer-to-Peer Accommodation Revenue (USD Million), by Country (2023-2030)
11.3.2 Europe Peer-to-Peer Accommodation Revenue (USD Million), by Type (2023-2030)
11.3.3 Europe Peer-to-Peer Accommodation Revenue (USD Million), by Applications (2023-2030)
11.4 Asia Pacific Peer-to-Peer Accommodation Revenue (USD Million) by Type, and Applications (2023-2030)
11.4.1 Asia Pacific Peer-to-Peer Accommodation Revenue (USD Million), by Country (2023-2030)
11.4.2 Asia Pacific Peer-to-Peer Accommodation Revenue (USD Million), by Type (2023-2030)
11.4.3 Asia Pacific Peer-to-Peer Accommodation Revenue (USD Million), by Applications (2023-2030)
11.5 South America Peer-to-Peer Accommodation Revenue (USD Million), by Type, and Applications (2023-2030)
11.5.1 South America Peer-to-Peer Accommodation Revenue (USD Million), by Country (2023-2030)
11.5.2 South America Peer-to-Peer Accommodation Revenue (USD Million), by Type (2023-2030)
11.5.3 South America Peer-to-Peer Accommodation Revenue (USD Million), by Applications (2023-2030)
11.6 Middle East and Africa Peer-to-Peer Accommodation Revenue (USD Million), by Type, and Applications (2023-2030)
11.6.1 Middle East and Africa Peer-to-Peer Accommodation Revenue (USD Million), by Region (2023-2030)
11.6.2 Middle East and Africa Peer-to-Peer Accommodation Revenue (USD Million), by Type (2023-2030)
11.6.3 Middle East and Africa Peer-to-Peer Accommodation Revenue (USD Million), by Applications (2023-2030)
12 Methodology and Data Sources
12.1 Methodology/Research Approach
12.1.1 Research Programs/Design
12.1.2 Market Size Estimation
12.1.3 Market Breakdown and Data Triangulation
12.2 Data Sources
12.2.1 Secondary Sources
12.2.2 Primary Sources
12.3 Disclaimer
List of Tables
Table 1 Market Segmentation Analysis
Table 2 Global Peer-to-Peer Accommodation Market Companies with Areas Served
Table 3 Products Offerings Global Peer-to-Peer Accommodation Market
Table 4 Low Growth Scenario Forecasts
Table 5 Reference Case Growth Scenario
Table 6 High Growth Case Scenario
Table 7 Global Peer-to-Peer Accommodation Revenue (USD Million) And CAGR (%) By Type (2018-2030)
Table 8 Global Peer-to-Peer Accommodation Revenue (USD Million) And CAGR (%) By Applications (2018-2030)
Table 9 Global Peer-to-Peer Accommodation Revenue (USD Million) And CAGR (%) By Regions (2018-2030)
Table 10 Global Peer-to-Peer Accommodation Revenue (USD Million) By Type (2018-2022)
Table 11 Global Peer-to-Peer Accommodation Revenue Market Share (%) By Type (2018-2022)
Table 12 Global Peer-to-Peer Accommodation Revenue (USD Million) By Applications (2018-2022)
Table 13 Global Peer-to-Peer Accommodation Revenue Market Share (%) By Applications (2018-2022)
Table 14 Global Peer-to-Peer Accommodation Market Revenue (USD Million) By Regions (2018-2022)
Table 15 Global Peer-to-Peer Accommodation Market Share (%) By Regions (2018-2022)
Table 16 North America Peer-to-Peer Accommodation Revenue (USD Million) By Country (2018-2022)
Table 17 North America Peer-to-Peer Accommodation Revenue (USD Million) By Type (2018-2022)
Table 18 North America Peer-to-Peer Accommodation Revenue (USD Million) By Applications (2018-2022)
Table 19 Europe Peer-to-Peer Accommodation Revenue (USD Million) By Country (2018-2022)
Table 20 Europe Peer-to-Peer Accommodation Revenue (USD Million) By Type (2018-2022)
Table 21 Europe Peer-to-Peer Accommodation Revenue (USD Million) By Applications (2018-2022)
Table 22 Asia Pacific Peer-to-Peer Accommodation Revenue (USD Million) By Country (2018-2022)
Table 23 Asia Pacific Peer-to-Peer Accommodation Revenue (USD Million) By Type (2018-2022)
Table 24 Asia Pacific Peer-to-Peer Accommodation Revenue (USD Million) By Applications (2018-2022)
Table 25 South America Peer-to-Peer Accommodation Revenue (USD Million) By Country (2018-2022)
Table 26 South America Peer-to-Peer Accommodation Revenue (USD Million) By Type (2018-2022)
Table 27 South America Peer-to-Peer Accommodation Revenue (USD Million) By Applications (2018-2022)
Table 28 Middle East and Africa Peer-to-Peer Accommodation Revenue (USD Million) By Region (2018-2022)
Table 29 Middle East and Africa Peer-to-Peer Accommodation Revenue (USD Million) By Type (2018-2022)
Table 30 Middle East and Africa Peer-to-Peer Accommodation Revenue (USD Million) By Applications (2018-2022)
Table 31 Financial Analysis
Table 32 Global Peer-to-Peer Accommodation Revenue (USD Million) By Type (2023-2030)
Table 33 Global Peer-to-Peer Accommodation Revenue Market Share (%) By Type (2023-2030)
Table 34 Global Peer-to-Peer Accommodation Revenue (USD Million) By Applications (2023-2030)
Table 35 Global Peer-to-Peer Accommodation Revenue Market Share (%) By Applications (2023-2030)
Table 36 Global Peer-to-Peer Accommodation Market Revenue (USD Million), And Revenue (USD Million) By Regions (2023-2030)
Table 37 North America Peer-to-Peer Accommodation Revenue (USD)By Country (2023-2030)
Table 38 North America Peer-to-Peer Accommodation Revenue (USD Million) By Type (2023-2030)
Table 39 North America Peer-to-Peer Accommodation Revenue (USD Million) By Applications (2023-2030)
Table 40 Europe Peer-to-Peer Accommodation Revenue (USD Million) By Country (2023-2030)
Table 41 Europe Peer-to-Peer Accommodation Revenue (USD Million) By Type (2023-2030)
Table 42 Europe Peer-to-Peer Accommodation Revenue (USD Million) By Applications (2023-2030)
Table 43 Asia Pacific Peer-to-Peer Accommodation Revenue (USD Million) By Country (2023-2030)
Table 44 Asia Pacific Peer-to-Peer Accommodation Revenue (USD Million) By Type (2023-2030)
Table 45 Asia Pacific Peer-to-Peer Accommodation Revenue (USD Million) By Applications (2023-2030)
Table 46 South America Peer-to-Peer Accommodation Revenue (USD Million) By Country (2023-2030)
Table 47 South America Peer-to-Peer Accommodation Revenue (USD Million) By Type (2023-2030)
Table 48 South America Peer-to-Peer Accommodation Revenue (USD Million) By Applications (2023-2030)
Table 49 Middle East and Africa Peer-to-Peer Accommodation Revenue (USD Million) By Region (2023-2030)
Table 50 Middle East and Africa Peer-to-Peer Accommodation Revenue (USD Million) By Region (2023-2030)
Table 51 Middle East and Africa Peer-to-Peer Accommodation Revenue (USD Million) By Type (2023-2030)
Table 52 Middle East and Africa Peer-to-Peer Accommodation Revenue (USD Million) By Applications (2023-2030)
Table 53 Research Programs/Design for This Report
Table 54 Key Data Information from Secondary Sources
Table 55 Key Data Information from Primary Sources
List of Figures
Figure 1 Market Scope
Figure 2 Porter’s Five Forces
Figure 3 Global Peer-to-Peer Accommodation Revenue (USD Million) By Type (2018-2022)
Figure 4 Global Peer-to-Peer Accommodation Revenue Market Share (%) By Type (2022)
Figure 5 Global Peer-to-Peer Accommodation Revenue (USD Million) By Applications (2018-2022)
Figure 6 Global Peer-to-Peer Accommodation Revenue Market Share (%) By Applications (2022)
Figure 7 Global Peer-to-Peer Accommodation Market Revenue (USD Million) By Regions (2018-2022)
Figure 8 Global Peer-to-Peer Accommodation Market Share (%) By Regions (2022)
Figure 9 North America Peer-to-Peer Accommodation Revenue (USD Million) By Country (2018-2022)
Figure 10 North America Peer-to-Peer Accommodation Revenue (USD Million) By Type (2018-2022)
Figure 11 North America Peer-to-Peer Accommodation Revenue (USD Million) By Applications (2018-2022)
Figure 12 Europe Peer-to-Peer Accommodation Revenue (USD Million) By Country (2018-2022)
Figure 13 Europe Peer-to-Peer Accommodation Revenue (USD Million) By Type (2018-2022)
Figure 14 Europe Peer-to-Peer Accommodation Revenue (USD Million) By Applications (2018-2022)
Figure 15 Asia Pacific Peer-to-Peer Accommodation Revenue (USD Million) By Country (2018-2022)
Figure 16 Asia Pacific Peer-to-Peer Accommodation Revenue (USD Million) By Type (2018-2022)
Figure 17 Asia Pacific Peer-to-Peer Accommodation Revenue (USD Million) By Applications (2018-2022)
Figure 18 South America Peer-to-Peer Accommodation Revenue (USD Million) By Country (2018-2022)
Figure 19 South America Peer-to-Peer Accommodation Revenue (USD Million) By Type (2018-2022)
Figure 20 South America Peer-to-Peer Accommodation Revenue (USD Million) By Applications (2018-2022)
Figure 21 Middle East and Africa Peer-to-Peer Accommodation Revenue (USD Million) By Region (2018-2022)
Figure 22 Middle East and Africa Peer-to-Peer Accommodation Revenue (USD Million) By Type (2018-2022)
Figure 23 Middle East and Africa Peer-to-Peer Accommodation Revenue (USD Million) By Applications (2018-2022)
Figure 24 Global Peer-to-Peer Accommodation Revenue (USD Million) By Type (2023-2030)
Figure 25 Global Peer-to-Peer Accommodation Revenue Market Share (%) By Type (2030)
Figure 26 Global Peer-to-Peer Accommodation Revenue (USD Million) By Applications (2023-2030)
Figure 27 Global Peer-to-Peer Accommodation Revenue Market Share (%) By Applications (2030)
Figure 28 Global Peer-to-Peer Accommodation Market Revenue (USD Million) By Regions (2023-2030)
Figure 29 North America Peer-to-Peer Accommodation Revenue (USD Million) By Country (2023-2030)
Figure 30 North America Peer-to-Peer Accommodation Revenue (USD Million) By Type (2023-2030)
Figure 31 North America Peer-to-Peer Accommodation Revenue (USD Million) By Applications (2023-2030)
Figure 32 Europe Peer-to-Peer Accommodation Revenue (USD Million) By Country (2023-2030)
Figure 33 Europe Peer-to-Peer Accommodation Revenue (USD Million) By Type (2023-2030)
Figure 34 Europe Peer-to-Peer Accommodation Revenue (USD Million) By Applications (2023-2030)
Figure 35 Asia Pacific Peer-to-Peer Accommodation Revenue (USD Million) By Country (2023-2030)
Figure 36 Asia Pacific Peer-to-Peer Accommodation Revenue (USD Million) By Type (2023-2030)
Figure 37 Asia Pacific Peer-to-Peer Accommodation Revenue (USD Million) By Applications (2023-2030)
Figure 38 South America Peer-to-Peer Accommodation Revenue (USD Million) By Country (2023-2030)
Figure 39 South America Peer-to-Peer Accommodation Revenue (USD Million) By Type (2023-2030)
Figure 40 South America Peer-to-Peer Accommodation Revenue (USD Million) By Applications (2023-2030)
Figure 41 Middle East and Africa Peer-to-Peer Accommodation Revenue (USD Million) By Region (2023-2030)
Figure 42 Middle East and Africa Peer-to-Peer Accommodation Revenue (USD Million) By Region (2023-2030)
Figure 43 Middle East and Africa Peer-to-Peer Accommodation Revenue (USD Million) By Type (2023-2030)
Figure 44 Middle East and Africa Peer-to-Peer Accommodation Revenue (USD Million) By Applications (2023-2030)
Figure 45 Bottom-Up and Top-Down Approaches For This Report
Figure 46 Data Triangulation
