Point-of-Entry Water Treatment Systems Market Size, Growth Trends, and Key Insights
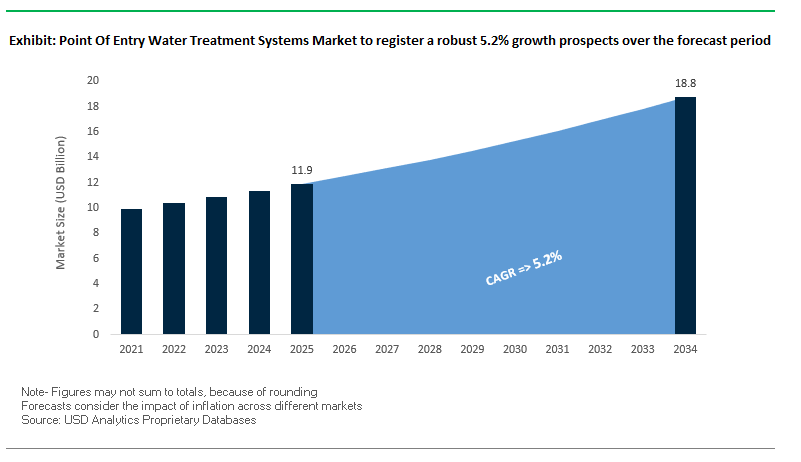
Point-of-Entry (POE) Water Treatment Systems market will be increasing from USD 11.9 billion in 2025 to USD 18.8 billion in 2034 at a growth rate of 5.2%. The continued growth is due to increasing interest among consumers about whole-house water quality, new innovation in smart water filtration technology, and greater penetration of multi-stage treatment products across a broad range of contaminants.
POE systems continue to displace older point-of-use units as families and companies seek broader-based water treatment solutions that provide pure water at every faucet. Adoption is especially widespread in locations experiencing difficulties with hard water concerns, demand for integrated water softeners is on the rise, and locations where cities come under increasing criticism regarding chlorine, lead, microbial, and chemical contaminants.
Key Insights Driving Market Growth:
- Rising Whole-House Water Quality Awareness – Over 45% of households globally are concerned about chlorine, lead, and bacterial contamination, driving the shift toward POE solutions.
- Growing Demand for Water Softening – 28% of POE systems sold now include water softeners to combat scale buildup, especially in hard-water regions.
- Smart Technology Integration – 18% of market players have launched connected POE systems with real-time monitoring and maintenance alerts.
- Shift to Multi-Stage Filtration – More than 25% of urban residents choose POE systems that remove chlorine, heavy metals, and sediment in a single, high-performance unit.
Market Analysis: Technological Advancements, Strategic Moves, and Global Expansion
Global POE water treatment systems market is experiencing fast-paced innovation, strategic purchases, and technology crossover between different sectors. In February 2025, GE Appliances introduced the GE Profile Smart Water Valve with Integrated Filtration, integrating whole-house filtration and leak detection features and remote shutoff, highlighted the shift toward smarthome-compatible water treatment. Previously, in April 2025, Pentair won the Kitchen Innovations Award for its Everpure PFAS Reduction Systems, validating the trend within the market to eliminate "forever chemicals" in household waters.
Corporate expansions and acquisitions are also shaping the competitive environment. Culligan’s January 2024 acquisition of Primo Water’s EMEA operations strengthened its footprint across 12 countries and expanded into Poland, Lithuania, Latvia, and Estonia. Similarly, A. O. Smith reported 19% organic growth in its India water treatment segment in July 2025, supported by the opening of a new product development center in April 2025, which is set to accelerate innovation in water filtration and softening technologies.
With environmental responsibility becoming a concurrent engine of competitive advantage, May 2024's $1 billion two-decade sustainability investment by 3M supports increasing preference among consumers for environmentally friendly solutions. With Culligan's May 2025 AI-based "Cullie" WaterBot enabling customers to detect and resolve water concerns and choose optimal POE solutions, a new era in customer service emerges for the industry. While Honeywell does a portfolio review in July 2025 that will further target automation, this could further enhance its penetration in commercial and industrial applications of POE.
Trends and Opportunities in Point of Entry Water Treatment Systems Market
Trend 1: Smart Whole-House Filtration with IoT Integration
The Point of Entry (POE) water treatment systems market is undergoing rapid development in direction towards smarter, connected solutions that incorporate Internet of Things (IoT) technology. Homeowners now seek systems that can provide real-time monitoring of water quality, predictive maintenance, and remote control, while enhancing not only convenience but a constant guarantee of safe water. State-of-the-art POE systems now pair advanced sensors that monitor parameters like pH level, turbidity, total dissolved solids (TDS), and residual chlorine levels and send this information to mobile applications for immediate feedback. Some systems will alert users automatically if performance levels fall below optimum levels or if replacement of filters is due, facilitating proactive maintenance that ensures system downtime and unlimited access to safe water is prevented. Compatibility within wider smart home ecosystems, including Amazon Alexa and Google Home compatibility, permits voice control, distant control, and effortless monitoring and positions such systems squarely within technologically sophisticated residences. Markets statistics suggest that smart-enabled POE systems are experiencing growth rates above 12% yearly within North America and Europe and reflect a trend that shows a growing preference among consumers regarding a preference for connected, data-driven water treatment technology.
Trend 2: Multi-Contaminant Removal for PFAS & Heavy Metals
Growing regulatory mandates and public health interests are compelling demand for POE systems capable of treating a broad spectrum of contaminants such as PFAS, lead, arsenic, and other heavy metals. Legally enforceable limits have been set by the U.S. Environmental Protection Agency (EPA) on six PFAS compounds; granular activated carbon (GAC) and anion exchange have been determined to be among the "Best Available Technologies" along with reverse osmosis (RO) and nanofiltration to achieve compliance. Multi-barrier POE systems employing RO, GAC, and other specialty filtration media have been shown to achieve near-total removal of these contaminants supported both by scientific studies and EPA treatability research. Growing awareness among consumers about the dangers to waters quality has further been fueled by media reports about system-wide lead contamination and widespread occurrence of """forever chemicals,"" pushing demand further in favour of such systems especially among single-family residences and multi-family apartments. Regulatory enforcement coupled with awareness-driven consumption behaviour will continue to keep annual growth rates at about 10–15% in developed regions while new economies continue to adopt such systems at a faster clip due to growing concerns about water quality.
Opportunity 1: Drought-Driven Adoption in Water-Scarce Regions
Water shortage and deteriorating groundwater quality are generating large growth prospects for POE systems in arid places. Research in India and some states in the United States' west emphasizes that while declining water tables cause rising concentrations of geogenic contaminants such as fluoride, arsenic, and nitrates, these become associated with increased health risks. Consequently, residential homeowners and small communities increasingly invest in POE systems to provide assured access to safe drinking water, diminish reliance on stressed municipal supplies, and provide household protection against diseases. It has been stressed in the United States' National Institute of Disaster Management's approach that decentralized water solutions can help improve resilience against drought and climate-driven water shortages. POE systems fit within this approach since they ensure supply at the point of entry with purified water while enabling household quality control even during extreme water stress situations. Adoption in places facing chronic water shortage has been projected to remain a growth area at a 14% CAGR during a period ahead, a projection mirroring both water security urgency and climate change impact awareness.
Opportunity 2: Commercial and Industrial Small-Scale POE Systems
Small to medium-sized business and industrial firms invest in POE water treatment technology to reduce bottling water dependency, achieve sustainability targets, and promote employee wellness. Businesses pay dearly buying, transporting, and handling bottled water and also experience mounting pressure to achieve ESG compliance. By implementing small-scale POE systems, firms can save on operational costs, eliminate plastic waste, and reduce carbon footprint while advancing circular economy initiatives. By providing high-quality, pure water to promote employee health and productivity, such investments yield returns. Commercial application of POE systems is increasing in double-digit percentages, primarily across hotel/motel facilities, healthcare centers, and office buildings where corporate sustainability targets and customer demands converge to influence purchasing decisions about trusted, high-capacity water treatment technology.
Point-of-Entry Water Treatment Systems Market Share Insights
Dominance of Water Softeners in the POE Water Treatment Market
Water softeners command the largest share of the POE water treatment systems market at nearly 40%, solidifying their position as the most mature and widely adopted product type. Their dominance is rooted in the global prevalence of hard water and the proven benefits of ion exchange technology in protecting plumbing, extending appliance life, and improving overall water usability. High consumer awareness, especially in North America and Europe, drives steady replacement demand, while emerging markets in Asia-Pacific are fueling first-time adoption. The segment’s strength lies in its established trust factor and regulatory endorsements for addressing hardness-related infrastructure damage, making it a resilient and stable revenue stream within the broader water treatment industry.
 Water Treatment Systems Market By Technology (2025).png)
Rising Adoption of Whole House Filtration Systems
Whole house filtration systems account for around 30% of the POE water treatment market, emerging as the core growth driver after water softeners. These systems are equipped with sediment, activated carbon, or multi-media filters and are increasingly sought for their ability to remove chlorine, rust, and other contaminants from every water entry point in a home. Their market share is strengthened by rising consumer awareness of the health and aesthetic benefits of chlorine-free, odor-free water, particularly in urban households. Demand is also propelled by the trend toward upgrading household infrastructure to comprehensive protection solutions, a factor that positions The segment for consistent expansion as consumer expectations shift from single-problem treatment to holistic water quality management.
UV Disinfection Systems as the Fastest-Growing Segment
UV disinfection systems currently represent about 15% of the market, but their growth trajectory makes them the most dynamic segment. Unlike traditional chemical-based solutions, UV technology offers a chemical-free safeguard against bacteria, viruses, and other microorganisms, aligning perfectly with the global shift toward sustainable and eco-friendly water treatment practices. Adoption is particularly strong in rural and semi-urban regions where microbiological contamination of well water remains a major concern. However, as urban consumers increasingly demand an additional health-protection layer beyond softening and filtration, UV systems are penetrating mainstream markets as a complementary solution. The dual demand profile positions UV disinfection to disrupt the product hierarchy over the next five years.
Ion Exchange Technology Leading the Technology Landscape
From a technology perspective, ion exchange remains the dominant mechanism, underpinning nearly 40% of the total market. Its effectiveness in addressing hard water challenges has made it the backbone of the water softening category, with continued preference in regions facing chronic scaling issues such as the U.S., India, and parts of Europe. The stability of the share reflects both its maturity and the ongoing replacement cycle of salt-based systems, which continue to enjoy regulatory and consumer trust despite the emergence of alternative technologies. In the broader landscape of POE systems, ion exchange technology represents not just market leadership but also the critical foundation upon which other value-added solutions such as combination systems are layered.
Expanding Role of Filtration Media in Comprehensive POE Systems
Filtration media, including activated carbon, sediment, and KDF, make up roughly 35% of the technology share, reflecting their indispensable role in addressing a broad spectrum of contaminants. Activated carbon, in particular, is essential for chlorine and taste/odor removal, ensuring better-quality water across both residential and commercial applications. The rising trend toward multi-stage, whole-house filtration systems amplifies the relevance of the technology, as consumers and businesses alike seek a more comprehensive solution beyond softening. Its strong presence across diverse geographies and applications indicates that filtration media will remain the cornerstone of system upgrades, especially as municipalities face growing scrutiny over residual disinfectants and distribution line contaminants.
Residential Sector as the Prime Driver of POE System Adoption
The residential sector dominates end-user demand, accounting for nearly 65% of global installations. Homeowners increasingly view POE systems as an investment in both health and property value, with motivations ranging from extending the lifespan of household appliances to ensuring safer bathing and cleaning water. The segment’s strength is amplified by rising consumer preference for integrated solutions, where POE systems work in tandem with point-of-use (POU) filters for drinking water. Suburban expansion, higher disposable incomes, and a growing awareness of water quality risks in rapidly urbanizing regions all point to continued strength in residential adoption. The sector’s overwhelming share cements its role as the backbone of the POE market and the key target for product innovation and marketing strategies.
Commercial Applications Gaining Share Through Service Industry Growth
Commercial establishments, including hotels, restaurants, laundromats, and office complexes, contribute around 25% of the global POE water treatment market, making them a high-value but secondary segment. In these settings, consistent water quality is crucial for guest satisfaction, operational efficiency, and the protection of high-cost assets such as boilers and HVAC systems. The service industry’s rapid expansion in emerging economies, coupled with stricter quality control expectations in developed regions, is driving significant uptake. Unlike residential buyers, commercial customers prioritize durability, scalability, and total cost of ownership, factors that encourage adoption of advanced multi-stage filtration and UV disinfection technologies. The segment, while smaller than residential, represents a lucrative growth avenue for providers targeting long-term contracts and repeat service revenues.
Country Analysis of the Point of Entry (POE) Water Treatment Systems Market
United States: Infrastructure Investment and PFAS Contamination Drive POE Adoption
United States POE water treatment systems market is experiencing rapid growth due to federal efforts and growing awareness about household drinking water quality among consumers. The Bipartisan Infrastructure Law has invested over $50 billion in improving drinking water and treating wastewater systems, keeping a strong priority on responding to emerging contaminants such as PFAS and replacing lead service lines. New demand has been created nationwide for advanced whole-house water filtration systems due to efforts made by the United States Environmental Protection Agency (EPA) in pushing forward technologies to remove "forever chemicals." Pentair was honored with the 2025 Kitchen Innovations Award due to its Everpure PFOA/PFOS Reduction Systems and took home the 2025 Innovation Award given by Business Intelligence Group due to its sustainable and smart water solutions. Furthermore, 3M's $12.5 billion settlement to clean up PFAS contamination will facilitate nationwide testing on waters and technology enhancements, which will boost the segment on POE systems indirectly. Top companies like A.O. Smith have grown domestic sales operations due to purchases made in Atlantic Filter in Florida (2022) and Master Water Conditioning Corporation in Pennsylvania (2021) to further dominate positions in the market within whole-house water purification.
India: Jal Jeevan Mission and Regulatory Support Strengthen POE Market
India's market for POE water treatment systems is growing in the wake of governmental initiatives towards ensuring household water safe for use. Jal Jeevan Mission targets getting functional household tap connections to all rural households by 2028, and it emphasizes quality in supplied water. Regulatory initiatives such as Environment (Protection) 115 Amendment Rules, 2021 mandate all RO-based domestically produced or imported water treatment systems to bear the ISI Standard Mark under BIS licensing to assure quality compliance. A.O. Smith's Pureit brand acquisition has mainly contributed to sales growth in Q2 2025 by 19%, a sign of rising uptake in whole-house purification solutions. Government initiatives such as the Water Technology Initiative (WTI) facilitate research and development and demonstration of sustainable water solutions while state financing aid supports states' implementation efforts within infrastructures and technology interventions, facilitating uptake in household POE systems in both urban and rural parts.
China: Urbanization and Smart Technologies Boost Whole-House Solutions
China's POE water treatment systems market is fostered due to urbanization growth, increasing awareness about health, and rising concerns regarding municipal water quality, such as heavy metals and other impurities. Advanced whole-house water purification systems are becoming a preferred choice among consumers to provide safe drinking water across the residences. A.O. Smith declared in July 2025 a review of Chinese strategic opportunities in its business portfolio within water treatment and heating, including whole-house systems. The market is further experiencing vigorous technology innovation as companies create environmentally friendly, energy-efficient, and economical POE solutions. The use of smart technology and IoT in water treatment systems allows better monitoring and control in real time and offers increased convenience and better management of water quality to consumers.
Germany: Sustainability and Advanced Filtration Innovations
Germany’s POE water treatment systems market emphasizes sustainability, water conservation, and climate-resilient infrastructure. BWT AG is a market leader introducing its MACH filter range at ISH 2025, featuring patented rotary-pulse backwash (DIR) technology, optimizing drinking water hygiene with advanced filtration. The National Water Strategy addresses long-term water management challenges, driving adoption of whole-house treatment systems capable of maintaining high-quality water standards. Germany’s well-developed water infrastructure, coupled with modernization efforts and climate-focused policies, encourages the deployment of innovative POE solutions. BWT’s “One Pipe Power” innovation further enhances the residential water treatment experience, reflecting a market focus on smart, energy-efficient, and sustainable whole-house water purification technologies.
Japan: High-Tech R&D and Disaster-Preparedness Influence POE Systems
Japan’s POE water treatment systems market is characterized by advanced technological innovation, preventive healthcare culture, and high hygiene standards. WOTA Corp., a startup, developed a small-scale, portable water recycling system reclaiming over 98% of wastewater. Although a POU system, it reflects Japan’s focus on decentralized, self-sufficient water solutions that influence the adoption of POE systems. Kurita Water Industries’ partnership with ispace to transport a water purification demonstration system to the moon after 2027 highlights the country’s commitment to advanced water R&D. These initiatives drive innovations in whole-house systems capable of addressing both domestic and emergency water treatment requirements.
United Arab Emirates (UAE): Large-Scale Infrastructure Projects Stimulate POE Adoption
The UAE POE water treatment systems market is strongly influenced by significant investments in water infrastructure and desalination. The Taweelah Desalination Plant, with a capacity of 909,000 m³/day, represents one of the world’s largest water infrastructure projects and sets high water quality standards, stimulating demand for residential and commercial POE systems. Veolia’s engineering and technology supply for the Hassyan seawater desalination plant in Dubai further supports the growth of the POE market by ensuring advanced filtration at the household and industrial levels. These projects highlight the UAE’s commitment to high-quality water supply and create a robust market for point-of-entry water purification systems.
Competitive Landscape and Strategic Positioning of Key Players
The POE water treatment market is defined by established global brands with deep expertise in water quality solutions, strong dealer networks, and expanding portfolios that balance residential and commercial applications.
A. O. Smith: Expanding Smart and Efficient Whole-House Solutions
A. O. Smith is dedicated to the installation of high-performing POE systems supported by intelligent technology and vigorous customer education. It has a product line consisting of water softeners, sediment filters, and heavy-metal treatment units both suited for residential applications and light commercial applications. Its April 2025 opening of a new product development center will provide a boost to innovation in smart controls and energy-efficient filtration while solidifying a presence in fast-growing markets such as India.
Pentair: Driving Innovation in Sustainable Water Filtration
Pentair's strategy is built on smarter, sustainable water treatment solutions. Its product portfolio consists of whole-house filtration units, water softeners, and high-end well-water systems. Pentair's December 2024 acquisition of Porous Media gave it expanded state-of-the-art filtration capabilities and enabled it to deliver high-performing filter media across a variety of global POE applications.
3M: Leveraging Materials Science for Advanced Filtration
3M uses materials technology to engineer multi-layer filtration media that eliminate sediment, chlorine, and heavy metals in small but highly-effective configurations. Its I.M.P.A.C.T. filtration technology combines pre-activated carbon and membrane filtration to achieve high-end performance in residential POE applications. Its May 2024 announced $1 billion environmental investment is a testament to sustainability efforts both within manufacturing operations and product development.
Honeywell: Integrating Advanced Controls into POE Systems
Honeywell is interested in the automation and monitoring portion of POE water treatment that is used mostly in commercial and industrial applications. Its products consist of sensors for checking the quality of waters, intelligent control valves, and sophisticated software platforms. Through its July 2025 strategic portfolio review, Honeywell is positioning to further invest in building automation, cybersecurity, and water process control technology.
Culligan: Expanding Global Reach with Digital Customer Support
Culligan's range of high-efficiency softeners, chlorine and sediment filters, and select well-water applications is supported through a large network of dealers. Its January 2024 acquisition of Primo Water EMEA cemented it in Europe, and 2025 rollout of "Cullie" AI WaterBot shows dedication to digitization in customer servicing.
Point Of Entry Water Treatment Systems Market Report Scope
Point Of Entry Water Treatment Systems Market
|
Parameter
|
Details
|
|
Market Size (2025)
|
$11.9 Billion
|
|
Market Size (2034)
|
$18.8 Billion
|
|
Market Growth Rate
|
5.2%
|
|
Segments
|
By Product Type (Whole House Filtration Systems, Water Softeners, UV Disinfection Systems, Chemical Injection Systems, Combination Systems), By Technology (Water Softeners, Whole House Filters, UV Disinfection, Others), By End-User (Residential Sector, Commercial Sector, Industrial Sector)
|
|
Study Period
|
2019- 2024 and 2025-2034
|
|
Units
|
Revenue (USD)
|
|
Qualitative Analysis
|
Porter’s Five Forces, SWOT Profile, Market Share, Scenario Forecasts, Market Ecosystem, Company Ranking, Market Dynamics, Industry Benchmarking
|
|
Companies
|
Pentair, A.O. Smith, Culligan Water, 3M, DuPont, Watts Water Technologies, EcoWater Systems, Kinetico Incorporated, BWT Holding GmbH, Honeywell International Inc., Calgon Carbon Corporation, Xylem Inc., Aquasana
|
|
Countries
|
US, Canada, Mexico, Germany, France, Spain, Italy, UK, Russia, China, India, Japan, South Korea, Australia, South East Asia, Brazil, Argentina, Middle East, Africa
|
Point Of Entry Water Treatment Systems Market Segmentation
By Product Type
- Whole House Filtration Systems
- Sediment filters
- Carbon filtration systems
- Iron/manganese removal systems
- Water Softeners
- Salt-based ion exchange
- Salt-free conditioners
- Dual-tank systems
- UV Disinfection Systems
- Chemical Injection Systems
- Combination Systems
- Filter/softener combos
- UV/softener integrated units
By Technology
- Water Softeners
- Whole House Filters
- UV Disinfection
- Others
By End-User
- Residential Sector
- Single-family homes
- Apartment buildings
- Other homes
- Commercial Sector
- Hotels/resorts
- Restaurants
- Office buildings
- Schools/hospitals
- Industrial Sector
- Small manufacturing
- Food processing
- Laboratories
- Others
Countries Analyzed
- North America (US, Canada, Mexico)
- Europe (Germany, UK, France, Spain, Italy, Russia, Rest of Europe)
- Asia Pacific (China, India, Japan, South Korea, Australia, South East Asia, Rest of Asia)
- South America (Brazil, Argentina, Rest of South America)
- Middle East and Africa (Saudi Arabia, UAE, Rest of Middle East, South Africa, Egypt, Rest of Africa)
Top Companies in Point of Entry Water Treatment Systems Market
- Pentair
- A.O. Smith
- Culligan Water
- 3M
- DuPont
- Watts Water Technologies
- EcoWater Systems
- Kinetico Incorporated
- BWT Holding GmbH
- Honeywell International Inc.
- Calgon Carbon Corporation
- Xylem Inc.
- Aquasana
* List Not Exhaustive
Research Coverage
This report investigates the Global Point-of-Entry (POE) Water Treatment Systems Market, offering detailed analysis reviews of growth drivers, technological breakthroughs, and competitive strategies shaping the industry’s future. Published by USDAnalytics, it highlights how rising awareness of whole-house water quality, regulatory action on PFAS and heavy metals, and advances in smart, IoT-enabled multi-stage treatment solutions are redefining adoption patterns across residential, commercial, and industrial sectors. The study explores how leading players are leveraging product innovation, acquisitions, and sustainability initiatives to gain market share while addressing global water scarcity and infrastructure challenges. With actionable insights on product trends, corporate moves, and geographic opportunities, this report is an essential resource for utilities, manufacturers, policymakers, and investors evaluating long-term opportunities in comprehensive water treatment solutions.
Scope Includes:
- Segmentation: By Product Type (Water Softeners, Whole-House Filtration Systems, UV Disinfection Systems, Others), Technology (Ion Exchange, Filtration Media, Reverse Osmosis, UV, Hybrid Systems), End-User (Residential, Commercial, Industrial), and Installation Mode.
- Geographic Scope: Analysis spans 25+ countries across North America, Europe, Asia Pacific, Latin America, and the Middle East & Africa.
- Timeframe: Historic data from 2021–2024 and forecast data from 2025–2034.
- Companies: Profiles and analysis of 15+ global players shaping the POE water treatment systems market.
Methodology
The research methodology applied by USDAnalytics integrates both primary and secondary approaches to deliver accurate and reliable market insights. Primary research involved structured interviews with manufacturers, distributors, regulators, and technology experts to capture current adoption trends, regulatory impacts, and innovation strategies. Secondary research drew on trusted sources, including government reports, corporate filings, peer-reviewed publications, and industry journals, to strengthen data accuracy. Market sizing was conducted using top-down and bottom-up models, validated through data triangulation and scenario forecasting to ensure consistency. Final findings were cross-checked with industry specialists, ensuring this report provides a robust, fact-based foundation for strategic planning and investment decisions.
Deliverables:
- Comprehensive Market Research Report (PDF and Excel) with detailed tables, charts, and interactive visualizations.
- Country-Specific Forecasts & Analysis.
- Segment-Wise Revenue Forecasts (2025–2034).
- Competitive Analysis, Benchmarking, and SWOT Profiles.
- Recent Developments & Innovation Tracker.
- Executive Summary & Analyst Commentary.
- Post-Purchase Analyst Support for Client-Specific Questions and Custom Data Requirements.
Table of Contents: Point-of-Entry (POE) Water Treatment Systems Market
1. Executive Summary
1.1. Market Highlights
1.2. Key Insights Driving Market Growth
1.3. Global Market Snapshot
2. Point-of-Entry (POE) Water Treatment Systems Market Size and Growth Trends (2025–2034)
2.1. Introduction to the POE Market
2.2. Market Valuation and Growth Projections (2025–2034)
2.2.1. Current Market Size (2025): $11.9 Billion
2.2.2. Forecasted Market Size (2034): $18.8 Billion at 5.2% CAGR
2.3. Market Drivers and Key Insights
2.3.1. Rising Whole-House Water Quality Awareness
2.3.2. Growing Demand for Water Softening
2.3.3. Smart Technology Integration
2.3.4. Shift to Multi-Stage Filtration
3. Market Analysis: Technological Advancements and Strategic Moves
3.1. Overview of Market Evolution
3.2. Recent Product Innovations
3.2.1. GE Appliances’ Smart Water Valve
3.2.2. Pentair’s Everpure PFAS Reduction Systems
3.3. Corporate Expansions and Acquisitions
3.3.1. Culligan's Acquisition of Primo Water's EMEA Operations
3.3.2. A. O. Smith's India Growth and New Product Development Center
3.4. Sustainability and Digital Strategy
3.4.1. 3M's Environmental Investment
3.4.2. Culligan's "Cullie" AI WaterBot
4. Trends and Opportunities in Point of Entry Water Treatment Systems Market
4.1. Trend 1: Smart Whole-House Filtration with IoT Integration
4.1.1. Real-Time Monitoring and Predictive Maintenance
4.1.2. Compatibility with Smart Home Ecosystems
4.2. Trend 2: Multi-Contaminant Removal for PFAS & Heavy Metals
4.2.1. Regulatory Mandates and Public Health Interests
4.2.2. Effectiveness of Multi-Barrier POE Systems
4.3. Opportunity 1: Drought-Driven Adoption in Water-Scarce Regions
4.3.1. Impact of Water Scarcity on Contaminant Concentration
4.3.2. Role of Decentralized Solutions in Resilience
4.4. Opportunity 2: Commercial and Industrial Small-Scale POE Systems
4.4.1. Cost Savings and Sustainability in Businesses
4.4.2. Applications in Hospitality, Healthcare, and Offices
5. Point-of-Entry Water Treatment Systems Market Share Insights
5.1. Dominance of Water Softeners by Product Type
5.2. Rising Adoption of Whole House Filtration Systems
5.3. UV Disinfection Systems as the Fastest-Growing Segment
5.4. Ion Exchange Technology Leading the Technology Landscape
5.5. Expanding Role of Filtration Media in Comprehensive Systems
5.6. Residential Sector as the Prime End-User Driver
5.7. Commercial Applications Gaining Share
6. Country Analysis of the Point of Entry (POE) Water Treatment Systems Market
6.1. United States: Infrastructure Investment and PFAS Contamination
6.2. India: Jal Jeevan Mission and Regulatory Support
6.3. China: Urbanization and Smart Technologies
6.4. Germany: Sustainability and Advanced Filtration Innovations
6.5. Japan: High-Tech R&D and Disaster-Preparedness
6.6. United Arab Emirates (UAE): Large-Scale Infrastructure Projects
6.7. Other Country Analysis (e.g., UK, France, Australia)
7. Point Of Entry Water Treatment Systems Market Size Outlook by Region (2025–2034)
7.1. North America Market Size Outlook to 2034
7.1.1. By Product Type, Technology, and End-User
7.2. Europe Market Size Outlook to 2034
7.2.1. By Product Type, Technology, and End-User
7.3. Asia Pacific Market Size Outlook to 2034
7.3.1. By Product Type, Technology, and End-User
7.4. South America Market Size Outlook to 2034
7.4.1. By Product Type, Technology, and End-User
7.5. Middle East and Africa Market Size Outlook to 2034
7.5.1. By Product Type, Technology, and End-User
8. Company Profiles: Top Companies in Point of Entry Water Treatment Systems Market
8.1. Pentair
8.2. A.O. Smith
8.3. Culligan Water
8.4. 3M
8.5. DuPont
8.6. Watts Water Technologies
8.7. EcoWater Systems
8.8. Kinetico Incorporated
8.9. BWT Holding GmbH
8.10. Honeywell International Inc.
8.11. Calgon Carbon Corporation
8.12. Xylem Inc.
8.13. Aquasana
9. Research Coverage & Methodology
9.1. Report Scope and Focus
9.2. Research Methodology
9.3. Deliverables
10. Appendix
10.1. List of Tables
10.2. List of Figures
10.3. Abbreviations
