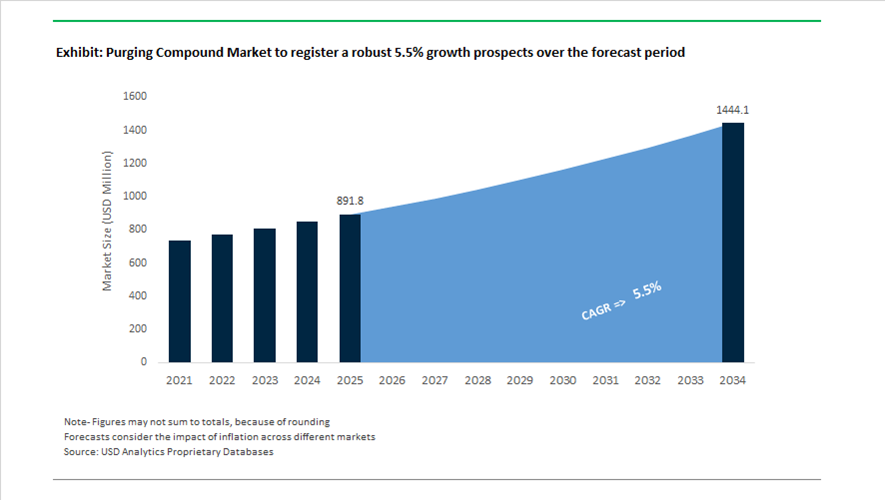
Purging Compound Market Valued at $891.8 Million in 2025, Projected to Reach $1,443.9 Million by 2034 at 5.5% CAGR
The global purging compound market is valued at $891.8 million in 2025 and is projected to reach $1,443.9 million by 2034, expanding at a CAGR of 5.5%. Growth is driven by rising demand for mechanical purging compounds, chemical foaming purges, hybrid purging formulations, hot runner cleaning solutions, injection molding purge materials, blow molding die head cleaners, and low-residue purging grades for transparent resins. Increasing production complexity in automotive, aerospace, medical, and packaging plastics is elevating the need for faster color changes, contamination removal, and reduced machine downtime. Environmental compliance requirements, particularly PFAS elimination mandates, are also reshaping formulation strategies across major suppliers.
Strategic alignment and distribution expansion accelerated in 2024. In March 2024, PolySource formed a partnership with Asaclean to distribute high-performance purging compounds across the United States, offering injection molders integrated access to both resin supply and purge materials. In the same month, Chem-Trend appointed John Lundin as President and CEO, initiating a sustainability-focused strategy aimed at reducing the CO₂ footprint of its purging compound production by 40%. At NPE 2024, Asahi Kasei highlighted the consolidation of its North American plastics units under a unified structure, enabling streamlined commercialization of 3D printing filaments, engineering resins, and Asaclean purging compounds under a single portfolio. In November 2024, Clariant completed its transition to a fully PFAS-free additive portfolio, including polymer processing aids and purge-related additives, ensuring compliance with tightening global environmental standards ahead of 2025 regulatory deadlines.
Innovation intensified through 2025. iD Additives expanded its iD QuickShots® single-dose purging compounds during 2024 and into 2025, targeting mid-sized molders seeking press-side efficiency without temperature adjustments or soak times. By mid-2025, hybrid mechanical-chemical purging compounds gained traction, combining abrasive scrubbing action with controlled chemical foaming to reach complex geometries in hot runners and die heads more effectively than conventional single-mechanism products. In September 2025, Chem-Trend confirmed complete elimination of PFAS-containing products from its Ultra Purge™ portfolio, transitioning to water-based and eco-friendly alternatives aligned with sustainability-driven procurement policies.
Product portfolio expansion continued into late 2025. In October 2025, Asahi Kasei launched the Asaclean™ R-Series in Europe, introducing three specialized grades: RU for universal applications, RX optimized with glass fiber for heavy contamination and rapid time-to-clean, and RE formulated for low-residue performance in transparent resins. These grades were positioned for showcase at the K 2025 trade exhibition, emphasizing cycle-time reduction and contamination control in high-throughput molding environments.
The purging compound market is increasingly defined by PFAS-free purge materials, hybrid mechanical-chemical cleaning systems, single-dose feed throat purging solutions, glass-fiber reinforced high-scrub grades, low-residue formulations for clear polymers, sustainability-driven CO₂ reduction strategies, and distributor-manufacturer integration models. As injection molding automation intensifies and regulatory compliance tightens, performance efficiency, environmental compatibility, and downtime minimization remain central drivers of long-term market expansion.
Key Trends and High-Impact Opportunities in the Purging Compound Market
Strategic Shift Toward Preventative Maintenance and Total Cost of Ownership Optimization
The purging compound market is undergoing a structural repositioning as processors move away from reactive, problem-driven purging toward preventative maintenance strategies embedded within standard operating procedures. Rather than deploying purging compounds only during emergency color changes or severe contamination events, manufacturers are now integrating them into scheduled maintenance cycles to control Total Cost of Ownership across high-throughput extrusion and injection molding operations.
Industrial performance studies conducted during 2024 and 2025 show that processors implementing structured purging programs can reduce downtime and scrap generation by at least 50% compared to conventional purging with virgin resin or regrind. While specialty purging compounds carry a higher upfront price per pound, their ability to accelerate color changeovers, eliminate carbon buildup, and reduce manual screw-pull interventions lowers the overall cost to purge by up to 80%. Suppliers such as Chem-Trend and Asaclean have reinforced this value proposition by introducing TCO-based calculators that translate minutes of downtime, resin waste, and labor hours into quantifiable financial losses, making purging compounds a productivity investment rather than a consumable expense.
A notable evolution within this trend is the emergence of AI-enabled predictive purging. In 2025, early adopters across automotive and packaging plants began integrating machine learning systems that analyze real-time process parameters, color-bleed signatures, and pressure fluctuations. These platforms proactively signal the optimal window for a preventative purge, allowing operators to intervene before defects such as black specks or streaking appear in high-value production runs. This shift positions purging compounds as a digital maintenance tool tightly coupled with smart factory and Industry 4.0 initiatives.
Specialized High-Temperature Compounds for Super-Engineering Polymers
The rapid adoption of super-engineering resins in aerospace, medical devices, electronics, and EV components has fundamentally altered performance requirements in the purging compound market. Conventional low-temperature grades are no longer sufficient for polymers such as PEEK, PEI, PPS, and advanced fluoropolymers, which operate at sustained melt temperatures exceeding 380°C and are highly susceptible to carbonization.
In response, manufacturers introduced new-generation high-heat mechanical and chemical purging compounds during 2024 and 2025 that maintain structural integrity at temperatures up to 420°C. These formulations are engineered to resist thermal degradation while delivering aggressive internal cleaning, enabling processors to purge without reducing barrel temperatures or dismantling screws. This capability is critical for maintaining productivity in continuous production environments where downtime can cost tens of thousands of dollars per hour.
Another dimension of this trend is the growing complexity of molding systems themselves. Multi-component, closed-loop hot runner systems used for optical-grade polycarbonate, PMMA, and medical housings contain dead zones that traditional push purges cannot access. Technical demonstrations at Fakuma 2024 showcased advanced chemical purging compounds that deploy controlled foaming action to expand within melt channels, scrubbing internal surfaces and hot runner manifolds. This ensures defect-free transitions in high-clarity and multi-material parts, reinforcing purging compounds as a quality assurance tool rather than a housekeeping product.
Penetration into Industrial Additive Manufacturing and High-Temperature 3D Printing
As additive manufacturing transitions from prototyping to serial production, purging compounds are emerging as a critical enabler of operational efficiency. Industrial FDM and FGF systems increasingly process high-temperature polymers and fiber-filled materials, creating significant risks of nozzle clogging and cross-contamination during material changes.
At Formnext 2025, next-generation industrial printers from leading OEMs demonstrated nozzle capabilities reaching up to 450°C. This escalation in operating temperature has created demand for ultra-compact purging compounds compatible with extruder diameters as small as 0.75 mm. These specialized grades are designed to remove residual carbon-fiber-filled filaments, PAEK materials, and flame-retardant blends without disassembling print heads, reducing downtime and material waste in high-mix production environments.
Large-format extrusion systems used in aerospace tooling and construction face even higher purge-related losses due to the volume of material involved. To address this, purging compound suppliers are developing low-residue concentrates that blend directly with production resins, allowing seamless material transitions without teardown. This capability significantly improves machine utilization rates in 24/7 industrial printing operations, positioning purging compounds as a high-margin consumable within the additive manufacturing ecosystem.
Ultra-Clean and Validation-Ready Solutions for Regulated Packaging Markets
Food, pharmaceutical, and cosmetic packaging manufacturers operate under increasingly stringent regulatory scrutiny related to extractables, residues, and cross-contamination risks. This environment is creating a strong opportunity for ultra-clean, validation-ready purging compounds designed specifically for regulated production lines.
Leading suppliers have responded by launching low-residue grades manufactured under ISO 9001 and ISO 14001 certified systems, supported by comprehensive technical documentation to streamline FDA, GMP, and customer audits. These compounds are engineered to fully evacuate from barrels and hot runners, minimizing the risk of residual migration into food-contact or medical-grade polymers. For processors, this reduces compliance risk while simplifying validation protocols during product changeovers.
Sustainability considerations are further accelerating adoption. By late 2025, major purging compound manufacturers had reaffirmed commitments to PFAS-free formulations in response to global regulatory pressure and corporate ESG mandates. The development of non-toxic, recyclable, and environmentally benign purging compounds aligns with green chemistry principles, enabling packaging processors to meet both safety regulations and sustainability targets without compromising cleaning performance.
Purging Compound Market Share and Segmentation Insights
Mechanical Purging Compounds Lead Polymer Processing Maintenance in Injection Molding and Extrusion
Mechanical purging compounds accounted for 48.60% of the Purging Compound Market by type in 2025, reflecting their widespread use in plastic processing operations for removing polymer residues during material or color changeovers. These compounds operate through abrasive and scrubbing mechanisms within a carrier resin that physically dislodges residual polymers from processing equipment. Their compatibility with injection molding, extrusion, and blow molding technologies supports extensive adoption across polymer processing facilities. Mechanical purging solutions remain cost effective and easy to implement without requiring chemical reactions. In 2025, development of non toxic and food grade mechanical purging formulations is gaining industry traction, enabling safe use in medical device manufacturing and food packaging production environments that require strict contamination control.
Packaging Industry Drives Demand for Purging Compounds in High-Volume Plastic Manufacturing
Packaging represented 38.60% of the Purging Compound Market by end user industry in 2025, supported by the large scale production of plastic bottles, containers, films, and closures used in consumer goods packaging. Packaging manufacturers frequently switch colors, materials, and product specifications to meet brand requirements and production schedules. These operational changes require effective purging compounds to remove polymer residues and prevent contamination between production runs. High production volumes and rapid product changeovers continue to drive demand for efficient purging solutions. In 2025, growing regulatory focus on food contact safety is influencing product formulation, with processors increasingly adopting FDA compliant and EU food contact approved purging compounds that ensure safe operation in food packaging manufacturing environments.
Purging Compound Market Competitive Landscape
The 2026 purging compound market is defined by PFAS-free formulations, high-detergency low-residue compounds, and digital process monitoring. Leading players are focusing on thermoplastic-compatible purging, circular polymer processing, and downtime reduction across EV battery, medical molding, and high-performance extrusion applications.
Asahi Kasei advances low-temperature high-detergency purging with R-Series innovation
Asahi Kasei Corporation is strengthening its leadership in the purging compound market through the expansion of its Asaclean™ portfolio into high-performance, low-temperature applications. The launch of the R-Series (RU, RX, RE) in 2025 enables efficient cleaning of high-flow and transparent engineering plastics while minimizing thermal degradation. Enhanced EX Grade formulations deliver 30% lower residue, improving removal of carbon deposits and color streaks in high-temperature processing environments up to 360°C. Logistics integration has reduced shipping costs by 36%, improving supply chain efficiency amid rising fuel costs. Sustainability efforts under its 2025–2027 plan include a 38% reduction in GHG emissions and a focus on recyclable purging compounds. Product innovation and operational efficiency support strong positioning in precision polymer maintenance.
Chem-Trend strengthens PFAS-free leadership with digital monitoring and high-performance purging solutions
Chem-Trend is positioning itself as a key player in PFAS-free purging compounds through its Ultra Purge™ portfolio and Industry 4.0-enabled solutions. The company achieved full PFAS-free compliance ahead of 2026 regulatory requirements, ensuring alignment with global environmental standards. Digital platforms such as SprayIQ™ and DilutionIQ™ provide real-time process monitoring, optimizing dosage and reducing chemical waste. Ultra Purge™ 1215 offers rapid cleaning across a wide temperature range (160°C to 300°C), effectively removing black specks and contamination in complex molds. Extensive technical expertise supports consultative site-audit services for zero-defect changeovers in medical and aerospace applications. Integration of digital tools and regulatory compliance enhances value in high-precision manufacturing environments.
Clariant drives circular purging compound innovation through pyrolysis feedstock recovery
Clariant AG is focusing on circular economy integration and high-margin specialty chemicals within the purging compound market. The company achieved a 17.8% EBITDA margin in 2025, supported by cost savings of CHF 50 million under its performance improvement program. Collaboration with Borealis and SINTEF has enabled advanced pyrolysis oil upgrading, facilitating production of circular purging compounds from recovered feedstocks. Expansion of its Clear Lake facility into GMP-compliant manufacturing strengthens its position in pharmaceutical and medical-grade polymer processing. Sustainability targets are central to portfolio optimization and R&D investments. Circular feedstock utilization and high-purity production capabilities enhance competitiveness in regulated and sustainable plastics markets.
3M repositions purging solutions portfolio following complete PFAS manufacturing exit
3M Company is undergoing a major transformation in the purging compound market following its full exit from PFAS manufacturing by the end of 2025. The company has removed PFAS from approximately 7,000 products, restructuring its portfolio toward safer chemical formulations. Focus has shifted to developing PTFE-free alternatives for industrial cleaning, abrasives, and specialty polymer processing aids. Material science capabilities support high-performance, moisture-resistant formulations for applications such as lithium-ion batteries and printed circuit boards. Financial restructuring efforts prioritize asset optimization after significant legal settlements. Supply chain control initiatives ensure elimination of PFAS-related risks in next-generation purging and processing solutions.
Kuraray accelerates specialty polymer purging solutions through digital transformation and portfolio realignment
Kuraray Co., Ltd. is advancing its position in the purging compound market through strategic portfolio restructuring and digital integration under its PASSION 2026 plan. Discontinuation of low-margin Kurarity production enables capital reallocation toward electronics materials and high-performance polymers. Organizational restructuring in 2026 introduced DX-IT and Life Innovation divisions to integrate AI-driven monitoring into manufacturing processes. The company is leveraging its vinyl acetate and EVOH expertise to support purging solutions for high-barrier film processing without gels or defects. Development of SCAPOVA™ microcarriers highlights expansion into medical and life science applications. Global production presence supports supply to advanced packaging and specialty polymer markets.
Reifenhäuser integrates in-line purification technology to enable self-purging extrusion systems
Reifenhäuser Blown Film is transforming the purging compound landscape by embedding purification capabilities directly into extrusion systems through its EVO Fusion technology. The system enables in-situ removal of pigments and contaminants from recycled materials using twin-screw extrusion and degassing, eliminating the need for standalone purging compounds. Energy savings of up to 40% are achieved by removing intermediate processing steps. The technology supports processing of complex laminated films with barrier materials such as EVOH, reducing scrap rates. Precision engineering of screws and coextrusion components enables self-purging geometries that minimize material buildup. Integration of machinery and purification processes enhances efficiency in circular plastic manufacturing.
United States: PFAS Elimination, EV Manufacturing, and Medical-Grade Process Control
The United States purging compound industry is undergoing a compliance-led and performance-driven transition shaped by environmental regulation, electric vehicle manufacturing, and medical device stringency. In September 2025, Chem-Trend confirmed the complete phase-out of PFAS across its global purging compound portfolio, aligning U.S. operations with anticipated EPA enforcement actions scheduled for 2026. This shift has accelerated the adoption of non-fluorinated, mechanically active purging agents suitable for high-temperature polymers without introducing persistent residues. On the distribution side, accessibility to advanced grades improved in March 2024 when PolySource partnered with Asaclean to expand the reach of purging solutions engineered for medical-grade polymers and high-heat engineering thermoplastics.
Downstream demand is increasingly application-specific. By late 2025, U.S. automotive processors supplying EV platforms expanded the use of HERA™ microspray-enabled purging to reduce scrap rates in noise, vibration, and harshness components that require frequent resin and color transitions. Regulatory pressure from California’s revised SB 270 plastic bag ban, effective January 1, 2026, has triggered high-volume extrusion shifts toward recycled paper and compliant reusable bags. This has materially increased demand for rapid color-change purging compounds capable of minimizing downtime. In parallel, medical device molding clusters reported an 8% increase in purging compound consumption during 2024–2025 to mitigate cross-contamination in multi-material molding. Capital allocation trends reinforce this trajectory, as processors deploying all-electric injection molding presses in 2025 increasingly specify energy-efficient purging agents to preserve cycle-time and power-saving advantages.
Germany: Industry 4.0 Monitoring, Circular Compatibility, and High-Heat Transitions
Germany’s purging compound market is being shaped by advanced process monitoring, circular economy alignment, and specialization in high-temperature polymer transitions. In March 2024, the SKZ Plastics Center introduced radar-based contamination monitoring for sheet extrusion, enabling real-time detection of residue build-up and precision-timed purging. Early industrial deployments indicate material waste reductions of up to 20%, strengthening the economic case for performance-grade purging compounds integrated into smart production environments.
Regulatory alignment with the EU Green Deal is accelerating material compatibility requirements. German producers such as Clariant and H&R Group are prioritizing purging formulations that are chemically neutral toward post-consumer recycled resin streams, supporting higher PCR inclusion without degradation or odor carryover. At the application level, Germany is leading in purging solutions for PEEK and Nylon transitions used in Industry 4.0 automotive modules and aerospace components. Sustainability integration is also advancing. In December 2025, production sites in Norderstedt demonstrated double-digit reductions in site-specific CO₂ emissions through the use of bio-based purging feedstocks embedded within broader carbon-capture and efficiency programs.
India: Recycled Content Mandates and Specialty Export Pull
India’s purging compound industry is expanding rapidly under regulatory reform and export-driven polymer processing. Amendments to the Plastic Waste Management Rules notified in June 2025 mandate 30% recycled content in Category I packaging beginning in the 2025–26 cycle. This requirement has elevated demand for advanced purging compounds capable of handling higher impurity loads, variable melt flow, and residual color in recycled feedstocks without increasing scrap. The same amendments introduced a centralized Extended Producer Responsibility portal, institutionalizing traceability and compliance scoring. As a result, processors are increasingly specifying high-efficiency purging agents to maintain purity-of-origin documentation required for EPR certification.
Export dynamics provide an additional growth vector. In 2025, India’s shipments of specialty chemical-grade polymers used in agrochemical packaging rose by more than 30%, increasing domestic consumption of chemical purging agents for blow-molded pesticide containers that require frequent grade changes. Policy support under the Production Linked Incentive scheme has reinforced localization. Domestic groups including Apar Industries and Reliance Industries expanded polymer additive and purging concentrate production to reduce import dependency and support high-throughput, compliance-driven processing environments.
Japan: Paintless Automotive Design and AI-Led Formulation Speed
Japan’s purging compound market is increasingly influenced by next-generation automotive design and digital formulation capabilities. In December 2025, UMG ABS introduced paint-free automotive compounds designed for unpainted exterior body panels in upcoming EV platforms. These materials require specialized purging cycles to preserve class-A surface finishes and avoid streaking or particulate defects during resin transitions, materially raising the performance threshold for purging agents used in Japanese automotive molding.
Innovation velocity is also accelerating at the formulation level. In 2025, the Asaclean division of Asahi Kasei reported that its AI-assisted formulation platform reduced development timelines for new-resin purging grades by 40%. This capability is particularly relevant for cleaning hot runner systems in complex, multi-cavity molds used in electronics and mobility applications, where downtime costs are high and resin diversity continues to expand.
Finland and Scandinavia: AI Formulation and Sustainable Throughput Gains
Scandinavia is emerging as a niche innovation hub for sustainable and digitally optimized purging compounds. In May 2025, the Premix Group launched an AI-driven formulation platform to accelerate development of its PRE-PRG™ purging line, emphasizing renewable and recycled raw material inputs. This approach aligns with regional sustainability mandates while addressing performance requirements in mixed-polymer processing environments.
Operational efficiency gains have been validated in adjacent industrial applications. In August 2025, Teknos Group documented a 50% reduction in downtime when using sustainable purging agents to clean powder coating lines compared with traditional mechanical methods. These results highlight the expanding role of purging compounds beyond plastics processing into broader surface treatment and coating operations across the Nordic manufacturing base.
Country-Level Snapshot: Purging Compound Industry
Purging Compound Market County Level Snapshot
|
Region
|
Primary Driver
|
Implication for Purging Compounds
|
|
United States
|
PFAS regulation, EV growth, medical molding
|
High-efficiency, non-fluorinated purging for rapid transitions
|
|
Germany
|
Industry 4.0 monitoring, circular economy
|
Smart, PCR-compatible and high-heat purging solutions
|
|
India
|
Recycled content mandates, export packaging
|
Advanced purging for impurity-heavy recycled streams
|
|
Japan
|
Paintless EV design, AI formulation
|
Precision purging for surface-critical applications
|
|
Finland / Scandinavia
|
Sustainability, digital formulation
|
Renewable-based purging with measurable efficiency gains
|
Purging Compound Market Report Scope
Purging Compound Market
|
Parameter
|
Details
|
|
Market Size (2025)
|
$891.8 Million
|
|
Market Size (2034)
|
$1443.9 Million
|
|
Market Growth Rate
|
5.5%
|
|
Segments
|
By Type (Mechanical Purging Compounds, Chemical Purging Compounds, Liquid Purging Compounds, Bio-Based Purging Compounds), By Process (Injection Molding, Extrusion, Blow Molding, Other Polymer Processing), By End-User Industry (Automotive & Mobility, Packaging, Medical & Healthcare, Electronics & Consumer Goods, Construction & Industrial)
|
|
Study Period
|
2019- 2025 and 2026-2034
|
|
Units
|
Revenue (USD)
|
|
Qualitative Analysis
|
Porter’s Five Forces, SWOT Profile, Market Share, Scenario Forecasts, Market Ecosystem, Company Ranking, Market Dynamics, Industry Benchmarking
|
|
Companies
|
Asahi Kasei Corporation, Chase Corporation, BASF SE, Clariant AG, Kuraray Co. Ltd., 3M Company, Premix Group, Calsak Corporation, Ecomass Technologies Inc., Neutrex Inc., Slide Products Inc., Rapid Purge LLC, Sun Plastech Inc.
|
|
Countries
|
US, Canada, Mexico, Germany, France, Spain, Italy, UK, Russia, China, India, Japan, South Korea, Australia, South East Asia, Brazil, Argentina, Middle East, Africa
|
Purging Compound Market Segmentation
By Type
- Mechanical Purging Compounds
- Chemical Purging Compounds
- Liquid Purging Compounds
- Bio-Based Purging Compounds
By Process
- Injection Molding
- Extrusion
- Blow Molding
- Other Polymer Processing
By End-User Industry
- Automotive & Mobility
- Packaging
- Medical & Healthcare
- Electronics & Consumer Goods
- Construction & Industrial
By Region
- North America (United States, Canada, Mexico)
- Europe (Germany, France, United Kingdom, Spain, Italy, Rest of Europe)
- Asia Pacific (China, India, Japan, South Korea, Australia, Rest of APAC)
- South and Central America (Brazil, Argentina, Rest of SCA)
- Middle East and Africa (Saudi Arabia, UAE, South Africa, Rest of Middle East, Rest of Africa)
Top Companies in Purging Compound Industry
- Asahi Kasei Corporation
- Chase Corporation
- BASF SE
- Clariant AG
- Kuraray Co. Ltd.
- 3M Company
- Premix Group
- Calsak Corporation
- Ecomass Technologies Inc.
- Neutrex Inc.
- Slide Products Inc.
- Rapid Purge LLC
- Sun Plastech Inc.
*- List not Exhaustive
