
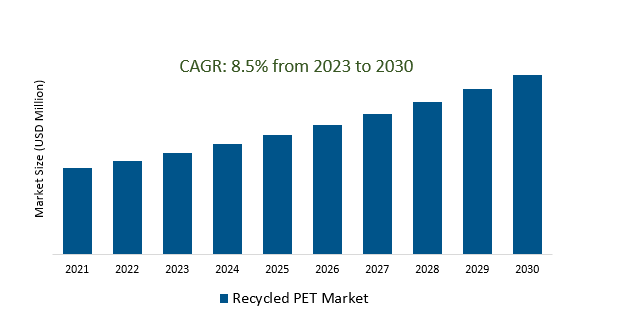
The Global Recycled PET Market Size is estimated to register 8.5% growth over the forecast period from 2023 to 2030.
The market growth is driven by an increasing implementation of stricter regulations and policies related to plastic use and disposal is a significant driver for the recycled PET market. Companies are compelled to comply with these regulations, spurring the adoption of recycled PET as a compliant and environmentally responsible material. Leading Companies focusing on Innovation in Recycling Technologies, Expansion of Application Horizons, Circular Economy Initiatives and Closed-Loop Systems, and others to boost market shares in the industry.
The Recycled PET market has seen robust growth driven by heightened environmental awareness, regulatory initiatives against plastic waste, and changing consumer preferences favoring sustainability. As governments globally tighten regulations, industries are increasingly incorporating recycled PET into their products and packaging. Consumer demand for eco-friendly options has pushed companies to prioritize sustainable practices and invest in circular economy models. Technological advancements in recycling processes are enhancing the viability of recycled PET as a competitive alternative to virgin PET. Collaborations across the value chain are streamlining the supply of recycled PET, although challenges persist, such as the need for improved collection infrastructure and competitive pricing concerns. Overall, the market continues to evolve in response to the growing emphasis on environmental responsibility and circular economy principles.
The Recycled PET market is closely tied to the surge in consumer demand for sustainable packaging, driven by a heightened environmental awareness. As consumers increasingly prioritize eco-friendly options, companies are integrating recycled PET into their packaging materials to align with sustainability goals and meet industry standards. Corporate commitment to environmentally responsible practices, adherence to certifications such as the Global Recycled Standard, and participation in educational initiatives further underscore the industry's dedication to addressing environmental concerns. Additionally, government incentives and policies worldwide are playing a pivotal role in fostering sustainability, contributing to the market's growth by encouraging businesses to adopt recycled materials and align with circular economy principles.
Circular economy initiatives are propelling a surge in demand for recycled PET in the market. This trend is evident in the development of closed-loop supply chains, fostering efficient collection, processing, and reintroduction of recycled PET into manufacturing processes. Collaborative industry partnerships and innovations in product design are further advancing circular principles, ensuring recyclability and sustainability. Consumer education campaigns emphasize the benefits of choosing products made from recycled PET, influencing purchasing decisions and contributing to heightened demand. Regulatory support, including incentives for circular practices, is reinforcing the market's shift towards sustainable and closed-loop systems, positioning recycled PET as a key component in meeting environmental goals.
Technological advancements in recycling processes for PET are significantly enhancing efficiency and expanding the supply of recycled PET in the market. Innovations in sorting technologies, advanced cleaning methods, and breakthrough recycling technologies, such as chemical depolymerization, contribute to improved quality and safety standards. The integration of digitalization and data analytics in recycling plants optimizes operational processes, reducing costs and increasing overall output. Additionally, upcycling initiatives are leveraging technology to transform recycled PET into higher-value products, fostering economic viability and supporting the broader adoption of recycled PET across various industries.
The Global Recycled PET Market is analyzed across RPET Flakes, RPET Chips, and others. RPET Chips is poised to register the fastest growth. RPET Chips, derived from the recycling of post-consumer PET products, are granular resin pellets serving as a sustainable raw material in the manufacturing of various products like packaging materials and textiles. With the growth of the circular economy, RPET Chips contributes to environmental sustainability by reducing the demand for new materials and minimizing waste. Advances in recycling technologies ensure the quality and performance of RPET Chips, addressing challenges related to consistency and contamination. The increasing demand for sustainable practices across industries propels the market for RPET Chips, positioning them as a key component in the broader adoption of recycled PET.
The Global Recycled PET Market is analyzed across various Organizations including Bottles, Fiber, Sheets, Strapping, and others. Of these, Bottles held a significant market share in 2023. The recycled PET (rPET) market for bottles is experiencing significant growth driven by increasing demand for sustainable packaging solutions. Regulatory support, technological advancements, and circular economy initiatives are contributing to the rise of recycled PET in bottle manufacturing. Many consumer goods companies are making commitments to incorporate more recycled materials, and the circular economy concept is gaining prominence. Challenges in PET waste collection and sorting persist, emphasizing the need for improved infrastructure. Economic factors, including the price of virgin PET and oil, impact the recycled PET market. Global trends indicate widespread adoption of recycled PET, with collaborations and partnerships across the value chain playing a crucial role in its success. Consumer education remains a key focus to enhance recycling practices and promote the environmental benefits of recycled PET bottles.
Revalyu unveils a PET (polyethylene terephthalate) recycling facility in the United States, situated at Gateway Regional Park in Statesboro, GA.
Placon, a manufacturer specializing in custom and stock plastic packaging, has introduced an innovative deli product line tailored for its food market.
By Type
By Application
By Source
By Color
By Region
*List not exhaustive
Recycled PET Market Outlook 2023
1 Market Overview
1.1 Introduction to the Recycled PET Market
1.2 Scope of the Study
1.3 Research Objective
1.3.1 Key Market Scope and Segments
1.3.2 Players Covered
1.3.3 Years Considered
2 Executive Summary
2.1 2023 Recycled PET Industry- Market Statistics
3 Market Dynamics
3.1 Market Drivers
3.2 Market Challenges
3.3 Market Opportunities
3.4 Market Trends
4 Market Factor Analysis
4.1 Porter’s Five Forces
4.2 Market Entropy
4.2.1 Global Recycled PET Market Companies with Area Served
4.2.2 Products Offerings Global Recycled PET Market
5 COVID-19 Impact Analysis and Outlook Scenarios
5.1.1 Covid-19 Impact Analysis
5.1.2 post-COVID-19 Scenario- Low Growth Case
5.1.3 post-COVID-19 Scenario- Reference Growth Case
5.1.4 post-COVID-19 Scenario- Low Growth Case
6 Global Recycled PET Market Trends
6.1 Global Recycled PET Revenue (USD Million) and CAGR (%) by Type (2018-2030)
6.2 Global Recycled PET Revenue (USD Million) and CAGR (%) by Applications (2018-2030)
6.3 Global Recycled PET Revenue (USD Million) and CAGR (%) by regions (2018-2030)
7 Global Recycled PET Market Revenue (USD Million) by Type, and Applications (2018-2022)
7.1 Global Recycled PET Revenue (USD Million) by Type (2018-2022)
7.1.1 Global Recycled PET Revenue (USD Million), Market Share (%) by Type (2018-2022)
7.2 Global Recycled PET Revenue (USD Million) by Applications (2018-2022)
7.2.1 Global Recycled PET Revenue (USD Million), Market Share (%) by Applications (2018-2022)
8 Global Recycled PET Development Regional Status and Outlook
8.1 Global Recycled PET Revenue (USD Million) By Regions (2018-2022)
8.2 North America Recycled PET Revenue (USD Million) by Type, and Application (2018-2022)
8.2.1 North America Recycled PET Revenue (USD Million) by Country (2018-2022)
8.2.2 North America Recycled PET Revenue (USD Million) by Type (2018-2022)
8.2.3 North America Recycled PET Revenue (USD Million) by Applications (2018-2022)
8.3 Europe Recycled PET Revenue (USD Million), by Type, and Applications (USD Million) (2018-2022)
8.3.1 Europe Recycled PET Revenue (USD Million), by Country (2018-2022)
8.3.2 Europe Recycled PET Revenue (USD Million) by Type (2018-2022)
8.3.3 Europe Recycled PET Revenue (USD Million) by Applications (2018-2022)
8.4 Asia Pacific Recycled PET Revenue (USD Million), and Revenue (USD Million) by Type, and Applications (2018-2022)
8.4.1 Asia Pacific Recycled PET Revenue (USD Million) by Country (2018-2022)
8.4.2 Asia Pacific Recycled PET Revenue (USD Million) by Type (2018-2022)
8.4.3 Asia Pacific Recycled PET Revenue (USD Million) by Applications (2018-2022)
8.5 South America Recycled PET Revenue (USD Million), by Type, and Applications (2018-2022)
8.5.1 South America Recycled PET Revenue (USD Million), by Country (2018-2022)
8.5.2 South America Recycled PET Revenue (USD Million) by Type (2018-2022)
8.5.3 South America Recycled PET Revenue (USD Million) by Applications (2018-2022)
8.6 Middle East and Africa Recycled PET Revenue (USD Million), by Type, Technology, Application, Thickness (2018-2022)
8.6.1 Middle East and Africa Recycled PET Revenue (USD Million) by Country (2018-2022)
8.6.2 Middle East and Africa Recycled PET Revenue (USD Million) by Type (2018-2022)
8.6.3 Middle East and Africa Recycled PET Revenue (USD Million) by Applications (2018-2022)
9 Company Profiles
10 Global Recycled PET Market Revenue (USD Million), by Type, and Applications (2023-2030)
10.1 Global Recycled PET Revenue (USD Million) and Market Share (%) by Type (2023-2030)
10.1.1 Global Recycled PET Revenue (USD Million), and Market Share (%) by Type (2023-2030)
10.2 Global Recycled PET Revenue (USD Million) and Market Share (%) by Applications (2023-2030)
10.2.1 Global Recycled PET Revenue (USD Million), and Market Share (%) by Applications (2023-2030)
11 Global Recycled PET Development Regional Status and Outlook Forecast
11.1 Global Recycled PET Revenue (USD Million) By Regions (2023-2030)
11.2 North America Recycled PET Revenue (USD Million) by Type, and Applications (2023-2030)
11.2.1 North America Recycled PET Revenue (USD) Million by Country (2023-2030)
11.2.2 North America Recycled PET Revenue (USD Million), by Type (2023-2030)
11.2.3 North America Recycled PET Revenue (USD Million), Market Share (%) by Applications (2023-2030)
11.3 Europe Recycled PET Revenue (USD Million), by Type, and Applications (2023-2030)
11.3.1 Europe Recycled PET Revenue (USD Million), by Country (2023-2030)
11.3.2 Europe Recycled PET Revenue (USD Million), by Type (2023-2030)
11.3.3 Europe Recycled PET Revenue (USD Million), by Applications (2023-2030)
11.4 Asia Pacific Recycled PET Revenue (USD Million) by Type, and Applications (2023-2030)
11.4.1 Asia Pacific Recycled PET Revenue (USD Million), by Country (2023-2030)
11.4.2 Asia Pacific Recycled PET Revenue (USD Million), by Type (2023-2030)
11.4.3 Asia Pacific Recycled PET Revenue (USD Million), by Applications (2023-2030)
11.5 South America Recycled PET Revenue (USD Million), by Type, and Applications (2023-2030)
11.5.1 South America Recycled PET Revenue (USD Million), by Country (2023-2030)
11.5.2 South America Recycled PET Revenue (USD Million), by Type (2023-2030)
11.5.3 South America Recycled PET Revenue (USD Million), by Applications (2023-2030)
11.6 Middle East and Africa Recycled PET Revenue (USD Million), by Type, and Applications (2023-2030)
11.6.1 Middle East and Africa Recycled PET Revenue (USD Million), by region (2023-2030)
11.6.2 Middle East and Africa Recycled PET Revenue (USD Million), by Type (2023-2030)
11.6.3 Middle East and Africa Recycled PET Revenue (USD Million), by Applications (2023-2030)
12 Methodology and Data Sources
12.1 Methodology/Research Approach
12.1.1 Research Programs/Design
12.1.2 Market Size Estimation
12.1.3 Market Breakdown and Data Triangulation
12.2 Data Sources
12.2.1 Secondary Sources
12.2.2 Primary Sources
12.3 Disclaimer
List of Tables
Table 1 Market Segmentation Analysis
Table 2 Global Recycled PET Market Companies with Areas Served
Table 3 Products Offerings Global Recycled PET Market
Table 4 Low Growth Scenario Forecasts
Table 5 Reference Case Growth Scenario
Table 6 High Growth Case Scenario
Table 7 Global Recycled PET Revenue (USD Million) And CAGR (%) By Type (2018-2030)
Table 8 Global Recycled PET Revenue (USD Million) And CAGR (%) By Applications (2018-2030)
Table 9 Global Recycled PET Revenue (USD Million) And CAGR (%) By Regions (2018-2030)
Table 10 Global Recycled PET Revenue (USD Million) By Type (2018-2022)
Table 11 Global Recycled PET Revenue Market Share (%) By Type (2018-2022)
Table 12 Global Recycled PET Revenue (USD Million) By Applications (2018-2022)
Table 13 Global Recycled PET Revenue Market Share (%) By Applications (2018-2022)
Table 14 Global Recycled PET Market Revenue (USD Million) By Regions (2018-2022)
Table 15 Global Recycled PET Market Share (%) By Regions (2018-2022)
Table 16 North America Recycled PET Revenue (USD Million) By Country (2018-2022)
Table 17 North America Recycled PET Revenue (USD Million) By Type (2018-2022)
Table 18 North America Recycled PET Revenue (USD Million) By Applications (2018-2022)
Table 19 Europe Recycled PET Revenue (USD Million) By Country (2018-2022)
Table 20 Europe Recycled PET Revenue (USD Million) By Type (2018-2022)
Table 21 Europe Recycled PET Revenue (USD Million) By Applications (2018-2022)
Table 22 Asia Pacific Recycled PET Revenue (USD Million) By Country (2018-2022)
Table 23 Asia Pacific Recycled PET Revenue (USD Million) By Type (2018-2022)
Table 24 Asia Pacific Recycled PET Revenue (USD Million) By Applications (2018-2022)
Table 25 South America Recycled PET Revenue (USD Million) By Country (2018-2022)
Table 26 South America Recycled PET Revenue (USD Million) By Type (2018-2022)
Table 27 South America Recycled PET Revenue (USD Million) By Applications (2018-2022)
Table 28 Middle East and Africa Recycled PET Revenue (USD Million) By Region (2018-2022)
Table 29 Middle East and Africa Recycled PET Revenue (USD Million) By Type (2018-2022)
Table 30 Middle East and Africa Recycled PET Revenue (USD Million) By Applications (2018-2022)
Table 31 Financial Analysis
Table 32 Global Recycled PET Revenue (USD Million) By Type (2023-2030)
Table 33 Global Recycled PET Revenue Market Share (%) By Type (2023-2030)
Table 34 Global Recycled PET Revenue (USD Million) By Applications (2023-2030)
Table 35 Global Recycled PET Revenue Market Share (%) By Applications (2023-2030)
Table 36 Global Recycled PET Market Revenue (USD Million), And Revenue (USD Million) By Regions (2023-2030)
Table 37 North America Recycled PET Revenue (USD)By Country (2023-2030)
Table 38 North America Recycled PET Revenue (USD Million) By Type (2023-2030)
Table 39 North America Recycled PET Revenue (USD Million) By Applications (2023-2030)
Table 40 Europe Recycled PET Revenue (USD Million) By Country (2023-2030)
Table 41 Europe Recycled PET Revenue (USD Million) By Type (2023-2030)
Table 42 Europe Recycled PET Revenue (USD Million) By Applications (2023-2030)
Table 43 Asia Pacific Recycled PET Revenue (USD Million) By Country (2023-2030)
Table 44 Asia Pacific Recycled PET Revenue (USD Million) By Type (2023-2030)
Table 45 Asia Pacific Recycled PET Revenue (USD Million) By Applications (2023-2030)
Table 46 South America Recycled PET Revenue (USD Million) By Country (2023-2030)
Table 47 South America Recycled PET Revenue (USD Million) By Type (2023-2030)
Table 48 South America Recycled PET Revenue (USD Million) By Applications (2023-2030)
Table 49 Middle East and Africa Recycled PET Revenue (USD Million) By Region (2023-2030)
Table 50 Middle East and Africa Recycled PET Revenue (USD Million) By Region (2023-2030)
Table 51 Middle East and Africa Recycled PET Revenue (USD Million) By Type (2023-2030)
Table 52 Middle East and Africa Recycled PET Revenue (USD Million) By Applications (2023-2030)
Table 53 Research Programs/Design for This Report
Table 54 Key Data Information from Secondary Sources
Table 55 Key Data Information from Primary Sources
List of Figures
Figure 1 Market Scope
Figure 2 Porter’s Five Forces
Figure 3 Global Recycled PET Revenue (USD Million) By Type (2018-2022)
Figure 4 Global Recycled PET Revenue Market Share (%) By Type (2022)
Figure 5 Global Recycled PET Revenue (USD Million) By Applications (2018-2022)
Figure 6 Global Recycled PET Revenue Market Share (%) By Applications (2022)
Figure 7 Global Recycled PET Market Revenue (USD Million) By Regions (2018-2022)
Figure 8 Global Recycled PET Market Share (%) By Regions (2022)
Figure 9 North America Recycled PET Revenue (USD Million) By Country (2018-2022)
Figure 10 North America Recycled PET Revenue (USD Million) By Type (2018-2022)
Figure 11 North America Recycled PET Revenue (USD Million) By Applications (2018-2022)
Figure 12 Europe Recycled PET Revenue (USD Million) By Country (2018-2022)
Figure 13 Europe Recycled PET Revenue (USD Million) By Type (2018-2022)
Figure 14 Europe Recycled PET Revenue (USD Million) By Applications (2018-2022)
Figure 15 Asia Pacific Recycled PET Revenue (USD Million) By Country (2018-2022)
Figure 16 Asia Pacific Recycled PET Revenue (USD Million) By Type (2018-2022)
Figure 17 Asia Pacific Recycled PET Revenue (USD Million) By Applications (2018-2022)
Figure 18 South America Recycled PET Revenue (USD Million) By Country (2018-2022)
Figure 19 South America Recycled PET Revenue (USD Million) By Type (2018-2022)
Figure 20 South America Recycled PET Revenue (USD Million) By Applications (2018-2022)
Figure 21 Middle East and Africa Recycled PET Revenue (USD Million) By Region (2018-2022)
Figure 22 Middle East and Africa Recycled PET Revenue (USD Million) By Type (2018-2022)
Figure 23 Middle East and Africa Recycled PET Revenue (USD Million) By Applications (2018-2022)
Figure 24 Global Recycled PET Revenue (USD Million) By Type (2023-2030)
Figure 25 Global Recycled PET Revenue Market Share (%) By Type (2030)
Figure 26 Global Recycled PET Revenue (USD Million) By Applications (2023-2030)
Figure 27 Global Recycled PET Revenue Market Share (%) By Applications (2030)
Figure 28 Global Recycled PET Market Revenue (USD Million) By Regions (2023-2030)
Figure 29 North America Recycled PET Revenue (USD Million) By Country (2023-2030)
Figure 30 North America Recycled PET Revenue (USD Million) By Type (2023-2030)
Figure 31 North America Recycled PET Revenue (USD Million) By Applications (2023-2030)
Figure 32 Europe Recycled PET Revenue (USD Million) By Country (2023-2030)
Figure 33 Europe Recycled PET Revenue (USD Million) By Type (2023-2030)
Figure 34 Europe Recycled PET Revenue (USD Million) By Applications (2023-2030)
Figure 35 Asia Pacific Recycled PET Revenue (USD Million) By Country (2023-2030)
Figure 36 Asia Pacific Recycled PET Revenue (USD Million) By Type (2023-2030)
Figure 37 Asia Pacific Recycled PET Revenue (USD Million) By Applications (2023-2030)
Figure 38 South America Recycled PET Revenue (USD Million) By Country (2023-2030)
Figure 39 South America Recycled PET Revenue (USD Million) By Type (2023-2030)
Figure 40 South America Recycled PET Revenue (USD Million) By Applications (2023-2030)
Figure 41 Middle East and Africa Recycled PET Revenue (USD Million) By Region (2023-2030)
Figure 42 Middle East and Africa Recycled PET Revenue (USD Million) By Region (2023-2030)
Figure 43 Middle East and Africa Recycled PET Revenue (USD Million) By Type (2023-2030)
Figure 44 Middle East and Africa Recycled PET Revenue (USD Million) By Applications (2023-2030)
Figure 45 Bottom-Up and Top-Down Approaches for This Report
Figure 46 Data Triangulation
By Type
By Application
By Source
By Color
By Region