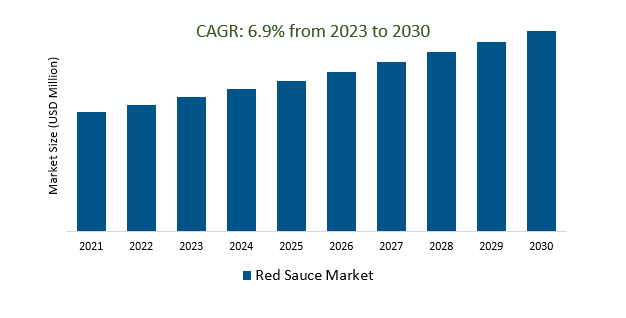
The Global Red Sauce Market Size is estimated to register 5.9% growth over the forecast period from 2023 to 2030.
The market growth is driven by an increasing growth of online shopping and the ease of ordering groceries and food products online has impacted the red sauce market, with more brands selling directly to consumers. Leading Companies focusing on Health and Wellness Focus, Global Cuisine Influence, Sustainability and Eco-Friendly Packaging, Clean Label Products, E-commerce and Direct-to-Consumer Sales, Foodservice and Restaurant Partnerships, Digital Marketing and social media, and others to boost market shares in the industry.
Market Overview
The Red Sauce market was characterized by steady global growth due to its versatility in various cuisines and a consumer focus on health, convenience, and sustainability. It offered a wide range of product varieties, including traditional and innovative flavors. Consumer trends included the demand for healthier, plant-based, and vegan options, as well as an interest in global cuisine. The market was competitive, with a variety of distribution channels, including e-commerce, and had a significant presence in the food service industry. Sustainability and adherence to quality standards were vital factors.
Market Dynamics
Market Trends- Red sauce is a convenient meal option that can save cooks and consumers time and money
Red sauce, commonly made from tomatoes and a blend of seasonings stands as a versatile and convenient culinary companion. Its popularity stems from its ability to enhance the flavors of various dishes, from classic Italian pasta to hearty pizzas. Beyond its flavorful contribution, red sauce also simplifies meal preparation for both home cooks and busy consumers, making it an ideal option for those seeking quick, delicious, and cost-effective meal solutions. This convenience factor has fueled its appeal as it reduces the need for extensive ingredient preparation and cooking time, allowing individuals to enjoy a satisfying and flavorsome meal without the hassle of starting from scratch.
Market Driver- The demand for plant-based and vegan red sauce products is growing
The Red Sauce market is experiencing a rising demand for plant-based and vegan red sauce products, aligning with the increasing preference for plant-based diets and veganism due to environmental and health concerns. Manufacturers are responding to this trend by offering a range of vegan red sauces that mimic traditional flavors, ensuring that those with plant-based diets can enjoy the rich taste of red sauces. This trend reflects a broader shift in the food industry towards more sustainable and ethical food choices, and it is expected to continue shaping the Red Sauce market.
Market Opportunity- The introduction of healthy eating initiatives is driving the demand for healthier red sauce products.
The Red Sauce market is witnessing increased demand for healthier products, driven by the introduction of health-focused eating initiatives. Consumers are seeking red sauces with lower sodium and sugar content, as well as cleaner ingredients, aligning with a broader trend towards healthier eating. This trend is bolstered by the advocacy of government and health organizations for better dietary choices. Manufacturers are responding by offering low-sodium, low-sugar, and organic red sauce options to cater to health-conscious consumers and gain a competitive edge in the market.
Market Share Analysis- Tomato Ketchup Red Sauce Market will register the fastest growth
The Global Red Sauce Market is analyzed across Tomato Ketchup, Pasta Sauce, Pizza Sauce, and others. Tomato Ketchup is poised to register the fastest growth. The Tomato Ketchup Red Sauce Market is a substantial and globally popular segment within the condiment industry, characterized by a consistent demand for tomato-based ketchup sauces. This market offers a variety of products, including traditional ketchup and specialized options like organic, low-sugar, and low-sodium ketchup. Consumer trends focus on healthier ketchup choices, emphasizing reduced sugar and sodium, as well as an interest in organic and natural varieties. Widely used in both the foodservice and retail sectors, tomato ketchup remains a competitive market, with differentiation often driven by flavor innovation and packaging strategies. Sustainability and adherence to quality standards are also critical considerations for manufacturers in this market.
Market Share Analysis- Plastic Bottle held a significant market share in 2023
The Global Red Sauce Market is analyzed across various applications including Jars, Plastic bottles, Glass bottles, Pouches, and others. Of these, Plastic Bottle held a significant market share in 2023. Plastic bottles are commonly used in the Red Sauce Market for packaging due to their convenience, cost-efficiency, preservation capabilities, and recyclability. They provide an easily customizable and visually appealing option for manufacturers. However, there's a growing focus on sustainability and the environmental impact of plastic packaging, prompting a shift towards recyclable and more eco-friendly materials to address these concerns and meet consumer demands for greener packaging options.
Red Sauce Market Segmentation
By Type
- Tomato Ketchup
- Pasta Sauce
- Pizza Sauce
- Others
By Packaging
- Jar
- Plastic Bottle
- Glass Bottle
- Pouch
- Others
By Application
By Sales Channel
By Food Classification
- Vegetarian
- Non-Vegetarian
By Flavor
- Plain
- Garlic
- Spicy
- Others
By Raw Material
By Region
- North America (United States, Canada, Mexico)
- Europe (Germany, France, United Kingdom, Spain, Italy, Others)
- Asia Pacific (China, India, Japan, South Korea, Australia, Others)
- Latin America (Brazil, Argentina, Others)
- Middle East and Africa (Saudi Arabia, UAE, Kuwait, Other Middle East, South Africa, Nigeria, Other Africa)
Red Sauce Market Companies
- Del Monte Foods Inc (United States)
- Kraft Heinz Company (United States)
- Conagra Brands, Inc (United States)
- Nestle (Switzerland)
- Campbell Soup Company (United States)
- Barilla Group (Italy)
- H.J. Heinz Company (United States)
- Leggos (Australia)
- General Mills, Inc. (United States)
- Bertolli (Italy)
- Premier Foods plc (United Kingdom)
- Mizkan Group (Japan)
*List not exhaustive
Red Sauce Market Outlook 2023
1 Market Overview
1.1 Introduction to the Red Sauce Market
1.2 Scope of the Study
1.3 Research Objective
1.3.1 Key Market Scope and Segments
1.3.2 Players Covered
1.3.3 Years Considered
2 Executive Summary
2.1 2023 Red Sauce Industry- Market Statistics
3 Market Dynamics
3.1 Market Drivers
3.2 Market Challenges
3.3 Market Opportunities
3.4 Market Trends
4 Market Factor Analysis
4.1 Porter’s Five Forces
4.2 Market Entropy
4.2.1 Global Red Sauce Market Companies with Area Served
4.2.2 Products Offerings Global Red Sauce Market
5 COVID-19 Impact Analysis and Outlook Scenarios
5.1.1 Covid-19 Impact Analysis
5.1.2 Post-COVID-19 Scenario- Low Growth Case
5.1.3 Post-COVID-19 Scenario- Reference Growth Case
5.1.4 Post-COVID-19 Scenario- Low Growth Case
6 Global Red Sauce Market Trends
6.1 Global Red Sauce Revenue (USD Million) and CAGR (%) by Type (2018-2030)
6.2 Global Red Sauce Revenue (USD Million) and CAGR (%) by Applications (2018-2030)
6.3 Global Red Sauce Revenue (USD Million) and CAGR (%) by Regions (2018-2030)
7 Global Red Sauce Market Revenue (USD Million) by Type, and Applications (2018-2022)
7.1 Global Red Sauce Revenue (USD Million) by Type (2018-2022)
7.1.1 Global Red Sauce Revenue (USD Million), Market Share (%) by Type (2018-2022)
7.2 Global Red Sauce Revenue (USD Million) by Applications (2018-2022)
7.2.1 Global Red Sauce Revenue (USD Million), Market Share (%) by Applications (2018-2022)
8 Global Red Sauce Development Regional Status and Outlook
8.1 Global Red Sauce Revenue (USD Million) By Regions (2018-2022)
8.2 North America Red Sauce Revenue (USD Million) by Type, and Application (2018-2022)
8.2.1 North America Red Sauce Revenue (USD Million) by Country (2018-2022)
8.2.2 North America Red Sauce Revenue (USD Million) by Type (2018-2022)
8.2.3 North America Red Sauce Revenue (USD Million) by Applications (2018-2022)
8.3 Europe Red Sauce Revenue (USD Million), by Type, and Applications (USD Million) (2018-2022)
8.3.1 Europe Red Sauce Revenue (USD Million), by Country (2018-2022)
8.3.2 Europe Red Sauce Revenue (USD Million) by Type (2018-2022)
8.3.3 Europe Red Sauce Revenue (USD Million) by Applications (2018-2022)
8.4 Asia Pacific Red Sauce Revenue (USD Million), and Revenue (USD Million) by Type, and Applications (2018-2022)
8.4.1 Asia Pacific Red Sauce Revenue (USD Million) by Country (2018-2022)
8.4.2 Asia Pacific Red Sauce Revenue (USD Million) by Type (2018-2022)
8.4.3 Asia Pacific Red Sauce Revenue (USD Million) by Applications (2018-2022)
8.5 South America Red Sauce Revenue (USD Million), by Type, and Applications (2018-2022)
8.5.1 South America Red Sauce Revenue (USD Million), by Country (2018-2022)
8.5.2 South America Red Sauce Revenue (USD Million) by Type (2018-2022)
8.5.3 South America Red Sauce Revenue (USD Million) by Applications (2018-2022)
8.6 Middle East and Africa Red Sauce Revenue (USD Million), by Type, Technology, Application, Thickness (2018-2022)
8.6.1 Middle East and Africa Red Sauce Revenue (USD Million) by Country (2018-2022)
8.6.2 Middle East and Africa Red Sauce Revenue (USD Million) by Type (2018-2022)
8.6.3 Middle East and Africa Red Sauce Revenue (USD Million) by Applications (2018-2022)
9 Company Profiles
10 Global Red Sauce Market Revenue (USD Million), by Type, and Applications (2023-2030)
10.1 Global Red Sauce Revenue (USD Million) and Market Share (%) by Type (2023-2030)
10.1.1 Global Red Sauce Revenue (USD Million), and Market Share (%) by Type (2023-2030)
10.2 Global Red Sauce Revenue (USD Million) and Market Share (%) by Applications (2023-2030)
10.2.1 Global Red Sauce Revenue (USD Million), and Market Share (%) by Applications (2023-2030)
11 Global Red Sauce Development Regional Status and Outlook Forecast
11.1 Global Red Sauce Revenue (USD Million) By Regions (2023-2030)
11.2 North America Red Sauce Revenue (USD Million) by Type, and Applications (2023-2030)
11.2.1 North America Red Sauce Revenue (USD) Million by Country (2023-2030)
11.2.2 North America Red Sauce Revenue (USD Million), by Type (2023-2030)
11.2.3 North America Red Sauce Revenue (USD Million), Market Share (%) by Applications (2023-2030)
11.3 Europe Red Sauce Revenue (USD Million), by Type, and Applications (2023-2030)
11.3.1 Europe Red Sauce Revenue (USD Million), by Country (2023-2030)
11.3.2 Europe Red Sauce Revenue (USD Million), by Type (2023-2030)
11.3.3 Europe Red Sauce Revenue (USD Million), by Applications (2023-2030)
11.4 Asia Pacific Red Sauce Revenue (USD Million) by Type, and Applications (2023-2030)
11.4.1 Asia Pacific Red Sauce Revenue (USD Million), by Country (2023-2030)
11.4.2 Asia Pacific Red Sauce Revenue (USD Million), by Type (2023-2030)
11.4.3 Asia Pacific Red Sauce Revenue (USD Million), by Applications (2023-2030)
11.5 South America Red Sauce Revenue (USD Million), by Type, and Applications (2023-2030)
11.5.1 South America Red Sauce Revenue (USD Million), by Country (2023-2030)
11.5.2 South America Red Sauce Revenue (USD Million), by Type (2023-2030)
11.5.3 South America Red Sauce Revenue (USD Million), by Applications (2023-2030)
11.6 Middle East and Africa Red Sauce Revenue (USD Million), by Type, and Applications (2023-2030)
11.6.1 Middle East and Africa Red Sauce Revenue (USD Million), by Region (2023-2030)
11.6.2 Middle East and Africa Red Sauce Revenue (USD Million), by Type (2023-2030)
11.6.3 Middle East and Africa Red Sauce Revenue (USD Million), by Applications (2023-2030)
12 Methodology and Data Sources
12.1 Methodology/Research Approach
12.1.1 Research Programs/Design
12.1.2 Market Size Estimation
12.1.3 Market Breakdown and Data Triangulation
12.2 Data Sources
12.2.1 Secondary Sources
12.2.2 Primary Sources
12.3 Disclaimer
List of Tables
Table 1 Market Segmentation Analysis
Table 2 Global Red Sauce Market Companies with Areas Served
Table 3 Products Offerings Global Red Sauce Market
Table 4 Low Growth Scenario Forecasts
Table 5 Reference Case Growth Scenario
Table 6 High Growth Case Scenario
Table 7 Global Red Sauce Revenue (USD Million) And CAGR (%) By Type (2018-2030)
Table 8 Global Red Sauce Revenue (USD Million) And CAGR (%) By Applications (2018-2030)
Table 9 Global Red Sauce Revenue (USD Million) And CAGR (%) By Regions (2018-2030)
Table 10 Global Red Sauce Revenue (USD Million) By Type (2018-2022)
Table 11 Global Red Sauce Revenue Market Share (%) By Type (2018-2022)
Table 12 Global Red Sauce Revenue (USD Million) By Applications (2018-2022)
Table 13 Global Red Sauce Revenue Market Share (%) By Applications (2018-2022)
Table 14 Global Red Sauce Market Revenue (USD Million) By Regions (2018-2022)
Table 15 Global Red Sauce Market Share (%) By Regions (2018-2022)
Table 16 North America Red Sauce Revenue (USD Million) By Country (2018-2022)
Table 17 North America Red Sauce Revenue (USD Million) By Type (2018-2022)
Table 18 North America Red Sauce Revenue (USD Million) By Applications (2018-2022)
Table 19 Europe Red Sauce Revenue (USD Million) By Country (2018-2022)
Table 20 Europe Red Sauce Revenue (USD Million) By Type (2018-2022)
Table 21 Europe Red Sauce Revenue (USD Million) By Applications (2018-2022)
Table 22 Asia Pacific Red Sauce Revenue (USD Million) By Country (2018-2022)
Table 23 Asia Pacific Red Sauce Revenue (USD Million) By Type (2018-2022)
Table 24 Asia Pacific Red Sauce Revenue (USD Million) By Applications (2018-2022)
Table 25 South America Red Sauce Revenue (USD Million) By Country (2018-2022)
Table 26 South America Red Sauce Revenue (USD Million) By Type (2018-2022)
Table 27 South America Red Sauce Revenue (USD Million) By Applications (2018-2022)
Table 28 Middle East and Africa Red Sauce Revenue (USD Million) By Region (2018-2022)
Table 29 Middle East and Africa Red Sauce Revenue (USD Million) By Type (2018-2022)
Table 30 Middle East and Africa Red Sauce Revenue (USD Million) By Applications (2018-2022)
Table 31 Financial Analysis
Table 32 Global Red Sauce Revenue (USD Million) By Type (2023-2030)
Table 33 Global Red Sauce Revenue Market Share (%) By Type (2023-2030)
Table 34 Global Red Sauce Revenue (USD Million) By Applications (2023-2030)
Table 35 Global Red Sauce Revenue Market Share (%) By Applications (2023-2030)
Table 36 Global Red Sauce Market Revenue (USD Million), And Revenue (USD Million) By Regions (2023-2030)
Table 37 North America Red Sauce Revenue (USD)By Country (2023-2030)
Table 38 North America Red Sauce Revenue (USD Million) By Type (2023-2030)
Table 39 North America Red Sauce Revenue (USD Million) By Applications (2023-2030)
Table 40 Europe Red Sauce Revenue (USD Million) By Country (2023-2030)
Table 41 Europe Red Sauce Revenue (USD Million) By Type (2023-2030)
Table 42 Europe Red Sauce Revenue (USD Million) By Applications (2023-2030)
Table 43 Asia Pacific Red Sauce Revenue (USD Million) By Country (2023-2030)
Table 44 Asia Pacific Red Sauce Revenue (USD Million) By Type (2023-2030)
Table 45 Asia Pacific Red Sauce Revenue (USD Million) By Applications (2023-2030)
Table 46 South America Red Sauce Revenue (USD Million) By Country (2023-2030)
Table 47 South America Red Sauce Revenue (USD Million) By Type (2023-2030)
Table 48 South America Red Sauce Revenue (USD Million) By Applications (2023-2030)
Table 49 Middle East and Africa Red Sauce Revenue (USD Million) By Region (2023-2030)
Table 50 Middle East and Africa Red Sauce Revenue (USD Million) By Region (2023-2030)
Table 51 Middle East and Africa Red Sauce Revenue (USD Million) By Type (2023-2030)
Table 52 Middle East and Africa Red Sauce Revenue (USD Million) By Applications (2023-2030)
Table 53 Research Programs/Design for This Report
Table 54 Key Data Information from Secondary Sources
Table 55 Key Data Information from Primary Sources
List of Figures
Figure 1 Market Scope
Figure 2 Porter’s Five Forces
Figure 3 Global Red Sauce Revenue (USD Million) By Type (2018-2022)
Figure 4 Global Red Sauce Revenue Market Share (%) By Type (2022)
Figure 5 Global Red Sauce Revenue (USD Million) By Applications (2018-2022)
Figure 6 Global Red Sauce Revenue Market Share (%) By Applications (2022)
Figure 7 Global Red Sauce Market Revenue (USD Million) By Regions (2018-2022)
Figure 8 Global Red Sauce Market Share (%) By Regions (2022)
Figure 9 North America Red Sauce Revenue (USD Million) By Country (2018-2022)
Figure 10 North America Red Sauce Revenue (USD Million) By Type (2018-2022)
Figure 11 North America Red Sauce Revenue (USD Million) By Applications (2018-2022)
Figure 12 Europe Red Sauce Revenue (USD Million) By Country (2018-2022)
Figure 13 Europe Red Sauce Revenue (USD Million) By Type (2018-2022)
Figure 14 Europe Red Sauce Revenue (USD Million) By Applications (2018-2022)
Figure 15 Asia Pacific Red Sauce Revenue (USD Million) By Country (2018-2022)
Figure 16 Asia Pacific Red Sauce Revenue (USD Million) By Type (2018-2022)
Figure 17 Asia Pacific Red Sauce Revenue (USD Million) By Applications (2018-2022)
Figure 18 South America Red Sauce Revenue (USD Million) By Country (2018-2022)
Figure 19 South America Red Sauce Revenue (USD Million) By Type (2018-2022)
Figure 20 South America Red Sauce Revenue (USD Million) By Applications (2018-2022)
Figure 21 Middle East and Africa Red Sauce Revenue (USD Million) By Region (2018-2022)
Figure 22 Middle East and Africa Red Sauce Revenue (USD Million) By Type (2018-2022)
Figure 23 Middle East and Africa Red Sauce Revenue (USD Million) By Applications (2018-2022)
Figure 24 Global Red Sauce Revenue (USD Million) By Type (2023-2030)
Figure 25 Global Red Sauce Revenue Market Share (%) By Type (2030)
Figure 26 Global Red Sauce Revenue (USD Million) By Applications (2023-2030)
Figure 27 Global Red Sauce Revenue Market Share (%) By Applications (2030)
Figure 28 Global Red Sauce Market Revenue (USD Million) By Regions (2023-2030)
Figure 29 North America Red Sauce Revenue (USD Million) By Country (2023-2030)
Figure 30 North America Red Sauce Revenue (USD Million) By Type (2023-2030)
Figure 31 North America Red Sauce Revenue (USD Million) By Applications (2023-2030)
Figure 32 Europe Red Sauce Revenue (USD Million) By Country (2023-2030)
Figure 33 Europe Red Sauce Revenue (USD Million) By Type (2023-2030)
Figure 34 Europe Red Sauce Revenue (USD Million) By Applications (2023-2030)
Figure 35 Asia Pacific Red Sauce Revenue (USD Million) By Country (2023-2030)
Figure 36 Asia Pacific Red Sauce Revenue (USD Million) By Type (2023-2030)
Figure 37 Asia Pacific Red Sauce Revenue (USD Million) By Applications (2023-2030)
Figure 38 South America Red Sauce Revenue (USD Million) By Country (2023-2030)
Figure 39 South America Red Sauce Revenue (USD Million) By Type (2023-2030)
Figure 40 South America Red Sauce Revenue (USD Million) By Applications (2023-2030)
Figure 41 Middle East and Africa Red Sauce Revenue (USD Million) By Region (2023-2030)
Figure 42 Middle East and Africa Red Sauce Revenue (USD Million) By Region (2023-2030)
Figure 43 Middle East and Africa Red Sauce Revenue (USD Million) By Type (2023-2030)
Figure 44 Middle East and Africa Red Sauce Revenue (USD Million) By Applications (2023-2030)
Figure 45 Bottom-Up and Top-Down Approaches For This Report
Figure 46 Data Triangulation
