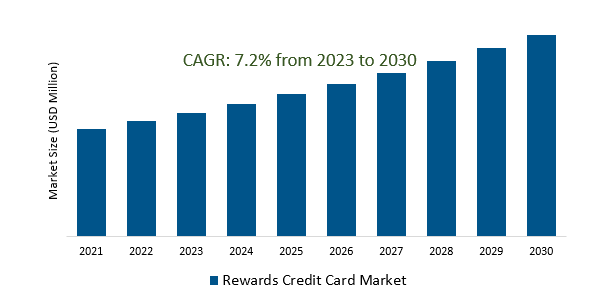
The Rewards Credit Card Market is estimated to register 7.2% growth over the forecast period from 2023 to 2030.
Rewards Credit Card Market Overview
The rise in digital transactions and the adoption of contactless payment methods are the key factors. Credit card issuers are continually innovating their reward programs, offering diverse incentives beyond traditional cashback or points systems. Integration of contactless features, allowing customers to make secure and swift transactions, fostering convenience and safety, especially in response to evolving consumer preferences post-pandemic. Security measures, including fraud protection and identity theft prevention are fueling the demand. Shifts in consumer lifestyles and preferences, such as increased travel, dining out, or online shopping are influencing the types of rewards and benefits that cardholders find attractive.
Rewards Credit Card Market Dynamics
Market Trends- Impact of Emerging Payment Technologies on the Rewards Credit Card Market.
Emerging payment technologies, including contactless payments, digital wallets, blockchain solutions, and mobile apps, are fundamentally reshaping the market growth.
The rise of cryptocurrencies and blockchain are leading to discussions about incorporating digital assets as a form of reward or incentive in credit card programs. Further, the emergence of new payment technologies, such as contactless payments, mobile wallets, and buy now, pay later (BNPL) services, is influencing the market growth.
Credit card issuers are exploring innovative ways to integrate new technologies into their reward structures, aiming to provide unique and forward-thinking incentives that resonate with the modern consumer.
Market Driver- Digitalization and Mobile Integration drives the demand growth.
Increasing consumer reliance on smartphones and digital solutions is driving credit card companies to adapt and integrate mobile services.
Enhancing security measures, such as biometric authentication and real-time transaction monitoring, strengthening security protocols and reducing fraud risks associated with credit card usage are driving the market growth.
Further, Credit card companies are continuously enhancing their mobile apps to provide a seamless user experience, offering features such as real-time rewards tracking, personalized offers, and easy redemption options, thereby increasing the market growth.
Market Opportunity- Enhancing Engagement through Personalized Marketing in the Rewards Credit Card Market.
The surge in competition among credit card issuers is propelling a significant focus on leveraging consumer data for personalized offerings.
The proliferation of data analytics and sophisticated technologies is empowering issuers to deeply understand consumer behaviors, preferences, and spending patterns which allows personalized reward programs, thereby increasing the demand.
The desire to efficiently reach specific consumer segments with customized offers, addressing their distinct needs and preferences more effectively is fueling the market.
Market Share Analysis- Cash back credit cards will register the fastest growth.
The Credit Card Market is analyzed across Travel credit cards, Points rewards cards & Cash back credit cards. Cash back credit cards is poised to register the fastest growth. They offer cardholders the benefit of earning a percentage of their spending back in the form of cash rewards. These cards have gained significant popularity due to their straightforward and tangible rewards structure. Consumers appreciate the simplicity of earning cash rebates on their purchases, making them a preferred choice for those seeking immediate savings. Furthe, they offer varying cashback rates based on spending categories, with higher percentages for specific purchases like groceries, gas, dining, or other eligible expenses. Additionally, some cards provide sign-up bonuses or promotional cashback rates during specific periods to attract new customers.
Market Share Analysis- Personal category held a significant market share in 2023.
The Credit Card Market is analyzed across various categories including Personal, Enterprise, Government & Others. Of these, Personal category held a significant market share in 2023. These credit cards are primarily designed to provide incentives and rewards tailored to personal lifestyles and spending habits. Consumers opt for personal credit cards to earn rewards, such as cashback, points, or miles, on their everyday purchases, including groceries, dining, shopping, travel, and entertainment. These cards often offer diverse benefits, such as sign-up bonuses, promotional rewards, or exclusive perks like travel insurance, airport lounge access, or discounts on various services. Consumers value the flexibility and convenience offered by these cards, leveraging rewards to optimize their spending and savings while enjoying added benefits tailored to their preferences.
Credit Card Market Segmentation
By Type
- Travel credit cards
- Points rewards cards
- Cash back credit cards
By Application
- Personal
- Enterprise
- Government
- Others
By Region
- North America (United States, Canada, Mexico)
- Europe (Germany, France, United Kingdom, Spain, Italy, Others)
- Asia Pacific (China, India, Japan, South Korea, Australia, Others)
- Latin America (Brazil, Argentina, Others)
- Middle East and Africa (Saudi Arabia, UAE, Kuwait, Other Middle East, South Africa, Nigeria, Other Africa)
Credit Card Market Companies
- Visa (United States)
- American Express Banking Corp. (United States)
- MasterCard (United States)
- Citigroup Inc (United States)
- JPMorgan Chase & Co (United States)
- Capital One (United States)
- Barclays US (United States)
- BlockFi (United States)
- Bank of America (United States)
- Synchrony Financial (United States)
- Discover Bank (United States)
*List not exhaustive
Rewards Credit Card Market Outlook 2023
1 Market Overview
1.1 Introduction to the Rewards Credit Card Market
1.2 Scope of the Study
1.3 Research Objective
1.3.1 Key Market Scope and Segments
1.3.2 Players Covered
1.3.3 Years Considered
2 Executive Summary
2.1 2023 Rewards Credit Card Industry- Market Statistics
3 Market Dynamics
3.1 Market Drivers
3.2 Market Challenges
3.3 Market Opportunities
3.4 Market Trends
4 Market Factor Analysis
4.1 Porter’s Five Forces
4.2 Market Entropy
4.2.1 Global Rewards Credit Card Market Companies with Area Served
4.2.2 Products Offerings Global Rewards Credit Card Market
5 COVID-19 Impact Analysis and Outlook Scenarios
5.1.1 Covid-19 Impact Analysis
5.1.2 post-COVID-19 Scenario- Low Growth Case
5.1.3 post-COVID-19 Scenario- Reference Growth Case
5.1.4 post-COVID-19 Scenario- Low Growth Case
6 Global Rewards Credit Card Market Trends
6.1 Global Rewards Credit Card Revenue (USD Million) and CAGR (%) by Type (2018-2030)
6.2 Global Rewards Credit Card Revenue (USD Million) and CAGR (%) by Applications (2018-2030)
6.3 Global Rewards Credit Card Revenue (USD Million) and CAGR (%) by regions (2018-2030)
7 Global Rewards Credit Card Market Revenue (USD Million) by Type, and Applications (2018-2022)
7.1 Global Rewards Credit Card Revenue (USD Million) by Type (2018-2022)
7.1.1 Global Rewards Credit Card Revenue (USD Million), Market Share (%) by Type (2018-2022)
7.2 Global Rewards Credit Card Revenue (USD Million) by Applications (2018-2022)
7.2.1 Global Rewards Credit Card Revenue (USD Million), Market Share (%) by Applications (2018-2022)
8 Global Rewards Credit Card Development Regional Status and Outlook
8.1 Global Rewards Credit Card Revenue (USD Million) By Regions (2018-2022)
8.2 North America Rewards Credit Card Revenue (USD Million) by Type, and Application (2018-2022)
8.2.1 North America Rewards Credit Card Revenue (USD Million) by Country (2018-2022)
8.2.2 North America Rewards Credit Card Revenue (USD Million) by Type (2018-2022)
8.2.3 North America Rewards Credit Card Revenue (USD Million) by Applications (2018-2022)
8.3 Europe Rewards Credit Card Revenue (USD Million), by Type, and Applications (USD Million) (2018-2022)
8.3.1 Europe Rewards Credit Card Revenue (USD Million), by Country (2018-2022)
8.3.2 Europe Rewards Credit Card Revenue (USD Million) by Type (2018-2022)
8.3.3 Europe Rewards Credit Card Revenue (USD Million) by Applications (2018-2022)
8.4 Asia Pacific Rewards Credit Card Revenue (USD Million), and Revenue (USD Million) by Type, and Applications (2018-2022)
8.4.1 Asia Pacific Rewards Credit Card Revenue (USD Million) by Country (2018-2022)
8.4.2 Asia Pacific Rewards Credit Card Revenue (USD Million) by Type (2018-2022)
8.4.3 Asia Pacific Rewards Credit Card Revenue (USD Million) by Applications (2018-2022)
8.5 South America Rewards Credit Card Revenue (USD Million), by Type, and Applications (2018-2022)
8.5.1 South America Rewards Credit Card Revenue (USD Million), by Country (2018-2022)
8.5.2 South America Rewards Credit Card Revenue (USD Million) by Type (2018-2022)
8.5.3 South America Rewards Credit Card Revenue (USD Million) by Applications (2018-2022)
8.6 Middle East and Africa Rewards Credit Card Revenue (USD Million), by Type, Technology, Application, Thickness (2018-2022)
8.6.1 Middle East and Africa Rewards Credit Card Revenue (USD Million) by Country (2018-2022)
8.6.2 Middle East and Africa Rewards Credit Card Revenue (USD Million) by Type (2018-2022)
8.6.3 Middle East and Africa Rewards Credit Card Revenue (USD Million) by Applications (2018-2022)
9 Company Profiles
10 Global Rewards Credit Card Market Revenue (USD Million), by Type, and Applications (2023-2030)
10.1 Global Rewards Credit Card Revenue (USD Million) and Market Share (%) by Type (2023-2030)
10.1.1 Global Rewards Credit Card Revenue (USD Million), and Market Share (%) by Type (2023-2030)
10.2 Global Rewards Credit Card Revenue (USD Million) and Market Share (%) by Applications (2023-2030)
10.2.1 Global Rewards Credit Card Revenue (USD Million), and Market Share (%) by Applications (2023-2030)
11 Global Rewards Credit Card Development Regional Status and Outlook Forecast
11.1 Global Rewards Credit Card Revenue (USD Million) By Regions (2023-2030)
11.2 North America Rewards Credit Card Revenue (USD Million) by Type, and Applications (2023-2030)
11.2.1 North America Rewards Credit Card Revenue (USD) Million by Country (2023-2030)
11.2.2 North America Rewards Credit Card Revenue (USD Million), by Type (2023-2030)
11.2.3 North America Rewards Credit Card Revenue (USD Million), Market Share (%) by Applications (2023-2030)
11.3 Europe Rewards Credit Card Revenue (USD Million), by Type, and Applications (2023-2030)
11.3.1 Europe Rewards Credit Card Revenue (USD Million), by Country (2023-2030)
11.3.2 Europe Rewards Credit Card Revenue (USD Million), by Type (2023-2030)
11.3.3 Europe Rewards Credit Card Revenue (USD Million), by Applications (2023-2030)
11.4 Asia Pacific Rewards Credit Card Revenue (USD Million) by Type, and Applications (2023-2030)
11.4.1 Asia Pacific Rewards Credit Card Revenue (USD Million), by Country (2023-2030)
11.4.2 Asia Pacific Rewards Credit Card Revenue (USD Million), by Type (2023-2030)
11.4.3 Asia Pacific Rewards Credit Card Revenue (USD Million), by Applications (2023-2030)
11.5 South America Rewards Credit Card Revenue (USD Million), by Type, and Applications (2023-2030)
11.5.1 South America Rewards Credit Card Revenue (USD Million), by Country (2023-2030)
11.5.2 South America Rewards Credit Card Revenue (USD Million), by Type (2023-2030)
11.5.3 South America Rewards Credit Card Revenue (USD Million), by Applications (2023-2030)
11.6 Middle East and Africa Rewards Credit Card Revenue (USD Million), by Type, and Applications (2023-2030)
11.6.1 Middle East and Africa Rewards Credit Card Revenue (USD Million), by region (2023-2030)
11.6.2 Middle East and Africa Rewards Credit Card Revenue (USD Million), by Type (2023-2030)
11.6.3 Middle East and Africa Rewards Credit Card Revenue (USD Million), by Applications (2023-2030)
12 Methodology and Data Sources
12.1 Methodology/Research Approach
12.1.1 Research Programs/Design
12.1.2 Market Size Estimation
12.1.3 Market Breakdown and Data Triangulation
12.2 Data Sources
12.2.1 Secondary Sources
12.2.2 Primary Sources
12.3 Disclaimer
List of Tables
Table 1 Market Segmentation Analysis
Table 2 Global Rewards Credit Card Market Companies with Areas Served
Table 3 Products Offerings Global Rewards Credit Card Market
Table 4 Low Growth Scenario Forecasts
Table 5 Reference Case Growth Scenario
Table 6 High Growth Case Scenario
Table 7 Global Rewards Credit Card Revenue (USD Million) And CAGR (%) By Type (2018-2030)
Table 8 Global Rewards Credit Card Revenue (USD Million) And CAGR (%) By Applications (2018-2030)
Table 9 Global Rewards Credit Card Revenue (USD Million) And CAGR (%) By Regions (2018-2030)
Table 10 Global Rewards Credit Card Revenue (USD Million) By Type (2018-2022)
Table 11 Global Rewards Credit Card Revenue Market Share (%) By Type (2018-2022)
Table 12 Global Rewards Credit Card Revenue (USD Million) By Applications (2018-2022)
Table 13 Global Rewards Credit Card Revenue Market Share (%) By Applications (2018-2022)
Table 14 Global Rewards Credit Card Market Revenue (USD Million) By Regions (2018-2022)
Table 15 Global Rewards Credit Card Market Share (%) By Regions (2018-2022)
Table 16 North America Rewards Credit Card Revenue (USD Million) By Country (2018-2022)
Table 17 North America Rewards Credit Card Revenue (USD Million) By Type (2018-2022)
Table 18 North America Rewards Credit Card Revenue (USD Million) By Applications (2018-2022)
Table 19 Europe Rewards Credit Card Revenue (USD Million) By Country (2018-2022)
Table 20 Europe Rewards Credit Card Revenue (USD Million) By Type (2018-2022)
Table 21 Europe Rewards Credit Card Revenue (USD Million) By Applications (2018-2022)
Table 22 Asia Pacific Rewards Credit Card Revenue (USD Million) By Country (2018-2022)
Table 23 Asia Pacific Rewards Credit Card Revenue (USD Million) By Type (2018-2022)
Table 24 Asia Pacific Rewards Credit Card Revenue (USD Million) By Applications (2018-2022)
Table 25 South America Rewards Credit Card Revenue (USD Million) By Country (2018-2022)
Table 26 South America Rewards Credit Card Revenue (USD Million) By Type (2018-2022)
Table 27 South America Rewards Credit Card Revenue (USD Million) By Applications (2018-2022)
Table 28 Middle East and Africa Rewards Credit Card Revenue (USD Million) By Region (2018-2022)
Table 29 Middle East and Africa Rewards Credit Card Revenue (USD Million) By Type (2018-2022)
Table 30 Middle East and Africa Rewards Credit Card Revenue (USD Million) By Applications (2018-2022)
Table 31 Financial Analysis
Table 32 Global Rewards Credit Card Revenue (USD Million) By Type (2023-2030)
Table 33 Global Rewards Credit Card Revenue Market Share (%) By Type (2023-2030)
Table 34 Global Rewards Credit Card Revenue (USD Million) By Applications (2023-2030)
Table 35 Global Rewards Credit Card Revenue Market Share (%) By Applications (2023-2030)
Table 36 Global Rewards Credit Card Market Revenue (USD Million), And Revenue (USD Million) By Regions (2023-2030)
Table 37 North America Rewards Credit Card Revenue (USD)By Country (2023-2030)
Table 38 North America Rewards Credit Card Revenue (USD Million) By Type (2023-2030)
Table 39 North America Rewards Credit Card Revenue (USD Million) By Applications (2023-2030)
Table 40 Europe Rewards Credit Card Revenue (USD Million) By Country (2023-2030)
Table 41 Europe Rewards Credit Card Revenue (USD Million) By Type (2023-2030)
Table 42 Europe Rewards Credit Card Revenue (USD Million) By Applications (2023-2030)
Table 43 Asia Pacific Rewards Credit Card Revenue (USD Million) By Country (2023-2030)
Table 44 Asia Pacific Rewards Credit Card Revenue (USD Million) By Type (2023-2030)
Table 45 Asia Pacific Rewards Credit Card Revenue (USD Million) By Applications (2023-2030)
Table 46 South America Rewards Credit Card Revenue (USD Million) By Country (2023-2030)
Table 47 South America Rewards Credit Card Revenue (USD Million) By Type (2023-2030)
Table 48 South America Rewards Credit Card Revenue (USD Million) By Applications (2023-2030)
Table 49 Middle East and Africa Rewards Credit Card Revenue (USD Million) By Region (2023-2030)
Table 50 Middle East and Africa Rewards Credit Card Revenue (USD Million) By Region (2023-2030)
Table 51 Middle East and Africa Rewards Credit Card Revenue (USD Million) By Type (2023-2030)
Table 52 Middle East and Africa Rewards Credit Card Revenue (USD Million) By Applications (2023-2030)
Table 53 Research Programs/Design for This Report
Table 54 Key Data Information from Secondary Sources
Table 55 Key Data Information from Primary Sources
List of Figures
Figure 1 Market Scope
Figure 2 Porter’s Five Forces
Figure 3 Global Rewards Credit Card Revenue (USD Million) By Type (2018-2022)
Figure 4 Global Rewards Credit Card Revenue Market Share (%) By Type (2022)
Figure 5 Global Rewards Credit Card Revenue (USD Million) By Applications (2018-2022)
Figure 6 Global Rewards Credit Card Revenue Market Share (%) By Applications (2022)
Figure 7 Global Rewards Credit Card Market Revenue (USD Million) By Regions (2018-2022)
Figure 8 Global Rewards Credit Card Market Share (%) By Regions (2022)
Figure 9 North America Rewards Credit Card Revenue (USD Million) By Country (2018-2022)
Figure 10 North America Rewards Credit Card Revenue (USD Million) By Type (2018-2022)
Figure 11 North America Rewards Credit Card Revenue (USD Million) By Applications (2018-2022)
Figure 12 Europe Rewards Credit Card Revenue (USD Million) By Country (2018-2022)
Figure 13 Europe Rewards Credit Card Revenue (USD Million) By Type (2018-2022)
Figure 14 Europe Rewards Credit Card Revenue (USD Million) By Applications (2018-2022)
Figure 15 Asia Pacific Rewards Credit Card Revenue (USD Million) By Country (2018-2022)
Figure 16 Asia Pacific Rewards Credit Card Revenue (USD Million) By Type (2018-2022)
Figure 17 Asia Pacific Rewards Credit Card Revenue (USD Million) By Applications (2018-2022)
Figure 18 South America Rewards Credit Card Revenue (USD Million) By Country (2018-2022)
Figure 19 South America Rewards Credit Card Revenue (USD Million) By Type (2018-2022)
Figure 20 South America Rewards Credit Card Revenue (USD Million) By Applications (2018-2022)
Figure 21 Middle East and Africa Rewards Credit Card Revenue (USD Million) By Region (2018-2022)
Figure 22 Middle East and Africa Rewards Credit Card Revenue (USD Million) By Type (2018-2022)
Figure 23 Middle East and Africa Rewards Credit Card Revenue (USD Million) By Applications (2018-2022)
Figure 24 Global Rewards Credit Card Revenue (USD Million) By Type (2023-2030)
Figure 25 Global Rewards Credit Card Revenue Market Share (%) By Type (2030)
Figure 26 Global Rewards Credit Card Revenue (USD Million) By Applications (2023-2030)
Figure 27 Global Rewards Credit Card Revenue Market Share (%) By Applications (2030)
Figure 28 Global Rewards Credit Card Market Revenue (USD Million) By Regions (2023-2030)
Figure 29 North America Rewards Credit Card Revenue (USD Million) By Country (2023-2030)
Figure 30 North America Rewards Credit Card Revenue (USD Million) By Type (2023-2030)
Figure 31 North America Rewards Credit Card Revenue (USD Million) By Applications (2023-2030)
Figure 32 Europe Rewards Credit Card Revenue (USD Million) By Country (2023-2030)
Figure 33 Europe Rewards Credit Card Revenue (USD Million) By Type (2023-2030)
Figure 34 Europe Rewards Credit Card Revenue (USD Million) By Applications (2023-2030)
Figure 35 Asia Pacific Rewards Credit Card Revenue (USD Million) By Country (2023-2030)
Figure 36 Asia Pacific Rewards Credit Card Revenue (USD Million) By Type (2023-2030)
Figure 37 Asia Pacific Rewards Credit Card Revenue (USD Million) By Applications (2023-2030)
Figure 38 South America Rewards Credit Card Revenue (USD Million) By Country (2023-2030)
Figure 39 South America Rewards Credit Card Revenue (USD Million) By Type (2023-2030)
Figure 40 South America Rewards Credit Card Revenue (USD Million) By Applications (2023-2030)
Figure 41 Middle East and Africa Rewards Credit Card Revenue (USD Million) By Region (2023-2030)
Figure 42 Middle East and Africa Rewards Credit Card Revenue (USD Million) By Region (2023-2030)
Figure 43 Middle East and Africa Rewards Credit Card Revenue (USD Million) By Type (2023-2030)
Figure 44 Middle East and Africa Rewards Credit Card Revenue (USD Million) By Applications (2023-2030)
Figure 45 Bottom-Up and Top-Down Approaches for This Report
Figure 46 Data Triangulation
