
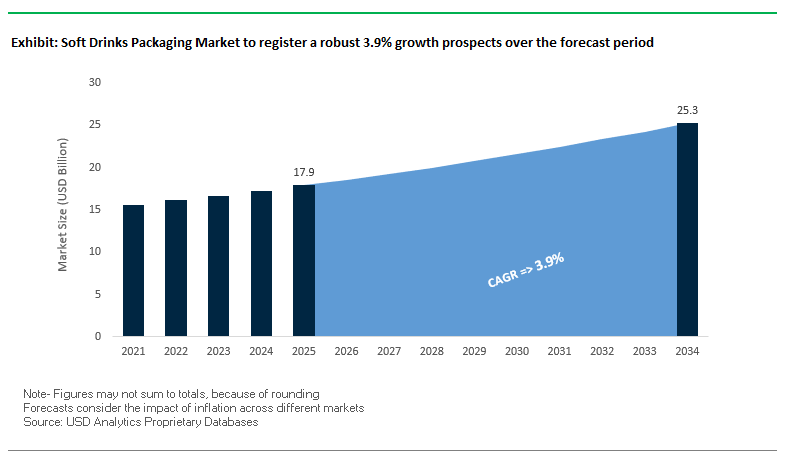
The global soft drinks packaging market is projected to grow from $17.9 billion in 2025 to $25.3 billion by 2034, at a CAGR of 3.9%. This growth is driven by consumer demand for convenience, sustainability, and innovative packaging formats. Plastic remains the dominant material, favored for its lightweight, cost-effectiveness, and ease of handling. Companies are increasingly integrating recycled content into packaging to align with environmental goals, while medium-sized formats are gaining popularity for on-the-go consumption.
The soft drinks packaging market is seeing strong strategic activity and innovation to meet sustainability and efficiency goals. In August 2025, Keurig Dr Pepper announced its intent to acquire JDE Peet's for approximately €15.7 billion, creating a global coffee and refreshment powerhouse. Amcor, in July 2025, completed the acquisition of Berry Global, consolidating its position as a leader in consumer and healthcare packaging solutions.
In May 2025, Keurig Dr Pepper introduced new plastic- and aluminum-free pods, enhancing sustainability in its packaging portfolio. April 2025 saw Amcor unveil an automated shrink film converting unit in Texas, improving production efficiency for beverage packaging. In March 2025, Smurfit Kappa launched a paper-based packaging series for e-commerce in Europe, focusing on lightweight, protective, and easy-to-assemble designs.
The market is also experiencing significant consolidation in reusable packaging. In February 2025, the merger of IPL and Schoeller Allibert created a $1.4 billion reusable packaging leader. Sustainability remains central: Coca-Cola, in December 2024, updated its environmental goals to use 35–40% recycled material in primary packaging by 2035.
Lightweighting has become a cornerstone of the soft drinks packaging industry, driven by corporate sustainability goals and the need to reduce costs across the supply chain. Advanced blow molding technologies introduced in 2025 now enable PET bottles that are 10–15% lighter than earlier designs, while maintaining strength, shelf life, and barrier properties. This engineering efficiency translates into measurable environmental and financial savings.
For example, Coca-Cola’s World Without Waste program has integrated lightweighting as a key component of its circular packaging strategy. In 2024 alone, the company reported avoiding the use of 80 million pounds of virgin plastic in the U.S., equivalent to nearly 2 billion bottles. This achievement highlights the quantifiable benefits of material reduction for both carbon footprint mitigation and supply chain optimization.
Lightweighting also reduces transportation emissions and costs since lighter bottles lower logistics fuel consumption. With packaging often accounting for 20–30% of a beverage’s carbon footprint, this initiative is a direct lever for climate goals. The trend is reinforced by regulatory and consumer pressures, as both governments and environmentally conscious consumers increasingly evaluate brands on their sustainability credentials.
In the value chain, lightweighting is driving greater collaboration between resin producers, packaging machinery suppliers, and beverage companies. This integration ensures that performance, aesthetics, and sustainability are achieved simultaneously—positioning lightweighting as both an economic and ecological imperative in the global soft drinks packaging market.
One of the most transformative shifts in the soft drinks packaging market is the adoption of 100% rPET bottles across leading global brands. In January 2025, Coca-Cola rolled out 100% rPET bottles nationwide in the U.S. for its flagship 20-oz products, including Coca-Cola, Diet Coke, and Coke Zero. PepsiCo is equally advancing this transition, pledging 100% rPET bottles across nine European markets, signaling a global industry-wide race toward recycled content integration.
This rapid adoption is creating a new competitive battleground around securing food-grade rPET supply. In Asia, Coca-Cola’s bottling partner launched PETValue Philippines, a recycling facility with an annual capacity of 2 billion bottles, ensuring localized feedstock for its operations. Such investments showcase how the industry is building dedicated rPET ecosystems to guarantee supply continuity.
The sustainability and regulatory implications are equally strong. rPET reduces carbon emissions by up to 66% compared to virgin PET, aligning with EU PPWR mandates and U.S. state-level EPR regulations. Beyond compliance, rPET also strengthens brand positioning with eco-conscious consumers who increasingly evaluate packaging choices as part of purchase decisions.
For resin suppliers and recyclers, the opportunity lies in scaling food-grade rPET capacity to match brand commitments. This transition is not only reshaping supply chains but also creating a new premium commodity market where high-quality rPET commands a higher value than virgin plastic, fundamentally altering pricing dynamics in the sector.
While mechanical recycling has enabled significant rPET adoption, its limitations in feedstock quality and color consistency leave gaps in supply. This opens a critical opportunity for advanced chemical recycling technologies such as pyrolysis and depolymerization. Unlike mechanical processes, these methods break plastics down into their molecular building blocks, enabling the production of virgin-quality resins even from contaminated or multi-layer plastics.
Dow and other resin producers are scaling projects to meet this need. For instance, Dow’s new chemical recycling facilities can process up to 65,000 metric tons annually of hard-to-recycle waste, directly converting it into food-grade packaging resins. This represents a breakthrough for the soft drinks packaging market, where consistent feedstock quality is paramount to scale 100% rPET adoption globally.
By unlocking circularity for colored bottles, multilayer laminates, and post-consumer waste, chemical recycling creates a sustainable feedstock loop that is otherwise inaccessible. For beverage brands, the adoption of chemically recycled content provides a pathway to regulatory compliance and corporate sustainability commitments, while ensuring material performance parity with virgin PET.
This emerging infrastructure will also redefine partnerships in the value chain, with beverage companies, chemical producers, and waste management firms investing jointly in recycling hubs. The commercialization of chemical recycling is therefore not just a technological evolution but a strategic enabler of circular packaging economies in the global soft drinks sector.
Another breakthrough opportunity in the soft drinks packaging industry lies in the integration of digital watermarking technologies to enhance recycling efficiency. The HolyGrail 2.0 project demonstrated industrial-scale success in 2024, achieving over 90% detection efficiency during trials in Germany, processing 56,000 items daily. These imperceptible codes, embedded in packaging, allow recycling facilities to distinguish SKUs, materials, and even food-grade vs. non-food-grade plastics with unprecedented precision.
This capability is a game-changer for increasing the availability of high-purity food-grade rPET. Traditional sorting systems struggle to separate beverage bottles from non-food PET, creating a bottleneck in recycling efficiency. Digital watermarking solves this by enabling SKU-level sorting, ensuring that the recycled stream remains uncontaminated and suitable for direct reuse in beverage packaging.
Beyond recycling, digital watermarks also unlock new avenues for consumer engagement and supply chain transparency. Each bottle can carry a unique digital identity, scannable by consumers to provide information on product origin, authenticity, or brand campaigns. This dual functionality strengthens brand loyalty while driving circular packaging compliance.
As regulations such as the EU Packaging and Packaging Waste Regulation (PPWR) push for higher recycled content and closed-loop systems, digital watermarks provide a scalable, cost-effective solution. For beverage companies and recyclers, investing in digital sorting represents not only a compliance measure but also a strategic differentiator in building a transparent, traceable, and circular value chain.
The soft drinks packaging market is shaped by global players integrating advanced materials, sustainability initiatives, and innovative designs to meet evolving consumer and regulatory demands.
Coca-Cola offers a wide range of beverages in glass, plastic, aluminum, and refillable packaging formats. The company is focused on its “World Without Waste” initiative, targeting 35–40% recycled material in primary packaging and collecting 70–75% of packaging by 2035. In December 2024, Coca-Cola announced updated environmental goals, with over 95% of primary packaging designed to be recyclable. Its core strengths include iconic brands, global distribution, and commitment to sustainability.
PepsiCo’s portfolio includes Pepsi, Mountain Dew, and Gatorade, offered in plastic bottles, aluminum cans, and paper-based packaging. Its sustainability strategy, “PepsiCo Positive,” focuses on circularity and recycled materials. In 2024, PepsiCo launched the first 100% rPET carbonated beverage bottle in Taiwan and the first energy drink in India using rPET. The company’s open innovation platform supports exploration of new technologies and sustainable packaging solutions.
Keurig Dr Pepper (KDP) offers a portfolio of hot and cold beverages with the Keurig® brewing system. KDP aims for 100% recyclable or compostable packaging with 30% post-consumer recycled content by 2025. In August 2025, KDP announced the acquisition of JDE Peet's, expanding its global footprint. By 2024, 96% of its packaging was recyclable or compostable, with a 17% reduction in virgin plastic since 2019.
Nestlé offers soft drinks, water, and other beverages with a focus on reducing environmental footprint. Its 2024 innovations included high-barrier paper refill packs for Nescafé in the UK, cutting packaging weight by 97%. By 2025, Nestlé aims to reduce virgin plastics in packaging by one-third. The company’s key offerings, including Nescafé and Vital Proteins, utilize sustainable packaging to drive circular economy adoption.
Danone focuses on health-centric beverages, including dairy, plant-based products, and waters. Its “Renew” strategy enhances market agility and local responsiveness. In August 2025, Danone invested in its Minster, Ohio, yogurt facility and acquired a majority stake in Kate Farms, a plant-based nutrition company. Core strengths include health-focused product portfolios and sustainable packaging innovation.
Suntory Holdings Limited: Global Beverage Leader Advancing Circular Packaging by 2030
Suntory provides a wide range of alcoholic and non-alcoholic beverages. Its sustainability strategy targets all plastic bottles globally to be sustainable by 2030, while reducing GHG emissions to net zero by 2050. The company is expanding its product portfolio and distribution network across Americas, Europe, Asia, and Oceania, with a focus on health, wellness, and sustainability.
Bottles account for 45% of the global soft drinks packaging market, cementing their leadership position due to their unmatched versatility, cost-efficiency, and scalability. PET bottles, in particular, are the standard for carbonated soft drinks (CSDs) and bottled water, which represent the highest-volume categories worldwide. Their lightweight nature reduces transportation costs, while their clarity and shatter resistance ensure product safety and consumer appeal. The sector’s investment focus on rPET integration and light-weighting technologies further reinforces bottles’ dominance, aligning with sustainability mandates without sacrificing performance. Although aluminum cans and pouches are gaining traction, bottles remain the default format for both single-serve and multi-serve consumption in virtually every region.
Medium-sized packaging (251 ml to 1 liter) holds 50% of the global soft drinks packaging market, making it the mainstream format for both retail and on-the-go consumption. The dominance of this segment reflects its optimal balance between convenience and value: formats like the 330 ml aluminum can, 500 ml PET bottle, and 1 liter multi-serve options are universally adopted across supermarkets, vending machines, and convenience stores. Medium formats also cater to diverse product categories, from carbonated beverages to energy drinks, driving their extensive uptake. This segment’s scale is further amplified by its adaptability to sustainability initiatives such as light-weighted PET bottles and recyclable aluminum cans, ensuring its continued centrality in the packaging landscape.
The European Union soft drinks packaging market is undergoing a regulatory transformation under the Packaging and Packaging Waste Regulation (PPWR), which became effective in February 2025. This legislation requires all plastic packaging, including soft drink bottles, to contain minimum recycled content from post-consumer waste by 2030, compelling manufacturers to scale up food-grade rPET production. Furthermore, the regulation introduces a Digital Product Passport, which will improve transparency by disclosing information on material composition, recyclability, and compliance, enhancing traceability across the packaging lifecycle.
The EU is also prioritizing refill and reuse systems, setting targets to achieve 10% reusable beverage containers by 2030. In addition, Deposit Return Schemes (DRS) must be implemented across all member states, aiming to collect at least 90% of single-use plastic bottles and metal beverage containers by 2029. This directive is shaping the competitive dynamics of the beverage sector, with companies investing in reverse logistics and material innovation. Another significant development is the restriction on per- and polyfluoroalkyl substances (PFAS) in food contact packaging by August 2026, which is accelerating R&D into PFAS-free barrier coatings for soft drink containers.
The United States soft drinks packaging market is moving toward sustainability and lightweighting, influenced by national recycling initiatives and corporate commitments. The U.S. Environmental Protection Agency (EPA) has set a goal of 50% recycling by 2030, prompting beverage giants to scale up recyclable packaging. A landmark example is The Coca-Cola Company’s July 2024 launch of 100% rPET bottles across its Coca-Cola Trademark line, underscoring the industry’s pivot toward circular packaging models.
Companies are also embracing lightweight packaging strategies to reduce costs in logistics while maintaining product safety. At the same time, smart packaging trends such as digital printing and QR-enabled labels are gaining traction, allowing brands to deliver sourcing, recycling, and authenticity information directly to consumers. Convenience-driven demand is shaping material choices, with ready-to-drink beverages fueling growth in eco-friendly packaging formats such as recyclable PET, aluminum, and compostable paper-based bottles.
The China soft drinks packaging market is being reshaped by regulatory and consumer dynamics. The NDRC and MEE, under the 14th Five-Year Plan, are advancing stringent measures to curb plastic pollution, while new food labeling standards introduced in March 2025 allow manufacturers to use digital barcodes and QR codes to provide consumers with product details. This policy aligns with the government’s June 2025 regulations requiring express delivery companies to adopt eco-friendly, reduced, and reusable packaging.
On the demand side, China’s beverage sector is witnessing a strong push toward premium and luxury soft drinks, with packaging innovation centered on 3D embossing, gold foiling, and high-end label printing. This trend, coupled with the government’s emphasis on remanufacturing and tax incentives for sustainable technology, is boosting the adoption of smart and sustainable soft drink packaging formats in e-commerce and retail.
The India soft drinks packaging market is being driven by regulatory frameworks that enforce accountability and traceability. The Plastic Waste Management (Amendment) Rules, 2024, effective April 2025, emphasize Extended Producer Responsibility (EPR) for producers, importers, and brand owners. By July 1, 2025, all plastic beverage packaging must be traceable via barcodes or QR codes, making it easier to monitor compliance and recycling rates.
While MSMEs are exempt from EPR obligations, larger manufacturers and importers bear full responsibility for packaging sustainability. The government’s investment in reverse logistics systems is a major step toward improving collection and recycling of soft drink bottles. With India’s growing e-commerce and retail expansion, combined with rising per capita consumption of carbonated and non-carbonated beverages, demand for eco-friendly, recyclable PET bottles and lightweight flexible pouches is accelerating rapidly.
The United Kingdom soft drinks packaging market is moving toward a stricter regulatory environment with the introduction of Extended Producer Responsibility (EPR) for packaging in October 2025. This will make beverage manufacturers fully responsible for collection, recycling, and disposal costs, driving companies to redesign packaging with higher recycled plastic content.
In addition, the Plastic Packaging Tax, introduced earlier, charges £200 per tonne on plastic packaging with less than 30% recycled plastic, directly incentivizing manufacturers to increase rPET adoption. The UK is also preparing to launch a Deposit Return Scheme (DRS) in October 2027, while Scotland has already implemented its own DRS covering PET, steel, and aluminum beverage containers. These initiatives collectively position the UK as a leader in deposit-led recycling systems for soft drink packaging.
The Brazil soft drinks packaging market is regulated under the National Solid Waste Policy (PNRS), which emphasizes responsible reuse, recycling, and reduction of packaging waste. The enactment of Law No. 15,088 in January 2025, which bans the import of plastic waste, is pushing domestic manufacturers to adopt sustainable materials and strengthen internal recycling systems.
The Brazilian government is also promoting a reverse logistics framework where producers are held accountable for the post-consumer collection and recycling of their soft drink packaging. This is especially critical in a country with rising soft drink consumption and a growing middle-class demand for affordable, recyclable PET bottles, aluminum cans, and glass packaging. These policies are reinforcing the country’s transition toward a circular packaging economy.
|
Parameter |
Details |
|
Market Size (2025) |
$17.9 Billion |
|
Market Size (2034) |
$25.3 Billion |
|
Market Growth Rate |
3.9% |
|
Segments |
By Material (Plastic, Metal, Glass, Paper & Paperboard, Others), By Product Type (Bottles, Cans, Cartons, Pouches, Others), By Capacity (Small, Medium, Large) |
|
Study Period |
2019- 2024 and 2025-2034 |
|
Units |
Revenue (USD) |
|
Qualitative Analysis |
Porter’s Five Forces, SWOT Profile, Market Share, Scenario Forecasts, Market Ecosystem, Company Ranking, Market Dynamics, Industry Benchmarking |
|
Companies |
Amcor plc, Ardagh Group, Ball Corporation, Berry Global, Inc., Crown Holdings Inc., Tetra Pak Inc., SIG Combibloc Group AG, Graphic Packaging Holding Company, O-I Glass, Inc., WestRock Company, Pactiv Evergreen, CPCM Holdings Ltd., Visy Industries, Silgan Holdings Inc., Plastipak Holdings, Inc. |
|
Countries |
US, Canada, Mexico, Germany, France, Spain, Italy, UK, Russia, China, India, Japan, South Korea, Australia, South East Asia, Brazil, Argentina, Middle East, Africa |
* List Not Exhaustive
The research methodology for the Soft Drinks Packaging Market combines extensive primary and secondary research to provide accurate, actionable insights for industry professionals. USDAnalytics conducted primary interviews with packaging engineers, beverage brand managers, sustainability officers, and supply chain experts across key regions including North America, Europe, Asia-Pacific, India, and Brazil. Secondary research involved the analysis of corporate annual reports, sustainability disclosures, regulatory filings, academic journals, and verified industry publications. Data triangulation was applied to validate market sizing, CAGR projections, and adoption trends across materials, formats, and capacities. Top-down and bottom-up approaches were used to forecast the market, incorporating factors such as rPET adoption, lightweighting technologies, chemical recycling infrastructure, digital watermark integration, and regulatory frameworks like EPR, PPWR, and PNRS. Regional insights were contextualized against government policies, sustainability initiatives, and consumer preferences for convenience, recyclability, and innovative packaging formats. This comprehensive methodology ensures the report delivers fact-based, reliable intelligence for strategic decision-making and market expansion planning in the soft drinks packaging sector.
Table of Contents: Soft Drinks Packaging Market
1. Executive Summary
1.1. Market Highlights
1.2. Key Findings
1.3. Global Market Snapshot
2. Soft Drinks Packaging Market Landscape & Outlook (2025–2034)
2.1. Introduction to Soft Drinks Packaging Market
2.2. Market Valuation and Growth Projections (2025–2034)
2.3. Market Drivers and Restraints
2.4. Regulatory Environment Overview
2.5. Consumer Trends and Preferences
3. Innovations Reshaping the Soft Drinks Packaging Market
3.1. Trend: Strategic Lightweighting and Material Reduction Initiatives
3.2. Trend: Rapid Conversion to 100% Recycled PET (rPET) Across Portfolios
3.3. Opportunity: Development of Advanced Chemical Recycling Infrastructure
3.4. Opportunity: Integration of Digital Watermarks for Intelligent Sorting
4. Competitive Landscape and Strategic Initiatives
4.1. Mergers, Acquisitions and Strategic Alliances
4.2. R&D and Material Innovation
4.3. Sustainability and Strategies
4.4. Market Expansion and Regional Focus
5. Market Share and Segmentation Insights: Soft Drinks Packaging Market
5.1. By Material
5.1.1. Plastic
5.1.2. Metal
5.1.3. Glass
5.1.4. Paper & Paperboard
5.1.5. Others
5.2. By Product Type
5.2.1. Bottles
5.2.2. Cans
5.2.3. Cartons
5.2.4. Pouches
5.2.5. Others
5.3. By Capacity
5.3.1. Small
5.3.2. Medium
5.3.3. Large
6. Country Analysis and Outlook of Soft Drinks Packaging Market
6.1. United States
6.2. Canada
6.3. Mexico
6.4. Germany
6.5. France
6.6. Spain
6.7. Italy
6.8. UK
6.9. Russia
6.10. China
6.11. India
6.12. Japan
6.13. South Korea
6.14. Australia
6.15. South East Asia
6.16. Brazil
6.17. Argentina
6.18. Middle East
6.19. Africa
7. Soft Drinks Packaging Market Size Outlook by Region (2025–2034)
7.1. North America Soft Drinks Packaging Market Size Outlook to 2034
7.1.1. By Material
7.1.2. By Product Type
7.1.3. By Capacity
7.2. Europe Soft Drinks Packaging Market Size Outlook to 2034
7.2.1. By Material
7.2.2. By Product Type
7.2.3. By Capacity
7.3. Asia Pacific Soft Drinks Packaging Market Size Outlook to 2034
7.3.1. By Material
7.3.2. By Product Type
7.3.3. By Capacity
7.4. South America Soft Drinks Packaging Market Size Outlook to 2034
7.4.1. By Material
7.4.2. By Product Type
7.4.3. By Capacity
7.5. Middle East and Africa Soft Drinks Packaging Market Size Outlook to 2034
7.5.1. By Material
7.5.2. By Product Type
7.5.3. By Capacity
8. Company Profiles: Leading Players in the Soft Drinks Packaging Market
8.1. Amcor plc
8.2. Ardagh Group
8.3. Ball Corporation
8.4. Berry Global, Inc.
8.5. Crown Holdings Inc.
8.6. Tetra Pak Inc.
8.7. SIG Combibloc Group AG
8.8. Graphic Packaging Holding Company
8.9. O-I Glass, Inc.
8.10. WestRock Company
8.11. Pactiv Evergreen
8.12. CPCM Holdings Ltd.
8.13. Visy Industries
8.14. Silgan Holdings Inc.
8.15. Plastipak Holdings, Inc.
9. Methodology
9.1. Research Scope
9.2. Market Research Approach
9.3. Market Sizing and Forecasting Model
9.4. Research Coverage
9.5. Data Horizon
9.6. Deliverables
10. Appendix
10.1. Acronyms and Abbreviations
10.2. List of Tables
10.3. List of Figures
The global soft drinks packaging market is expected to grow from USD 17.9 billion in 2025 to USD 25.3 billion by 2034, at a CAGR of 3.9%. Growth is fueled by demand for sustainable, convenient, and innovative packaging formats across beverages.
Plastic remains the leading material due to its lightweight nature, cost efficiency, and versatility. PET bottles, in particular, dominate for carbonated drinks and bottled water, with increasing integration of recycled content to meet sustainability goals.
Sustainability drives adoption of 100% rPET, lightweight bottles, chemical recycling, and digital watermarking for efficient sorting. Brands like Coca-Cola and PepsiCo are investing in circular packaging to reduce carbon emissions, improve recyclability, and align with regulatory mandates.
Bottles account for 45% of the market by product type, while medium-sized packaging (251 ml–1 L) holds 50% of market share by capacity. These formats balance convenience, cost-efficiency, and sustainability, making them the preferred choice for retail and on-the-go consumption.
Leading companies include Coca-Cola, PepsiCo, Keurig Dr Pepper, Nestlé, Danone, Amcor, and Ball Corporation. They focus on sustainable materials, circular packaging strategies, advanced lightweighting, and technology-enabled solutions such as digital watermarks and smart labeling to enhance both environmental compliance and consumer engagement.