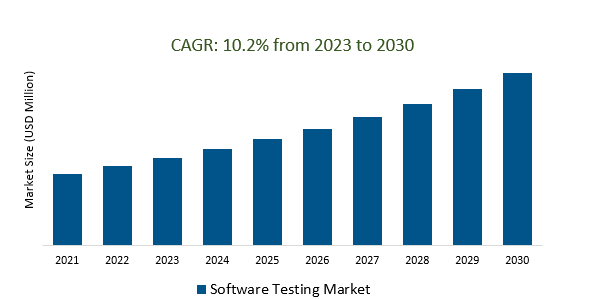
The Global Software Testing Market Size is estimated to register 10.2% growth over the forecast period from 2023 to 2030.
Software Testing Market Overview
Test automation is continuing to gain momentum, driven by the need for faster delivery, enhanced test coverage, and reduced time-to-market. Testing is evolving to align with the rapid development and deployment cycles of Agile and DevOps, promoting faster, iterative testing processes. The market is witnessing increased demand for tools and methodologies addressing vulnerabilities, ensuring robust security measures within applications. The need to adapt to digital advancements is driving the demand for effective testing methodologies and tools. Organizations prioritizing user-centric design and user experience (UX) to meet customer expectations are fueling the demand. The adoption of the Shift Left approach, focusing on early testing in the software development lifecycle, drives the integration of testing practices at the initial stages.
Software Testing Market Market Dynamics
Market Trends- Role of Automation and Continuous Testing in Evolving Software Testing Market.
The need for faster time-to-market and increased test coverage fuels the adoption of test automation. Automated testing tools and frameworks streamline repetitive tasks, reduce manual efforts, and enhance overall testing efficiency. Continuous Testing, emerging as a crucial trend, aiming to embed testing practices throughout the development pipeline which promotes collaboration among multidisciplinary teams, enabling prompt bug identification, faster issue resolution, and immediate feedback on software modification are fueling the demand.
Further, Businesses are seeking holistic solutions that combine robust test automation capabilities with the continuous validation of software functionality.
Market Driver- Shift to Cloud-Based Testing in the Software Testing Market drives the demand.
On-demand resources and scalable infrastructure, allowing organizations to promptly adapt to fluctuating testing needs without upfront capital investments offering by cloud the key factors. The real-time collaboration, allowing stakeholders, developers, and testers to work cohesively on projects, enhancing communication and productivity while reducing time lags associated with traditional testing setups are fueling the demand.
Further, the rapid provisioning of testing environments and resources, reducing setup times and enabling quicker deployment of test environments are contributing to market growth.
Market Opportunity- Rising Open Source and Low-Code/No-Code Testing Tools in the market.
The increasing adoption of Open-Source Testing Tools, driven by their cost-effectiveness, flexibility, and robust community support. Further, the collaborative nature of open-source communities fosters continuous innovation and rapid development of testing tools. Low-Code/No-Code Testing Tools are empowering business users, domain experts, and testers to contribute to the testing lifecycle, reducing dependencies on specialized technical resources, thereby raising the market.
Additionally, cost efficiency is playing a pivotal role as organizations seek cost-effective alternatives without compromising quality.
Market Share Analysis- in Software Testing Market will register the fastest growth.
The Global Software Testing Market is analyzed across Application testing & Services. Application testing is poised to register the fastest growth. Application Testing stands as a cornerstone within the Software Testing Market, playing a pivotal role in ensuring the reliability, functionality, and overall quality of software applications across various industries. The significance of Application Testing arises from its ability to identify and rectify defects, glitches, or vulnerabilities within software, thereby mitigating risks associated with faulty applications. Functional Testing constitutes a significant part of Application Testing, focusing on verifying that the software functions are in line with the specified requirements. Further, Performance Testing, another critical aspect, assesses the application's responsiveness, scalability, and reliability under different conditions, thereby fueling the demand.
Market Share Analysis- BFSI held a significant market share in 2023.
The Global Software Testing Market is analyzed across various applications including IT and Telecom, BFSI, Manufacturing, Retail, Healthcare, Transportation and Logistics, Government & Others. Of these, - BFSI held a significant market share in 2023. The BFSI industry relies heavily on software applications to manage financial transactions, customer data, risk assessment, compliance, and various other critical operations. Given the sensitivity and complexity of financial systems, ensuring the reliability, security, and regulatory compliance of software applications is of paramount importance. This sector's dependence on technology to deliver efficient and secure financial services drives the continuous need for rigorous testing processes to maintain customer trust, protect sensitive data, and prevent potential financial risks.
Software Testing Market Segmentation
By Type
- Application Testing
- Services
By Application
- IT and Telecom
- BFSI
- Manufacturing
- Retail
- Healthcare
- Transportation and Logistics
- Government
- Others
By Region
- North America (United States, Canada, Mexico)
- Europe (Germany, France, United Kingdom, Spain, Italy, Others)
- Asia Pacific (China, India, Japan, South Korea, Australia, Others)
- Latin America (Brazil, Argentina, Others)
- Middle East and Africa (Saudi Arabia, UAE, Kuwait, Other Middle East, South Africa, Nigeria, Other Africa)
Software Testing Market Companies
- Infosys
- Capgemini
- HCL Tech
- Tech Mahindra
- SQS
- Cigniti
- Cognizant
- TCS
- Atos
- CSC
- HPE
- CGI
- NTT Data
- Qualitest
- Wipro
*List not exhaustive
Software Testing Market Outlook 2023
1 Market Overview
1.1 Introduction to the Software Testing Market
1.2 Scope of the Study
1.3 Research Objective
1.3.1 Key Market Scope and Segments
1.3.2 Players Covered
1.3.3 Years Considered
2 Executive Summary
2.1 2023 Software Testing Industry- Market Statistics
3 Market Dynamics
3.1 Market Drivers
3.2 Market Challenges
3.3 Market Opportunities
3.4 Market Trends
4 Market Factor Analysis
4.1 Porter’s Five Forces
4.2 Market Entropy
4.2.1 Global Software Testing Market Companies with Area Served
4.2.2 Products Offerings Global Software Testing Market
5 COVID-19 Impact Analysis and Outlook Scenarios
5.1.1 Covid-19 Impact Analysis
5.1.2 post-COVID-19 Scenario- Low Growth Case
5.1.3 post-COVID-19 Scenario- Reference Growth Case
5.1.4 post-COVID-19 Scenario- Low Growth Case
6 Global Software Testing Market Trends
6.1 Global Software Testing Revenue (USD Million) and CAGR (%) by Type (2018-2030)
6.2 Global Software Testing Revenue (USD Million) and CAGR (%) by Applications (2018-2030)
6.3 Global Software Testing Revenue (USD Million) and CAGR (%) by regions (2018-2030)
7 Global Software Testing Market Revenue (USD Million) by Type, and Applications (2018-2022)
7.1 Global Software Testing Revenue (USD Million) by Type (2018-2022)
7.1.1 Global Software Testing Revenue (USD Million), Market Share (%) by Type (2018-2022)
7.2 Global Software Testing Revenue (USD Million) by Applications (2018-2022)
7.2.1 Global Software Testing Revenue (USD Million), Market Share (%) by Applications (2018-2022)
8 Global Software Testing Development Regional Status and Outlook
8.1 Global Software Testing Revenue (USD Million) By Regions (2018-2022)
8.2 North America Software Testing Revenue (USD Million) by Type, and Application (2018-2022)
8.2.1 North America Software Testing Revenue (USD Million) by Country (2018-2022)
8.2.2 North America Software Testing Revenue (USD Million) by Type (2018-2022)
8.2.3 North America Software Testing Revenue (USD Million) by Applications (2018-2022)
8.3 Europe Software Testing Revenue (USD Million), by Type, and Applications (USD Million) (2018-2022)
8.3.1 Europe Software Testing Revenue (USD Million), by Country (2018-2022)
8.3.2 Europe Software Testing Revenue (USD Million) by Type (2018-2022)
8.3.3 Europe Software Testing Revenue (USD Million) by Applications (2018-2022)
8.4 Asia Pacific Software Testing Revenue (USD Million), and Revenue (USD Million) by Type, and Applications (2018-2022)
8.4.1 Asia Pacific Software Testing Revenue (USD Million) by Country (2018-2022)
8.4.2 Asia Pacific Software Testing Revenue (USD Million) by Type (2018-2022)
8.4.3 Asia Pacific Software Testing Revenue (USD Million) by Applications (2018-2022)
8.5 South America Software Testing Revenue (USD Million), by Type, and Applications (2018-2022)
8.5.1 South America Software Testing Revenue (USD Million), by Country (2018-2022)
8.5.2 South America Software Testing Revenue (USD Million) by Type (2018-2022)
8.5.3 South America Software Testing Revenue (USD Million) by Applications (2018-2022)
8.6 Middle East and Africa Software Testing Revenue (USD Million), by Type, Technology, Application, Thickness (2018-2022)
8.6.1 Middle East and Africa Software Testing Revenue (USD Million) by Country (2018-2022)
8.6.2 Middle East and Africa Software Testing Revenue (USD Million) by Type (2018-2022)
8.6.3 Middle East and Africa Software Testing Revenue (USD Million) by Applications (2018-2022)
9 Company Profiles
10 Global Software Testing Market Revenue (USD Million), by Type, and Applications (2023-2030)
10.1 Global Software Testing Revenue (USD Million) and Market Share (%) by Type (2023-2030)
10.1.1 Global Software Testing Revenue (USD Million), and Market Share (%) by Type (2023-2030)
10.2 Global Software Testing Revenue (USD Million) and Market Share (%) by Applications (2023-2030)
10.2.1 Global Software Testing Revenue (USD Million), and Market Share (%) by Applications (2023-2030)
11 Global Software Testing Development Regional Status and Outlook Forecast
11.1 Global Software Testing Revenue (USD Million) By Regions (2023-2030)
11.2 North America Software Testing Revenue (USD Million) by Type, and Applications (2023-2030)
11.2.1 North America Software Testing Revenue (USD) Million by Country (2023-2030)
11.2.2 North America Software Testing Revenue (USD Million), by Type (2023-2030)
11.2.3 North America Software Testing Revenue (USD Million), Market Share (%) by Applications (2023-2030)
11.3 Europe Software Testing Revenue (USD Million), by Type, and Applications (2023-2030)
11.3.1 Europe Software Testing Revenue (USD Million), by Country (2023-2030)
11.3.2 Europe Software Testing Revenue (USD Million), by Type (2023-2030)
11.3.3 Europe Software Testing Revenue (USD Million), by Applications (2023-2030)
11.4 Asia Pacific Software Testing Revenue (USD Million) by Type, and Applications (2023-2030)
11.4.1 Asia Pacific Software Testing Revenue (USD Million), by Country (2023-2030)
11.4.2 Asia Pacific Software Testing Revenue (USD Million), by Type (2023-2030)
11.4.3 Asia Pacific Software Testing Revenue (USD Million), by Applications (2023-2030)
11.5 South America Software Testing Revenue (USD Million), by Type, and Applications (2023-2030)
11.5.1 South America Software Testing Revenue (USD Million), by Country (2023-2030)
11.5.2 South America Software Testing Revenue (USD Million), by Type (2023-2030)
11.5.3 South America Software Testing Revenue (USD Million), by Applications (2023-2030)
11.6 Middle East and Africa Software Testing Revenue (USD Million), by Type, and Applications (2023-2030)
11.6.1 Middle East and Africa Software Testing Revenue (USD Million), by region (2023-2030)
11.6.2 Middle East and Africa Software Testing Revenue (USD Million), by Type (2023-2030)
11.6.3 Middle East and Africa Software Testing Revenue (USD Million), by Applications (2023-2030)
12 Methodology and Data Sources
12.1 Methodology/Research Approach
12.1.1 Research Programs/Design
12.1.2 Market Size Estimation
12.1.3 Market Breakdown and Data Triangulation
12.2 Data Sources
12.2.1 Secondary Sources
12.2.2 Primary Sources
12.3 Disclaimer
List of Tables
Table 1 Market Segmentation Analysis
Table 2 Global Software Testing Market Companies with Areas Served
Table 3 Products Offerings Global Software Testing Market
Table 4 Low Growth Scenario Forecasts
Table 5 Reference Case Growth Scenario
Table 6 High Growth Case Scenario
Table 7 Global Software Testing Revenue (USD Million) And CAGR (%) By Type (2018-2030)
Table 8 Global Software Testing Revenue (USD Million) And CAGR (%) By Applications (2018-2030)
Table 9 Global Software Testing Revenue (USD Million) And CAGR (%) By Regions (2018-2030)
Table 10 Global Software Testing Revenue (USD Million) By Type (2018-2022)
Table 11 Global Software Testing Revenue Market Share (%) By Type (2018-2022)
Table 12 Global Software Testing Revenue (USD Million) By Applications (2018-2022)
Table 13 Global Software Testing Revenue Market Share (%) By Applications (2018-2022)
Table 14 Global Software Testing Market Revenue (USD Million) By Regions (2018-2022)
Table 15 Global Software Testing Market Share (%) By Regions (2018-2022)
Table 16 North America Software Testing Revenue (USD Million) By Country (2018-2022)
Table 17 North America Software Testing Revenue (USD Million) By Type (2018-2022)
Table 18 North America Software Testing Revenue (USD Million) By Applications (2018-2022)
Table 19 Europe Software Testing Revenue (USD Million) By Country (2018-2022)
Table 20 Europe Software Testing Revenue (USD Million) By Type (2018-2022)
Table 21 Europe Software Testing Revenue (USD Million) By Applications (2018-2022)
Table 22 Asia Pacific Software Testing Revenue (USD Million) By Country (2018-2022)
Table 23 Asia Pacific Software Testing Revenue (USD Million) By Type (2018-2022)
Table 24 Asia Pacific Software Testing Revenue (USD Million) By Applications (2018-2022)
Table 25 South America Software Testing Revenue (USD Million) By Country (2018-2022)
Table 26 South America Software Testing Revenue (USD Million) By Type (2018-2022)
Table 27 South America Software Testing Revenue (USD Million) By Applications (2018-2022)
Table 28 Middle East and Africa Software Testing Revenue (USD Million) By Region (2018-2022)
Table 29 Middle East and Africa Software Testing Revenue (USD Million) By Type (2018-2022)
Table 30 Middle East and Africa Software Testing Revenue (USD Million) By Applications (2018-2022)
Table 31 Financial Analysis
Table 32 Global Software Testing Revenue (USD Million) By Type (2023-2030)
Table 33 Global Software Testing Revenue Market Share (%) By Type (2023-2030)
Table 34 Global Software Testing Revenue (USD Million) By Applications (2023-2030)
Table 35 Global Software Testing Revenue Market Share (%) By Applications (2023-2030)
Table 36 Global Software Testing Market Revenue (USD Million), And Revenue (USD Million) By Regions (2023-2030)
Table 37 North America Software Testing Revenue (USD)By Country (2023-2030)
Table 38 North America Software Testing Revenue (USD Million) By Type (2023-2030)
Table 39 North America Software Testing Revenue (USD Million) By Applications (2023-2030)
Table 40 Europe Software Testing Revenue (USD Million) By Country (2023-2030)
Table 41 Europe Software Testing Revenue (USD Million) By Type (2023-2030)
Table 42 Europe Software Testing Revenue (USD Million) By Applications (2023-2030)
Table 43 Asia Pacific Software Testing Revenue (USD Million) By Country (2023-2030)
Table 44 Asia Pacific Software Testing Revenue (USD Million) By Type (2023-2030)
Table 45 Asia Pacific Software Testing Revenue (USD Million) By Applications (2023-2030)
Table 46 South America Software Testing Revenue (USD Million) By Country (2023-2030)
Table 47 South America Software Testing Revenue (USD Million) By Type (2023-2030)
Table 48 South America Software Testing Revenue (USD Million) By Applications (2023-2030)
Table 49 Middle East and Africa Software Testing Revenue (USD Million) By Region (2023-2030)
Table 50 Middle East and Africa Software Testing Revenue (USD Million) By Region (2023-2030)
Table 51 Middle East and Africa Software Testing Revenue (USD Million) By Type (2023-2030)
Table 52 Middle East and Africa Software Testing Revenue (USD Million) By Applications (2023-2030)
Table 53 Research Programs/Design for This Report
Table 54 Key Data Information from Secondary Sources
Table 55 Key Data Information from Primary Sources
List of Figures
Figure 1 Market Scope
Figure 2 Porter’s Five Forces
Figure 3 Global Software Testing Revenue (USD Million) By Type (2018-2022)
Figure 4 Global Software Testing Revenue Market Share (%) By Type (2022)
Figure 5 Global Software Testing Revenue (USD Million) By Applications (2018-2022)
Figure 6 Global Software Testing Revenue Market Share (%) By Applications (2022)
Figure 7 Global Software Testing Market Revenue (USD Million) By Regions (2018-2022)
Figure 8 Global Software Testing Market Share (%) By Regions (2022)
Figure 9 North America Software Testing Revenue (USD Million) By Country (2018-2022)
Figure 10 North America Software Testing Revenue (USD Million) By Type (2018-2022)
Figure 11 North America Software Testing Revenue (USD Million) By Applications (2018-2022)
Figure 12 Europe Software Testing Revenue (USD Million) By Country (2018-2022)
Figure 13 Europe Software Testing Revenue (USD Million) By Type (2018-2022)
Figure 14 Europe Software Testing Revenue (USD Million) By Applications (2018-2022)
Figure 15 Asia Pacific Software Testing Revenue (USD Million) By Country (2018-2022)
Figure 16 Asia Pacific Software Testing Revenue (USD Million) By Type (2018-2022)
Figure 17 Asia Pacific Software Testing Revenue (USD Million) By Applications (2018-2022)
Figure 18 South America Software Testing Revenue (USD Million) By Country (2018-2022)
Figure 19 South America Software Testing Revenue (USD Million) By Type (2018-2022)
Figure 20 South America Software Testing Revenue (USD Million) By Applications (2018-2022)
Figure 21 Middle East and Africa Software Testing Revenue (USD Million) By Region (2018-2022)
Figure 22 Middle East and Africa Software Testing Revenue (USD Million) By Type (2018-2022)
Figure 23 Middle East and Africa Software Testing Revenue (USD Million) By Applications (2018-2022)
Figure 24 Global Software Testing Revenue (USD Million) By Type (2023-2030)
Figure 25 Global Software Testing Revenue Market Share (%) By Type (2030)
Figure 26 Global Software Testing Revenue (USD Million) By Applications (2023-2030)
Figure 27 Global Software Testing Revenue Market Share (%) By Applications (2030)
Figure 28 Global Software Testing Market Revenue (USD Million) By Regions (2023-2030)
Figure 29 North America Software Testing Revenue (USD Million) By Country (2023-2030)
Figure 30 North America Software Testing Revenue (USD Million) By Type (2023-2030)
Figure 31 North America Software Testing Revenue (USD Million) By Applications (2023-2030)
Figure 32 Europe Software Testing Revenue (USD Million) By Country (2023-2030)
Figure 33 Europe Software Testing Revenue (USD Million) By Type (2023-2030)
Figure 34 Europe Software Testing Revenue (USD Million) By Applications (2023-2030)
Figure 35 Asia Pacific Software Testing Revenue (USD Million) By Country (2023-2030)
Figure 36 Asia Pacific Software Testing Revenue (USD Million) By Type (2023-2030)
Figure 37 Asia Pacific Software Testing Revenue (USD Million) By Applications (2023-2030)
Figure 38 South America Software Testing Revenue (USD Million) By Country (2023-2030)
Figure 39 South America Software Testing Revenue (USD Million) By Type (2023-2030)
Figure 40 South America Software Testing Revenue (USD Million) By Applications (2023-2030)
Figure 41 Middle East and Africa Software Testing Revenue (USD Million) By Region (2023-2030)
Figure 42 Middle East and Africa Software Testing Revenue (USD Million) By Region (2023-2030)
Figure 43 Middle East and Africa Software Testing Revenue (USD Million) By Type (2023-2030)
Figure 44 Middle East and Africa Software Testing Revenue (USD Million) By Applications (2023-2030)
Figure 45 Bottom-Up and Top-Down Approaches for This Report
Figure 46 Data Triangulation
