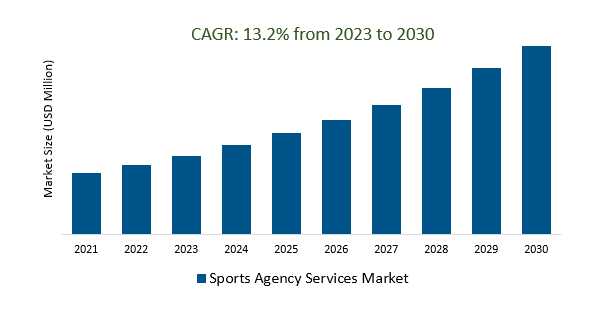
The Global Sports Agency Services Market Size is estimated to register 13.2% growth over the forecast period from 2023 to 2030.
The market growth is driven by an increasing focus on athlete health and wellness is changing how athletes approach their careers and seek services, including those provided by agents. Leading Companies focusing on International Expansion, Data Analytics and AI Integration, Sustainability, Social Responsibility, Hybrid Athletes, Educational and Mentorship Programs, and others to boost market shares in the industry.
Market Overview
The sports agency services market provides comprehensive representation to athletes and sports professionals, encompassing contract negotiations, endorsements, branding, career management, legal and financial services, talent scouting, and crisis management. These agencies navigate the complex world of sports, leveraging their expertise in contracts, sponsorships, and media ventures to secure lucrative opportunities for their clients. They are also increasingly global in scope, adapting to shifts in sports regulations, brand-building through digital platforms, and the rising prominence of women's sports, esports, and entertainment collaborations. This dynamic industry plays a pivotal role in shaping athletes' careers, image, and financial success.
Market Dynamics
Market Trends- Sports Agencies Support Athlete Education and Development for Lifelong Success
Sports agencies now extend their services beyond traditional contract negotiations and endorsements, increasingly focusing on athlete education and development for long-term success. Recognizing the importance of preparing athletes for life both during and after their sports careers, these agencies offer mentorship, educational programs, and personal development resources. This commitment to holistic athlete development equips sports professionals with a diverse skill set, from financial literacy to mental health support, empowering them to navigate the challenges of the industry and lead fulfilling lives beyond their athletic careers.
Market Driver- Athletes Seek Support from Sports Agencies to Navigate CBAs and Maximize Earnings
In an evolving sports landscape, athletes are increasingly turning to sports agencies for guidance in navigating complex Collective Bargaining Agreements (CBAs) to maximize their earnings. These agreements significantly impact player contracts, revenue-sharing models, and overall financial prospects. Sports agencies leverage their expertise in contract negotiation, financial planning, and understanding the intricacies of CBAs to secure the most favorable terms for their clients.
Market Opportunity- Digital and social media Revolutionize the Way Sports Agencies Operate
The digital and social media revolution has profoundly transformed the operations of sports agencies. In an era where an athlete's brand and image hold substantial financial value, sports agencies are leveraging digital platforms to enhance their clients' marketability. They craft strategies for effective online presence, content creation, and fan engagement, unlocking new revenue streams through partnerships and sponsorships. The real-time, global reach of social media has reshaped how athletes connect with their audience, and agencies play a pivotal role in shaping this digital narrative.
The Global Sports Agency Services Market is analyzed across Athlete Services, Corporate Services, and others. Athlete Services is poised to register the fastest growth. Athlete services in the sports agency services market cover contract negotiation, endorsements, branding and marketing, career guidance, legal and financial support, holistic athlete development, and crisis management, catering to the diverse needs of professional athletes for financial success, personal development, and image protection in the competitive world of sports.
Market Share Analysis- Basketball held a significant market share in 2023
The Global Sports Agency Services Market is analyzed across various Installation Mode including Basketball, Football, Hockey, Baseball, Tennis, and others. Of these, Basketball held a significant market share in 2023. In the basketball segment of the sports agency services market, agencies specialize in player representation, contract negotiation, endorsement deals, branding and marketing, career management, legal and financial support, holistic athlete development, and crisis management. These services are tailored to meet the unique needs of basketball players, encompassing financial success, personal development, and image protection in the competitive world of basketball.
Sports Agency Services Market Segmentation
By Type
- Athlete Services
- Corporate Services
By Application
- Basketball
- Football
- Hockey
- Baseball
- Tennis
- Others
By Service
- Club Representation
- Sports Marketing
- Contract Negotiations
- Career Development
- Legal Advice and Representation
- Others
By Region
- North America (United States, Canada, Mexico)
- Europe (Germany, France, United Kingdom, Spain, Italy, Others)
- Asia Pacific (China, India, Japan, South Korea, Australia, Others)
- Latin America (Brazil, Argentina, Others)
- Middle East and Africa (Saudi Arabia, UAE, Kuwait, Other Middle East, South Africa, Nigeria, Other Africa)
Sports Agency Services Market Companies
- Axía Sports (United Kingdom)
- Wasserman (United States)
- Excel Sports Management (United States)
- Creative Artists Agency (United States)
- Gestifute International (Portugal)
- Unique Sports Group (United Kingdom)
- EA Sports agency (United States)
- CSM (United States)
- Octagon (United States)
- Lagardere Sports (United Kingdom)
- Omniasports (Switzerland)
- Sports Pro Agency Srl (Italy)
*List not exhaustive
Sports Agency Services Market Outlook 2023
1 Market Overview
1.1 Introduction to the Sports Agency Services Market
1.2 Scope of the Study
1.3 Research Objective
1.3.1 Key Market Scope and Segments
1.3.2 Players Covered
1.3.3 Years Considered
2 Executive Summary
2.1 2023 Sports Agency Services Industry- Market Statistics
3 Market Dynamics
3.1 Market Drivers
3.2 Market Challenges
3.3 Market Opportunities
3.4 Market Trends
4 Market Factor Analysis
4.1 Porter’s Five Forces
4.2 Market Entropy
4.2.1 Global Sports Agency Services Market Companies with Area Served
4.2.2 Products Offerings Global Sports Agency Services Market
5 COVID-19 Impact Analysis and Outlook Scenarios
5.1.1 Covid-19 Impact Analysis
5.1.2 Post-COVID-19 Scenario- Low Growth Case
5.1.3 Post-COVID-19 Scenario- Reference Growth Case
5.1.4 Post-COVID-19 Scenario- Low Growth Case
6 Global Sports Agency Services Market Trends
6.1 Global Sports Agency Services Revenue (USD Million) and CAGR (%) by Type (2018-2030)
6.2 Global Sports Agency Services Revenue (USD Million) and CAGR (%) by Applications (2018-2030)
6.3 Global Sports Agency Services Revenue (USD Million) and CAGR (%) by Regions (2018-2030)
7 Global Sports Agency Services Market Revenue (USD Million) by Type, and Applications (2018-2022)
7.1 Global Sports Agency Services Revenue (USD Million) by Type (2018-2022)
7.1.1 Global Sports Agency Services Revenue (USD Million), Market Share (%) by Type (2018-2022)
7.2 Global Sports Agency Services Revenue (USD Million) by Applications (2018-2022)
7.2.1 Global Sports Agency Services Revenue (USD Million), Market Share (%) by Applications (2018-2022)
8 Global Sports Agency Services Development Regional Status and Outlook
8.1 Global Sports Agency Services Revenue (USD Million) By Regions (2018-2022)
8.2 North America Sports Agency Services Revenue (USD Million) by Type, and Application (2018-2022)
8.2.1 North America Sports Agency Services Revenue (USD Million) by Country (2018-2022)
8.2.2 North America Sports Agency Services Revenue (USD Million) by Type (2018-2022)
8.2.3 North America Sports Agency Services Revenue (USD Million) by Applications (2018-2022)
8.3 Europe Sports Agency Services Revenue (USD Million), by Type, and Applications (USD Million) (2018-2022)
8.3.1 Europe Sports Agency Services Revenue (USD Million), by Country (2018-2022)
8.3.2 Europe Sports Agency Services Revenue (USD Million) by Type (2018-2022)
8.3.3 Europe Sports Agency Services Revenue (USD Million) by Applications (2018-2022)
8.4 Asia Pacific Sports Agency Services Revenue (USD Million), and Revenue (USD Million) by Type, and Applications (2018-2022)
8.4.1 Asia Pacific Sports Agency Services Revenue (USD Million) by Country (2018-2022)
8.4.2 Asia Pacific Sports Agency Services Revenue (USD Million) by Type (2018-2022)
8.4.3 Asia Pacific Sports Agency Services Revenue (USD Million) by Applications (2018-2022)
8.5 South America Sports Agency Services Revenue (USD Million), by Type, and Applications (2018-2022)
8.5.1 South America Sports Agency Services Revenue (USD Million), by Country (2018-2022)
8.5.2 South America Sports Agency Services Revenue (USD Million) by Type (2018-2022)
8.5.3 South America Sports Agency Services Revenue (USD Million) by Applications (2018-2022)
8.6 Middle East and Africa Sports Agency Services Revenue (USD Million), by Type, Technology, Application, Thickness (2018-2022)
8.6.1 Middle East and Africa Sports Agency Services Revenue (USD Million) by Country (2018-2022)
8.6.2 Middle East and Africa Sports Agency Services Revenue (USD Million) by Type (2018-2022)
8.6.3 Middle East and Africa Sports Agency Services Revenue (USD Million) by Applications (2018-2022)
9 Company Profiles
10 Global Sports Agency Services Market Revenue (USD Million), by Type, and Applications (2023-2030)
10.1 Global Sports Agency Services Revenue (USD Million) and Market Share (%) by Type (2023-2030)
10.1.1 Global Sports Agency Services Revenue (USD Million), and Market Share (%) by Type (2023-2030)
10.2 Global Sports Agency Services Revenue (USD Million) and Market Share (%) by Applications (2023-2030)
10.2.1 Global Sports Agency Services Revenue (USD Million), and Market Share (%) by Applications (2023-2030)
11 Global Sports Agency Services Development Regional Status and Outlook Forecast
11.1 Global Sports Agency Services Revenue (USD Million) By Regions (2023-2030)
11.2 North America Sports Agency Services Revenue (USD Million) by Type, and Applications (2023-2030)
11.2.1 North America Sports Agency Services Revenue (USD) Million by Country (2023-2030)
11.2.2 North America Sports Agency Services Revenue (USD Million), by Type (2023-2030)
11.2.3 North America Sports Agency Services Revenue (USD Million), Market Share (%) by Applications (2023-2030)
11.3 Europe Sports Agency Services Revenue (USD Million), by Type, and Applications (2023-2030)
11.3.1 Europe Sports Agency Services Revenue (USD Million), by Country (2023-2030)
11.3.2 Europe Sports Agency Services Revenue (USD Million), by Type (2023-2030)
11.3.3 Europe Sports Agency Services Revenue (USD Million), by Applications (2023-2030)
11.4 Asia Pacific Sports Agency Services Revenue (USD Million) by Type, and Applications (2023-2030)
11.4.1 Asia Pacific Sports Agency Services Revenue (USD Million), by Country (2023-2030)
11.4.2 Asia Pacific Sports Agency Services Revenue (USD Million), by Type (2023-2030)
11.4.3 Asia Pacific Sports Agency Services Revenue (USD Million), by Applications (2023-2030)
11.5 South America Sports Agency Services Revenue (USD Million), by Type, and Applications (2023-2030)
11.5.1 South America Sports Agency Services Revenue (USD Million), by Country (2023-2030)
11.5.2 South America Sports Agency Services Revenue (USD Million), by Type (2023-2030)
11.5.3 South America Sports Agency Services Revenue (USD Million), by Applications (2023-2030)
11.6 Middle East and Africa Sports Agency Services Revenue (USD Million), by Type, and Applications (2023-2030)
11.6.1 Middle East and Africa Sports Agency Services Revenue (USD Million), by Region (2023-2030)
11.6.2 Middle East and Africa Sports Agency Services Revenue (USD Million), by Type (2023-2030)
11.6.3 Middle East and Africa Sports Agency Services Revenue (USD Million), by Applications (2023-2030)
12 Methodology and Data Sources
12.1 Methodology/Research Approach
12.1.1 Research Programs/Design
12.1.2 Market Size Estimation
12.1.3 Market Breakdown and Data Triangulation
12.2 Data Sources
12.2.1 Secondary Sources
12.2.2 Primary Sources
12.3 Disclaimer
List of Tables
Table 1 Market Segmentation Analysis
Table 2 Global Sports Agency Services Market Companies with Areas Served
Table 3 Products Offerings Global Sports Agency Services Market
Table 4 Low Growth Scenario Forecasts
Table 5 Reference Case Growth Scenario
Table 6 High Growth Case Scenario
Table 7 Global Sports Agency Services Revenue (USD Million) And CAGR (%) By Type (2018-2030)
Table 8 Global Sports Agency Services Revenue (USD Million) And CAGR (%) By Applications (2018-2030)
Table 9 Global Sports Agency Services Revenue (USD Million) And CAGR (%) By Regions (2018-2030)
Table 10 Global Sports Agency Services Revenue (USD Million) By Type (2018-2022)
Table 11 Global Sports Agency Services Revenue Market Share (%) By Type (2018-2022)
Table 12 Global Sports Agency Services Revenue (USD Million) By Applications (2018-2022)
Table 13 Global Sports Agency Services Revenue Market Share (%) By Applications (2018-2022)
Table 14 Global Sports Agency Services Market Revenue (USD Million) By Regions (2018-2022)
Table 15 Global Sports Agency Services Market Share (%) By Regions (2018-2022)
Table 16 North America Sports Agency Services Revenue (USD Million) By Country (2018-2022)
Table 17 North America Sports Agency Services Revenue (USD Million) By Type (2018-2022)
Table 18 North America Sports Agency Services Revenue (USD Million) By Applications (2018-2022)
Table 19 Europe Sports Agency Services Revenue (USD Million) By Country (2018-2022)
Table 20 Europe Sports Agency Services Revenue (USD Million) By Type (2018-2022)
Table 21 Europe Sports Agency Services Revenue (USD Million) By Applications (2018-2022)
Table 22 Asia Pacific Sports Agency Services Revenue (USD Million) By Country (2018-2022)
Table 23 Asia Pacific Sports Agency Services Revenue (USD Million) By Type (2018-2022)
Table 24 Asia Pacific Sports Agency Services Revenue (USD Million) By Applications (2018-2022)
Table 25 South America Sports Agency Services Revenue (USD Million) By Country (2018-2022)
Table 26 South America Sports Agency Services Revenue (USD Million) By Type (2018-2022)
Table 27 South America Sports Agency Services Revenue (USD Million) By Applications (2018-2022)
Table 28 Middle East and Africa Sports Agency Services Revenue (USD Million) By Region (2018-2022)
Table 29 Middle East and Africa Sports Agency Services Revenue (USD Million) By Type (2018-2022)
Table 30 Middle East and Africa Sports Agency Services Revenue (USD Million) By Applications (2018-2022)
Table 31 Financial Analysis
Table 32 Global Sports Agency Services Revenue (USD Million) By Type (2023-2030)
Table 33 Global Sports Agency Services Revenue Market Share (%) By Type (2023-2030)
Table 34 Global Sports Agency Services Revenue (USD Million) By Applications (2023-2030)
Table 35 Global Sports Agency Services Revenue Market Share (%) By Applications (2023-2030)
Table 36 Global Sports Agency Services Market Revenue (USD Million), And Revenue (USD Million) By Regions (2023-2030)
Table 37 North America Sports Agency Services Revenue (USD)By Country (2023-2030)
Table 38 North America Sports Agency Services Revenue (USD Million) By Type (2023-2030)
Table 39 North America Sports Agency Services Revenue (USD Million) By Applications (2023-2030)
Table 40 Europe Sports Agency Services Revenue (USD Million) By Country (2023-2030)
Table 41 Europe Sports Agency Services Revenue (USD Million) By Type (2023-2030)
Table 42 Europe Sports Agency Services Revenue (USD Million) By Applications (2023-2030)
Table 43 Asia Pacific Sports Agency Services Revenue (USD Million) By Country (2023-2030)
Table 44 Asia Pacific Sports Agency Services Revenue (USD Million) By Type (2023-2030)
Table 45 Asia Pacific Sports Agency Services Revenue (USD Million) By Applications (2023-2030)
Table 46 South America Sports Agency Services Revenue (USD Million) By Country (2023-2030)
Table 47 South America Sports Agency Services Revenue (USD Million) By Type (2023-2030)
Table 48 South America Sports Agency Services Revenue (USD Million) By Applications (2023-2030)
Table 49 Middle East and Africa Sports Agency Services Revenue (USD Million) By Region (2023-2030)
Table 50 Middle East and Africa Sports Agency Services Revenue (USD Million) By Region (2023-2030)
Table 51 Middle East and Africa Sports Agency Services Revenue (USD Million) By Type (2023-2030)
Table 52 Middle East and Africa Sports Agency Services Revenue (USD Million) By Applications (2023-2030)
Table 53 Research Programs/Design for This Report
Table 54 Key Data Information from Secondary Sources
Table 55 Key Data Information from Primary Sources
List of Figures
Figure 1 Market Scope
Figure 2 Porter’s Five Forces
Figure 3 Global Sports Agency Services Revenue (USD Million) By Type (2018-2022)
Figure 4 Global Sports Agency Services Revenue Market Share (%) By Type (2022)
Figure 5 Global Sports Agency Services Revenue (USD Million) By Applications (2018-2022)
Figure 6 Global Sports Agency Services Revenue Market Share (%) By Applications (2022)
Figure 7 Global Sports Agency Services Market Revenue (USD Million) By Regions (2018-2022)
Figure 8 Global Sports Agency Services Market Share (%) By Regions (2022)
Figure 9 North America Sports Agency Services Revenue (USD Million) By Country (2018-2022)
Figure 10 North America Sports Agency Services Revenue (USD Million) By Type (2018-2022)
Figure 11 North America Sports Agency Services Revenue (USD Million) By Applications (2018-2022)
Figure 12 Europe Sports Agency Services Revenue (USD Million) By Country (2018-2022)
Figure 13 Europe Sports Agency Services Revenue (USD Million) By Type (2018-2022)
Figure 14 Europe Sports Agency Services Revenue (USD Million) By Applications (2018-2022)
Figure 15 Asia Pacific Sports Agency Services Revenue (USD Million) By Country (2018-2022)
Figure 16 Asia Pacific Sports Agency Services Revenue (USD Million) By Type (2018-2022)
Figure 17 Asia Pacific Sports Agency Services Revenue (USD Million) By Applications (2018-2022)
Figure 18 South America Sports Agency Services Revenue (USD Million) By Country (2018-2022)
Figure 19 South America Sports Agency Services Revenue (USD Million) By Type (2018-2022)
Figure 20 South America Sports Agency Services Revenue (USD Million) By Applications (2018-2022)
Figure 21 Middle East and Africa Sports Agency Services Revenue (USD Million) By Region (2018-2022)
Figure 22 Middle East and Africa Sports Agency Services Revenue (USD Million) By Type (2018-2022)
Figure 23 Middle East and Africa Sports Agency Services Revenue (USD Million) By Applications (2018-2022)
Figure 24 Global Sports Agency Services Revenue (USD Million) By Type (2023-2030)
Figure 25 Global Sports Agency Services Revenue Market Share (%) By Type (2030)
Figure 26 Global Sports Agency Services Revenue (USD Million) By Applications (2023-2030)
Figure 27 Global Sports Agency Services Revenue Market Share (%) By Applications (2030)
Figure 28 Global Sports Agency Services Market Revenue (USD Million) By Regions (2023-2030)
Figure 29 North America Sports Agency Services Revenue (USD Million) By Country (2023-2030)
Figure 30 North America Sports Agency Services Revenue (USD Million) By Type (2023-2030)
Figure 31 North America Sports Agency Services Revenue (USD Million) By Applications (2023-2030)
Figure 32 Europe Sports Agency Services Revenue (USD Million) By Country (2023-2030)
Figure 33 Europe Sports Agency Services Revenue (USD Million) By Type (2023-2030)
Figure 34 Europe Sports Agency Services Revenue (USD Million) By Applications (2023-2030)
Figure 35 Asia Pacific Sports Agency Services Revenue (USD Million) By Country (2023-2030)
Figure 36 Asia Pacific Sports Agency Services Revenue (USD Million) By Type (2023-2030)
Figure 37 Asia Pacific Sports Agency Services Revenue (USD Million) By Applications (2023-2030)
Figure 38 South America Sports Agency Services Revenue (USD Million) By Country (2023-2030)
Figure 39 South America Sports Agency Services Revenue (USD Million) By Type (2023-2030)
Figure 40 South America Sports Agency Services Revenue (USD Million) By Applications (2023-2030)
Figure 41 Middle East and Africa Sports Agency Services Revenue (USD Million) By Region (2023-2030)
Figure 42 Middle East and Africa Sports Agency Services Revenue (USD Million) By Region (2023-2030)
Figure 43 Middle East and Africa Sports Agency Services Revenue (USD Million) By Type (2023-2030)
Figure 44 Middle East and Africa Sports Agency Services Revenue (USD Million) By Applications (2023-2030)
Figure 45 Bottom-Up and Top-Down Approaches For This Report
Figure 46 Data Triangulation
