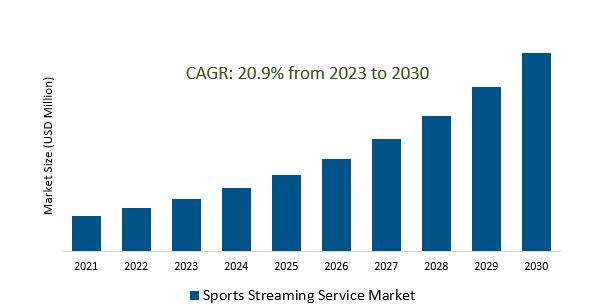
The Global Sports Streaming Service Market Size is estimated to register 20.9% growth over the forecast period from 2023 to 2030.
Market growth gains momentum due to increasing demand, with the primary catalyst for the sports streaming market being the need for seamless cross-platform compatibility. Users expect to access content seamlessly on a range of devices, including smartphones, tablets, smart TVs, and gaming consoles. In response, sports streaming services are proactively developing applications and platforms to deliver a consistent and user-friendly experience across these diverse devices. Leading Companies focusing on Hyper-Personalization, Enhanced Gamification, 5G, Edge Computing Integration, Virtual Reality (VR) Sports Stadiums, Data Analytics and Insights, and others to boost market shares in the industry.
Market Overview
The sports streaming service market has grown significantly, challenging traditional broadcasting with its diverse content portfolio, exclusive rights to popular events, and a focus on personalization and interactivity. Global expansion and integration with betting and fantasy sports are key trends, while advancements in streaming technology, cross-platform compatibility, and data analytics play pivotal roles in the market's continued growth and transformation, promising a future with even more personalized, interactive, and immersive experiences for sports fans.
Market Dynamics
Market Trends- The expansion of content libraries in the sports streaming market is driving viewer engagement, attracting new subscribers, and solidifying the position of these services in the competitive media landscape.
The expansion of content libraries in the sports streaming market is driving viewer engagement and attracting new subscribers. By diversifying their offerings with a wide range of sports events, these services cater to a broader audience, solidifying their positions in the competitive media landscape. With exclusive broadcasting rights and a rich content library, sports streaming services are transforming how sports content is consumed in the modern media industry.
Market Driver- The growing demand for personalization and interactivity in the sports streaming market is fueling the adoption of advanced technologies that enhance user engagement and tailor the viewing experience to individual preferences.
The growing demand for personalization and interactivity in the sports streaming market is driving the adoption of advanced technologies to enhance user engagement and offer tailored viewing experiences. Viewers can now personalize content recommendations, access real-time statistics, choose multiple camera angles, and interact with fellow sports enthusiasts, revolutionizing the sports streaming experience and meeting the evolving expectations of fans who seek more customized and interactive connections with their favorite sports content.
Market Opportunity- The integration of betting and fantasy sports features into sports streaming services is creating a captivating and immersive viewing experience, enhancing user engagement, and generating new revenue streams for these services.
The incorporation of betting and fantasy sports features within sports streaming services is transforming the viewing experience. This integration not only amplifies user engagement but also introduces fresh revenue avenues for these services. It enthralls viewers by enabling them to actively participate in live betting and fantasy sports competitions while enjoying their preferred events. This fusion of sports and interactive gaming injects an exhilarating dimension into the viewing experience, rendering sports streaming services more appealing to a diverse fan base and creating monetization prospects beyond subscription fees.
Market Share Analysis- Football the Sports Streaming Service Market will register the fastest growth
The Global Sports Streaming Service Market is analyzed across Football, Basketball, Golf, Hockey, Tennis, and others. Football is poised to register the fastest growth. Football is a pivotal component of the sports streaming service market, drawing a massive global audience. Streaming platforms secure exclusive broadcasting rights for major football leagues and tournaments, which not only boost viewer engagement but also drive subscriber acquisition. The high demand for football content fuels market growth, prompting continuous investments by providers in securing rights and enhancing the quality of their football streaming offerings.
Market Share Analysis- Enterprise held a significant market share in 2023
The Global Sports Streaming Service Market is analyzed across various Organizations including Personal, Enterprise, and others. Of these, Enterprise held a significant market share in 2023. The enterprise sports streaming service market provides solutions for businesses and organizations to stream sports content for various corporate purposes, including internal communication, employee engagement, and brand promotion. It offers services such as live streaming of corporate sports events, on-demand training, and custom sports content libraries, allowing enterprises to connect with their audience, enhance team morale, and market their brand effectively.
Sports Streaming Service Market Segmentation
By Type
- Football
- Basketball
- Golf
- Hockey
- Tennis
- Others
By Application
By Region
- North America (United States, Canada, Mexico)
- Europe (Germany, France, United Kingdom, Spain, Italy, Others)
- Asia Pacific (China, India, Japan, South Korea, Australia, Others)
- Latin America (Brazil, Argentina, Others)
- Middle East and Africa (Saudi Arabia, UAE, Kuwait, Other Middle East, South Africa, Nigeria, Other Africa)
Sports Streaming Service Market Companies
- ESPN+
- DirecTV
- fuboTV
- Sling
- Hulu
- NBC
- Paramount+
- DAZN
- Kayo Sports
- FloSports
- Endeavor Streaming
- YouTube TV
- Peacock
- Vidgo
- AT&T TV
- NFL Game Pass
- Prime Video
*List not exhaustive
Sports Streaming Service Market Outlook 2023
1 Market Overview
1.1 Introduction to the Sports Streaming Service Market
1.2 Scope of the Study
1.3 Research Objective
1.3.1 Key Market Scope and Segments
1.3.2 Players Covered
1.3.3 Years Considered
2 Executive Summary
2.1 2023 Sports Streaming Service Industry- Market Statistics
3 Market Dynamics
3.1 Market Drivers
3.2 Market Challenges
3.3 Market Opportunities
3.4 Market Trends
4 Market Factor Analysis
4.1 Porter’s Five Forces
4.2 Market Entropy
4.2.1 Global Sports Streaming Service Market Companies with Area Served
4.2.2 Products Offerings Global Sports Streaming Service Market
5 COVID-19 Impact Analysis and Outlook Scenarios
5.1.1 Covid-19 Impact Analysis
5.1.2 post-COVID-19 Scenario- Low Growth Case
5.1.3 post-COVID-19 Scenario- Reference Growth Case
5.1.4 post-COVID-19 Scenario- Low Growth Case
6 Global Sports Streaming Service Market Trends
6.1 Global Sports Streaming Service Revenue (USD Million) and CAGR (%) by Type (2018-2030)
6.2 Global Sports Streaming Service Revenue (USD Million) and CAGR (%) by Applications (2018-2030)
6.3 Global Sports Streaming Service Revenue (USD Million) and CAGR (%) by regions (2018-2030)
7 Global Sports Streaming Service Market Revenue (USD Million) by Type, and Applications (2018-2022)
7.1 Global Sports Streaming Service Revenue (USD Million) by Type (2018-2022)
7.1.1 Global Sports Streaming Service Revenue (USD Million), Market Share (%) by Type (2018-2022)
7.2 Global Sports Streaming Service Revenue (USD Million) by Applications (2018-2022)
7.2.1 Global Sports Streaming Service Revenue (USD Million), Market Share (%) by Applications (2018-2022)
8 Global Sports Streaming Service Development Regional Status and Outlook
8.1 Global Sports Streaming Service Revenue (USD Million) By Regions (2018-2022)
8.2 North America Sports Streaming Service Revenue (USD Million) by Type, and Application (2018-2022)
8.2.1 North America Sports Streaming Service Revenue (USD Million) by Country (2018-2022)
8.2.2 North America Sports Streaming Service Revenue (USD Million) by Type (2018-2022)
8.2.3 North America Sports Streaming Service Revenue (USD Million) by Applications (2018-2022)
8.3 Europe Sports Streaming Service Revenue (USD Million), by Type, and Applications (USD Million) (2018-2022)
8.3.1 Europe Sports Streaming Service Revenue (USD Million), by Country (2018-2022)
8.3.2 Europe Sports Streaming Service Revenue (USD Million) by Type (2018-2022)
8.3.3 Europe Sports Streaming Service Revenue (USD Million) by Applications (2018-2022)
8.4 Asia Pacific Sports Streaming Service Revenue (USD Million), and Revenue (USD Million) by Type, and Applications (2018-2022)
8.4.1 Asia Pacific Sports Streaming Service Revenue (USD Million) by Country (2018-2022)
8.4.2 Asia Pacific Sports Streaming Service Revenue (USD Million) by Type (2018-2022)
8.4.3 Asia Pacific Sports Streaming Service Revenue (USD Million) by Applications (2018-2022)
8.5 South America Sports Streaming Service Revenue (USD Million), by Type, and Applications (2018-2022)
8.5.1 South America Sports Streaming Service Revenue (USD Million), by Country (2018-2022)
8.5.2 South America Sports Streaming Service Revenue (USD Million) by Type (2018-2022)
8.5.3 South America Sports Streaming Service Revenue (USD Million) by Applications (2018-2022)
8.6 Middle East and Africa Sports Streaming Service Revenue (USD Million), by Type, Technology, Application, Thickness (2018-2022)
8.6.1 Middle East and Africa Sports Streaming Service Revenue (USD Million) by Country (2018-2022)
8.6.2 Middle East and Africa Sports Streaming Service Revenue (USD Million) by Type (2018-2022)
8.6.3 Middle East and Africa Sports Streaming Service Revenue (USD Million) by Applications (2018-2022)
9 Company Profiles
10 Global Sports Streaming Service Market Revenue (USD Million), by Type, and Applications (2023-2030)
10.1 Global Sports Streaming Service Revenue (USD Million) and Market Share (%) by Type (2023-2030)
10.1.1 Global Sports Streaming Service Revenue (USD Million), and Market Share (%) by Type (2023-2030)
10.2 Global Sports Streaming Service Revenue (USD Million) and Market Share (%) by Applications (2023-2030)
10.2.1 Global Sports Streaming Service Revenue (USD Million), and Market Share (%) by Applications (2023-2030)
11 Global Sports Streaming Service Development Regional Status and Outlook Forecast
11.1 Global Sports Streaming Service Revenue (USD Million) By Regions (2023-2030)
11.2 North America Sports Streaming Service Revenue (USD Million) by Type, and Applications (2023-2030)
11.2.1 North America Sports Streaming Service Revenue (USD) Million by Country (2023-2030)
11.2.2 North America Sports Streaming Service Revenue (USD Million), by Type (2023-2030)
11.2.3 North America Sports Streaming Service Revenue (USD Million), Market Share (%) by Applications (2023-2030)
11.3 Europe Sports Streaming Service Revenue (USD Million), by Type, and Applications (2023-2030)
11.3.1 Europe Sports Streaming Service Revenue (USD Million), by Country (2023-2030)
11.3.2 Europe Sports Streaming Service Revenue (USD Million), by Type (2023-2030)
11.3.3 Europe Sports Streaming Service Revenue (USD Million), by Applications (2023-2030)
11.4 Asia Pacific Sports Streaming Service Revenue (USD Million) by Type, and Applications (2023-2030)
11.4.1 Asia Pacific Sports Streaming Service Revenue (USD Million), by Country (2023-2030)
11.4.2 Asia Pacific Sports Streaming Service Revenue (USD Million), by Type (2023-2030)
11.4.3 Asia Pacific Sports Streaming Service Revenue (USD Million), by Applications (2023-2030)
11.5 South America Sports Streaming Service Revenue (USD Million), by Type, and Applications (2023-2030)
11.5.1 South America Sports Streaming Service Revenue (USD Million), by Country (2023-2030)
11.5.2 South America Sports Streaming Service Revenue (USD Million), by Type (2023-2030)
11.5.3 South America Sports Streaming Service Revenue (USD Million), by Applications (2023-2030)
11.6 Middle East and Africa Sports Streaming Service Revenue (USD Million), by Type, and Applications (2023-2030)
11.6.1 Middle East and Africa Sports Streaming Service Revenue (USD Million), by region (2023-2030)
11.6.2 Middle East and Africa Sports Streaming Service Revenue (USD Million), by Type (2023-2030)
11.6.3 Middle East and Africa Sports Streaming Service Revenue (USD Million), by Applications (2023-2030)
12 Methodology and Data Sources
12.1 Methodology/Research Approach
12.1.1 Research Programs/Design
12.1.2 Market Size Estimation
12.1.3 Market Breakdown and Data Triangulation
12.2 Data Sources
12.2.1 Secondary Sources
12.2.2 Primary Sources
12.3 Disclaimer
List of Tables
Table 1 Market Segmentation Analysis
Table 2 Global Sports Streaming Service Market Companies with Areas Served
Table 3 Products Offerings Global Sports Streaming Service Market
Table 4 Low Growth Scenario Forecasts
Table 5 Reference Case Growth Scenario
Table 6 High Growth Case Scenario
Table 7 Global Sports Streaming Service Revenue (USD Million) And CAGR (%) By Type (2018-2030)
Table 8 Global Sports Streaming Service Revenue (USD Million) And CAGR (%) By Applications (2018-2030)
Table 9 Global Sports Streaming Service Revenue (USD Million) And CAGR (%) By Regions (2018-2030)
Table 10 Global Sports Streaming Service Revenue (USD Million) By Type (2018-2022)
Table 11 Global Sports Streaming Service Revenue Market Share (%) By Type (2018-2022)
Table 12 Global Sports Streaming Service Revenue (USD Million) By Applications (2018-2022)
Table 13 Global Sports Streaming Service Revenue Market Share (%) By Applications (2018-2022)
Table 14 Global Sports Streaming Service Market Revenue (USD Million) By Regions (2018-2022)
Table 15 Global Sports Streaming Service Market Share (%) By Regions (2018-2022)
Table 16 North America Sports Streaming Service Revenue (USD Million) By Country (2018-2022)
Table 17 North America Sports Streaming Service Revenue (USD Million) By Type (2018-2022)
Table 18 North America Sports Streaming Service Revenue (USD Million) By Applications (2018-2022)
Table 19 Europe Sports Streaming Service Revenue (USD Million) By Country (2018-2022)
Table 20 Europe Sports Streaming Service Revenue (USD Million) By Type (2018-2022)
Table 21 Europe Sports Streaming Service Revenue (USD Million) By Applications (2018-2022)
Table 22 Asia Pacific Sports Streaming Service Revenue (USD Million) By Country (2018-2022)
Table 23 Asia Pacific Sports Streaming Service Revenue (USD Million) By Type (2018-2022)
Table 24 Asia Pacific Sports Streaming Service Revenue (USD Million) By Applications (2018-2022)
Table 25 South America Sports Streaming Service Revenue (USD Million) By Country (2018-2022)
Table 26 South America Sports Streaming Service Revenue (USD Million) By Type (2018-2022)
Table 27 South America Sports Streaming Service Revenue (USD Million) By Applications (2018-2022)
Table 28 Middle East and Africa Sports Streaming Service Revenue (USD Million) By Region (2018-2022)
Table 29 Middle East and Africa Sports Streaming Service Revenue (USD Million) By Type (2018-2022)
Table 30 Middle East and Africa Sports Streaming Service Revenue (USD Million) By Applications (2018-2022)
Table 31 Financial Analysis
Table 32 Global Sports Streaming Service Revenue (USD Million) By Type (2023-2030)
Table 33 Global Sports Streaming Service Revenue Market Share (%) By Type (2023-2030)
Table 34 Global Sports Streaming Service Revenue (USD Million) By Applications (2023-2030)
Table 35 Global Sports Streaming Service Revenue Market Share (%) By Applications (2023-2030)
Table 36 Global Sports Streaming Service Market Revenue (USD Million), And Revenue (USD Million) By Regions (2023-2030)
Table 37 North America Sports Streaming Service Revenue (USD)By Country (2023-2030)
Table 38 North America Sports Streaming Service Revenue (USD Million) By Type (2023-2030)
Table 39 North America Sports Streaming Service Revenue (USD Million) By Applications (2023-2030)
Table 40 Europe Sports Streaming Service Revenue (USD Million) By Country (2023-2030)
Table 41 Europe Sports Streaming Service Revenue (USD Million) By Type (2023-2030)
Table 42 Europe Sports Streaming Service Revenue (USD Million) By Applications (2023-2030)
Table 43 Asia Pacific Sports Streaming Service Revenue (USD Million) By Country (2023-2030)
Table 44 Asia Pacific Sports Streaming Service Revenue (USD Million) By Type (2023-2030)
Table 45 Asia Pacific Sports Streaming Service Revenue (USD Million) By Applications (2023-2030)
Table 46 South America Sports Streaming Service Revenue (USD Million) By Country (2023-2030)
Table 47 South America Sports Streaming Service Revenue (USD Million) By Type (2023-2030)
Table 48 South America Sports Streaming Service Revenue (USD Million) By Applications (2023-2030)
Table 49 Middle East and Africa Sports Streaming Service Revenue (USD Million) By Region (2023-2030)
Table 50 Middle East and Africa Sports Streaming Service Revenue (USD Million) By Region (2023-2030)
Table 51 Middle East and Africa Sports Streaming Service Revenue (USD Million) By Type (2023-2030)
Table 52 Middle East and Africa Sports Streaming Service Revenue (USD Million) By Applications (2023-2030)
Table 53 Research Programs/Design for This Report
Table 54 Key Data Information from Secondary Sources
Table 55 Key Data Information from Primary Sources
List of Figures
Figure 1 Market Scope
Figure 2 Porter’s Five Forces
Figure 3 Global Sports Streaming Service Revenue (USD Million) By Type (2018-2022)
Figure 4 Global Sports Streaming Service Revenue Market Share (%) By Type (2022)
Figure 5 Global Sports Streaming Service Revenue (USD Million) By Applications (2018-2022)
Figure 6 Global Sports Streaming Service Revenue Market Share (%) By Applications (2022)
Figure 7 Global Sports Streaming Service Market Revenue (USD Million) By Regions (2018-2022)
Figure 8 Global Sports Streaming Service Market Share (%) By Regions (2022)
Figure 9 North America Sports Streaming Service Revenue (USD Million) By Country (2018-2022)
Figure 10 North America Sports Streaming Service Revenue (USD Million) By Type (2018-2022)
Figure 11 North America Sports Streaming Service Revenue (USD Million) By Applications (2018-2022)
Figure 12 Europe Sports Streaming Service Revenue (USD Million) By Country (2018-2022)
Figure 13 Europe Sports Streaming Service Revenue (USD Million) By Type (2018-2022)
Figure 14 Europe Sports Streaming Service Revenue (USD Million) By Applications (2018-2022)
Figure 15 Asia Pacific Sports Streaming Service Revenue (USD Million) By Country (2018-2022)
Figure 16 Asia Pacific Sports Streaming Service Revenue (USD Million) By Type (2018-2022)
Figure 17 Asia Pacific Sports Streaming Service Revenue (USD Million) By Applications (2018-2022)
Figure 18 South America Sports Streaming Service Revenue (USD Million) By Country (2018-2022)
Figure 19 South America Sports Streaming Service Revenue (USD Million) By Type (2018-2022)
Figure 20 South America Sports Streaming Service Revenue (USD Million) By Applications (2018-2022)
Figure 21 Middle East and Africa Sports Streaming Service Revenue (USD Million) By Region (2018-2022)
Figure 22 Middle East and Africa Sports Streaming Service Revenue (USD Million) By Type (2018-2022)
Figure 23 Middle East and Africa Sports Streaming Service Revenue (USD Million) By Applications (2018-2022)
Figure 24 Global Sports Streaming Service Revenue (USD Million) By Type (2023-2030)
Figure 25 Global Sports Streaming Service Revenue Market Share (%) By Type (2030)
Figure 26 Global Sports Streaming Service Revenue (USD Million) By Applications (2023-2030)
Figure 27 Global Sports Streaming Service Revenue Market Share (%) By Applications (2030)
Figure 28 Global Sports Streaming Service Market Revenue (USD Million) By Regions (2023-2030)
Figure 29 North America Sports Streaming Service Revenue (USD Million) By Country (2023-2030)
Figure 30 North America Sports Streaming Service Revenue (USD Million) By Type (2023-2030)
Figure 31 North America Sports Streaming Service Revenue (USD Million) By Applications (2023-2030)
Figure 32 Europe Sports Streaming Service Revenue (USD Million) By Country (2023-2030)
Figure 33 Europe Sports Streaming Service Revenue (USD Million) By Type (2023-2030)
Figure 34 Europe Sports Streaming Service Revenue (USD Million) By Applications (2023-2030)
Figure 35 Asia Pacific Sports Streaming Service Revenue (USD Million) By Country (2023-2030)
Figure 36 Asia Pacific Sports Streaming Service Revenue (USD Million) By Type (2023-2030)
Figure 37 Asia Pacific Sports Streaming Service Revenue (USD Million) By Applications (2023-2030)
Figure 38 South America Sports Streaming Service Revenue (USD Million) By Country (2023-2030)
Figure 39 South America Sports Streaming Service Revenue (USD Million) By Type (2023-2030)
Figure 40 South America Sports Streaming Service Revenue (USD Million) By Applications (2023-2030)
Figure 41 Middle East and Africa Sports Streaming Service Revenue (USD Million) By Region (2023-2030)
Figure 42 Middle East and Africa Sports Streaming Service Revenue (USD Million) By Region (2023-2030)
Figure 43 Middle East and Africa Sports Streaming Service Revenue (USD Million) By Type (2023-2030)
Figure 44 Middle East and Africa Sports Streaming Service Revenue (USD Million) By Applications (2023-2030)
Figure 45 Bottom-Up and Top-Down Approaches for This Report
Figure 46 Data Triangulation
