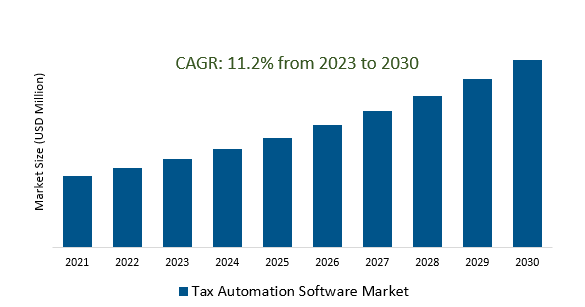
The Global Tax Automation Software Market Size is estimated to register 11.2% growth over the forecast period from 2023 to 2030.
The market growth is driven by an increasing globalization of businesses, and managing taxes across multiple jurisdictions has become a complex task. Tax automation software is in high demand to help companies comply with international tax regulations, including transfer pricing, VAT/GST compliance, and country-specific tax requirements. The need for cross-border tax management is driving the adoption of sophisticated tax automation solutions. Leading Companies focusing on AI-driven predictive Tax Analytics, Blockchain-Based Smart Contracts for Tax Compliance, Environmental Tax Management, Customization and Scalability, Integration with Emerging Technologies, and others to boost market shares in the industry.
Market Overview
The Tax Automation Software Market encompasses software solutions that automate tax management, including tax preparation, compliance, reporting, and analytics. Key drivers include increasing tax complexity, digital transformation, the use of data analytics and AI, globalization, and cybersecurity concerns. The future scope includes AI-driven predictive analytics, blockchain-based smart contracts, environmental tax management, customization, and integration with emerging technologies. The market is dynamic and evolves in response to changing tax regulations and technological advancements.
Market Dynamics
Market Trends- Tax automation software empowers businesses to stay compliant with ever-changing tax regulations, shielding them from the risks and costs associated with regulatory complexity.
Tax automation software streamlines tax compliance by automating the calculation and reporting of various taxes, reducing the risk of non-compliance, minimizing errors, and keeping businesses updated with ever-changing tax regulations. This ensures cost savings, accurate tax management, and timely adherence to tax requirements.
Market Driver- The ongoing digital transformation of tax functions is fueling the demand for tax automation software as businesses seek to streamline processes, enhance efficiency, and ensure compliance in an increasingly complex regulatory environment.
The continuous digital transformation of tax processes is revolutionizing how businesses handle their financial operations, leading to a substantial increase in the need for tax automation software. In an era of pervasive digitalization across industries, companies are progressively embracing tax automation solutions to streamline and optimize their tax-related functions. These software solutions seamlessly integrate with accounting and financial systems, creating a centralized hub for tax calculations, reporting, and compliance, ultimately enabling businesses to boost operational efficiency, reduce compliance risks, and maintain agility in adapting to the evolving tax landscape.
Market Opportunity- The integration of data analytics and artificial intelligence into tax automation software is revolutionizing tax compliance by enabling automated data analysis, intelligent tax planning, and predictive risk assessment.
The incorporation of data analytics and artificial intelligence into tax automation software is revolutionizing tax compliance, enabling real-time data analysis, proactive tax planning, and predictive risk assessment. This advanced integration enhances automation, offering businesses personalized tax strategies, cost savings, and improved compliance management, fundamentally transforming their tax management approaches.
Market Share Analysis- Corporate Tax Software The Tax Automation Software Market will register the fastest growth
The Global Tax Automation Software Market is analyzed across Corporate Tax Software, Professional Tax Software, Tax Preparer Software, Tax Compliance Software, and others. Corporate Tax Software is poised to register the fastest growth. Corporate tax software is a subset of the broader Tax Automation Software Market, providing specialized tools for businesses to streamline and automate their tax-related processes and ensure compliance with tax regulations.
Market Share Analysis- Cloud-Based held a significant market share in 2023
The Global Tax Automation Software Market is analyzed across various Deployments including Cloud Based, On-Premises, and others. Of these, Cloud-Based held a significant market share in 2023. Cloud-based tax automation software is a vital component of the Tax Automation Software Market, providing tax automation solutions that are delivered through cloud computing infrastructure. These solutions offer businesses the benefits of remote access, scalability, and collaboration, making them an integral part of the evolving tax automation market.
Tax Automation Software Market Segmentation
By Type
- Corporate Tax Software
- Professional Tax Software
- Tax Preparer Software
- Tax Compliance Software
- Others
By Deployment
By End-User
- BFSI
- Healthcare
- Retail
- Manufacturing
- Real Estate
- Others
By Region
- North America (United States, Canada, Mexico)
- Europe (Germany, France, United Kingdom, Spain, Italy, Others)
- Asia Pacific (China, India, Japan, South Korea, Australia, Others)
- Latin America (Brazil, Argentina, Others)
- Middle East and Africa (Saudi Arabia, UAE, Kuwait, Other Middle East, South Africa, Nigeria, Other Africa)
Tax Automation Software Market Companies
- Wolters Kluwer N.V.
- CFS Tax Software
- Thomson Reuters
- Avalara
- Vertex Inc
- SOVOS
- Drake Software
- EGov Systems
- TaxACT
- Rethink Solutions
- ClearTAX
- FedTax
*List not exhaustive
Tax Automation Software Market Outlook 2023
1 Market Overview
1.1 Introduction to the Tax Automation Software Market
1.2 Scope of the Study
1.3 Research Objective
1.3.1 Key Market Scope and Segments
1.3.2 Players Covered
1.3.3 Years Considered
2 Executive Summary
2.1 2023 Tax Automation Software Industry- Market Statistics
3 Market Dynamics
3.1 Market Drivers
3.2 Market Challenges
3.3 Market Opportunities
3.4 Market Trends
4 Market Factor Analysis
4.1 Porter’s Five Forces
4.2 Market Entropy
4.2.1 Global Tax Automation Software Market Companies with Area Served
4.2.2 Products Offerings Global Tax Automation Software Market
5 COVID-19 Impact Analysis and Outlook Scenarios
5.1.1 Covid-19 Impact Analysis
5.1.2 Post-COVID-19 Scenario- Low Growth Case
5.1.3 Post-COVID-19 Scenario- Reference Growth Case
5.1.4 Post-COVID-19 Scenario- Low Growth Case
6 Global Tax Automation Software Market Trends
6.1 Global Tax Automation Software Revenue (USD Million) and CAGR (%) by Type (2018-2030)
6.2 Global Tax Automation Software Revenue (USD Million) and CAGR (%) by Applications (2018-2030)
6.3 Global Tax Automation Software Revenue (USD Million) and CAGR (%) by Regions (2018-2030)
7 Global Tax Automation Software Market Revenue (USD Million) by Type, and Applications (2018-2022)
7.1 Global Tax Automation Software Revenue (USD Million) by Type (2018-2022)
7.1.1 Global Tax Automation Software Revenue (USD Million), Market Share (%) by Type (2018-2022)
7.2 Global Tax Automation Software Revenue (USD Million) by Applications (2018-2022)
7.2.1 Global Tax Automation Software Revenue (USD Million), Market Share (%) by Applications (2018-2022)
8 Global Tax Automation Software Development Regional Status and Outlook
8.1 Global Tax Automation Software Revenue (USD Million) By Regions (2018-2022)
8.2 North America Tax Automation Software Revenue (USD Million) by Type, and Application (2018-2022)
8.2.1 North America Tax Automation Software Revenue (USD Million) by Country (2018-2022)
8.2.2 North America Tax Automation Software Revenue (USD Million) by Type (2018-2022)
8.2.3 North America Tax Automation Software Revenue (USD Million) by Applications (2018-2022)
8.3 Europe Tax Automation Software Revenue (USD Million), by Type, and Applications (USD Million) (2018-2022)
8.3.1 Europe Tax Automation Software Revenue (USD Million), by Country (2018-2022)
8.3.2 Europe Tax Automation Software Revenue (USD Million) by Type (2018-2022)
8.3.3 Europe Tax Automation Software Revenue (USD Million) by Applications (2018-2022)
8.4 Asia Pacific Tax Automation Software Revenue (USD Million), and Revenue (USD Million) by Type, and Applications (2018-2022)
8.4.1 Asia Pacific Tax Automation Software Revenue (USD Million) by Country (2018-2022)
8.4.2 Asia Pacific Tax Automation Software Revenue (USD Million) by Type (2018-2022)
8.4.3 Asia Pacific Tax Automation Software Revenue (USD Million) by Applications (2018-2022)
8.5 South America Tax Automation Software Revenue (USD Million), by Type, and Applications (2018-2022)
8.5.1 South America Tax Automation Software Revenue (USD Million), by Country (2018-2022)
8.5.2 South America Tax Automation Software Revenue (USD Million) by Type (2018-2022)
8.5.3 South America Tax Automation Software Revenue (USD Million) by Applications (2018-2022)
8.6 Middle East and Africa Tax Automation Software Revenue (USD Million), by Type, Technology, Application, Thickness (2018-2022)
8.6.1 Middle East and Africa Tax Automation Software Revenue (USD Million) by Country (2018-2022)
8.6.2 Middle East and Africa Tax Automation Software Revenue (USD Million) by Type (2018-2022)
8.6.3 Middle East and Africa Tax Automation Software Revenue (USD Million) by Applications (2018-2022)
9 Company Profiles
10 Global Tax Automation Software Market Revenue (USD Million), by Type, and Applications (2023-2030)
10.1 Global Tax Automation Software Revenue (USD Million) and Market Share (%) by Type (2023-2030)
10.1.1 Global Tax Automation Software Revenue (USD Million), and Market Share (%) by Type (2023-2030)
10.2 Global Tax Automation Software Revenue (USD Million) and Market Share (%) by Applications (2023-2030)
10.2.1 Global Tax Automation Software Revenue (USD Million), and Market Share (%) by Applications (2023-2030)
11 Global Tax Automation Software Development Regional Status and Outlook Forecast
11.1 Global Tax Automation Software Revenue (USD Million) By Regions (2023-2030)
11.2 North America Tax Automation Software Revenue (USD Million) by Type, and Applications (2023-2030)
11.2.1 North America Tax Automation Software Revenue (USD) Million by Country (2023-2030)
11.2.2 North America Tax Automation Software Revenue (USD Million), by Type (2023-2030)
11.2.3 North America Tax Automation Software Revenue (USD Million), Market Share (%) by Applications (2023-2030)
11.3 Europe Tax Automation Software Revenue (USD Million), by Type, and Applications (2023-2030)
11.3.1 Europe Tax Automation Software Revenue (USD Million), by Country (2023-2030)
11.3.2 Europe Tax Automation Software Revenue (USD Million), by Type (2023-2030)
11.3.3 Europe Tax Automation Software Revenue (USD Million), by Applications (2023-2030)
11.4 Asia Pacific Tax Automation Software Revenue (USD Million) by Type, and Applications (2023-2030)
11.4.1 Asia Pacific Tax Automation Software Revenue (USD Million), by Country (2023-2030)
11.4.2 Asia Pacific Tax Automation Software Revenue (USD Million), by Type (2023-2030)
11.4.3 Asia Pacific Tax Automation Software Revenue (USD Million), by Applications (2023-2030)
11.5 South America Tax Automation Software Revenue (USD Million), by Type, and Applications (2023-2030)
11.5.1 South America Tax Automation Software Revenue (USD Million), by Country (2023-2030)
11.5.2 South America Tax Automation Software Revenue (USD Million), by Type (2023-2030)
11.5.3 South America Tax Automation Software Revenue (USD Million), by Applications (2023-2030)
11.6 Middle East and Africa Tax Automation Software Revenue (USD Million), by Type, and Applications (2023-2030)
11.6.1 Middle East and Africa Tax Automation Software Revenue (USD Million), by Region (2023-2030)
11.6.2 Middle East and Africa Tax Automation Software Revenue (USD Million), by Type (2023-2030)
11.6.3 Middle East and Africa Tax Automation Software Revenue (USD Million), by Applications (2023-2030)
12 Methodology and Data Sources
12.1 Methodology/Research Approach
12.1.1 Research Programs/Design
12.1.2 Market Size Estimation
12.1.3 Market Breakdown and Data Triangulation
12.2 Data Sources
12.2.1 Secondary Sources
12.2.2 Primary Sources
12.3 Disclaimer
List of Tables
Table 1 Market Segmentation Analysis
Table 2 Global Tax Automation Software Market Companies with Areas Served
Table 3 Products Offerings Global Tax Automation Software Market
Table 4 Low Growth Scenario Forecasts
Table 5 Reference Case Growth Scenario
Table 6 High Growth Case Scenario
Table 7 Global Tax Automation Software Revenue (USD Million) And CAGR (%) By Type (2018-2030)
Table 8 Global Tax Automation Software Revenue (USD Million) And CAGR (%) By Applications (2018-2030)
Table 9 Global Tax Automation Software Revenue (USD Million) And CAGR (%) By Regions (2018-2030)
Table 10 Global Tax Automation Software Revenue (USD Million) By Type (2018-2022)
Table 11 Global Tax Automation Software Revenue Market Share (%) By Type (2018-2022)
Table 12 Global Tax Automation Software Revenue (USD Million) By Applications (2018-2022)
Table 13 Global Tax Automation Software Revenue Market Share (%) By Applications (2018-2022)
Table 14 Global Tax Automation Software Market Revenue (USD Million) By Regions (2018-2022)
Table 15 Global Tax Automation Software Market Share (%) By Regions (2018-2022)
Table 16 North America Tax Automation Software Revenue (USD Million) By Country (2018-2022)
Table 17 North America Tax Automation Software Revenue (USD Million) By Type (2018-2022)
Table 18 North America Tax Automation Software Revenue (USD Million) By Applications (2018-2022)
Table 19 Europe Tax Automation Software Revenue (USD Million) By Country (2018-2022)
Table 20 Europe Tax Automation Software Revenue (USD Million) By Type (2018-2022)
Table 21 Europe Tax Automation Software Revenue (USD Million) By Applications (2018-2022)
Table 22 Asia Pacific Tax Automation Software Revenue (USD Million) By Country (2018-2022)
Table 23 Asia Pacific Tax Automation Software Revenue (USD Million) By Type (2018-2022)
Table 24 Asia Pacific Tax Automation Software Revenue (USD Million) By Applications (2018-2022)
Table 25 South America Tax Automation Software Revenue (USD Million) By Country (2018-2022)
Table 26 South America Tax Automation Software Revenue (USD Million) By Type (2018-2022)
Table 27 South America Tax Automation Software Revenue (USD Million) By Applications (2018-2022)
Table 28 Middle East and Africa Tax Automation Software Revenue (USD Million) By Region (2018-2022)
Table 29 Middle East and Africa Tax Automation Software Revenue (USD Million) By Type (2018-2022)
Table 30 Middle East and Africa Tax Automation Software Revenue (USD Million) By Applications (2018-2022)
Table 31 Financial Analysis
Table 32 Global Tax Automation Software Revenue (USD Million) By Type (2023-2030)
Table 33 Global Tax Automation Software Revenue Market Share (%) By Type (2023-2030)
Table 34 Global Tax Automation Software Revenue (USD Million) By Applications (2023-2030)
Table 35 Global Tax Automation Software Revenue Market Share (%) By Applications (2023-2030)
Table 36 Global Tax Automation Software Market Revenue (USD Million), And Revenue (USD Million) By Regions (2023-2030)
Table 37 North America Tax Automation Software Revenue (USD)By Country (2023-2030)
Table 38 North America Tax Automation Software Revenue (USD Million) By Type (2023-2030)
Table 39 North America Tax Automation Software Revenue (USD Million) By Applications (2023-2030)
Table 40 Europe Tax Automation Software Revenue (USD Million) By Country (2023-2030)
Table 41 Europe Tax Automation Software Revenue (USD Million) By Type (2023-2030)
Table 42 Europe Tax Automation Software Revenue (USD Million) By Applications (2023-2030)
Table 43 Asia Pacific Tax Automation Software Revenue (USD Million) By Country (2023-2030)
Table 44 Asia Pacific Tax Automation Software Revenue (USD Million) By Type (2023-2030)
Table 45 Asia Pacific Tax Automation Software Revenue (USD Million) By Applications (2023-2030)
Table 46 South America Tax Automation Software Revenue (USD Million) By Country (2023-2030)
Table 47 South America Tax Automation Software Revenue (USD Million) By Type (2023-2030)
Table 48 South America Tax Automation Software Revenue (USD Million) By Applications (2023-2030)
Table 49 Middle East and Africa Tax Automation Software Revenue (USD Million) By Region (2023-2030)
Table 50 Middle East and Africa Tax Automation Software Revenue (USD Million) By Region (2023-2030)
Table 51 Middle East and Africa Tax Automation Software Revenue (USD Million) By Type (2023-2030)
Table 52 Middle East and Africa Tax Automation Software Revenue (USD Million) By Applications (2023-2030)
Table 53 Research Programs/Design for This Report
Table 54 Key Data Information from Secondary Sources
Table 55 Key Data Information from Primary Sources
List of Figures
Figure 1 Market Scope
Figure 2 Porter’s Five Forces
Figure 3 Global Tax Automation Software Revenue (USD Million) By Type (2018-2022)
Figure 4 Global Tax Automation Software Revenue Market Share (%) By Type (2022)
Figure 5 Global Tax Automation Software Revenue (USD Million) By Applications (2018-2022)
Figure 6 Global Tax Automation Software Revenue Market Share (%) By Applications (2022)
Figure 7 Global Tax Automation Software Market Revenue (USD Million) By Regions (2018-2022)
Figure 8 Global Tax Automation Software Market Share (%) By Regions (2022)
Figure 9 North America Tax Automation Software Revenue (USD Million) By Country (2018-2022)
Figure 10 North America Tax Automation Software Revenue (USD Million) By Type (2018-2022)
Figure 11 North America Tax Automation Software Revenue (USD Million) By Applications (2018-2022)
Figure 12 Europe Tax Automation Software Revenue (USD Million) By Country (2018-2022)
Figure 13 Europe Tax Automation Software Revenue (USD Million) By Type (2018-2022)
Figure 14 Europe Tax Automation Software Revenue (USD Million) By Applications (2018-2022)
Figure 15 Asia Pacific Tax Automation Software Revenue (USD Million) By Country (2018-2022)
Figure 16 Asia Pacific Tax Automation Software Revenue (USD Million) By Type (2018-2022)
Figure 17 Asia Pacific Tax Automation Software Revenue (USD Million) By Applications (2018-2022)
Figure 18 South America Tax Automation Software Revenue (USD Million) By Country (2018-2022)
Figure 19 South America Tax Automation Software Revenue (USD Million) By Type (2018-2022)
Figure 20 South America Tax Automation Software Revenue (USD Million) By Applications (2018-2022)
Figure 21 Middle East and Africa Tax Automation Software Revenue (USD Million) By Region (2018-2022)
Figure 22 Middle East and Africa Tax Automation Software Revenue (USD Million) By Type (2018-2022)
Figure 23 Middle East and Africa Tax Automation Software Revenue (USD Million) By Applications (2018-2022)
Figure 24 Global Tax Automation Software Revenue (USD Million) By Type (2023-2030)
Figure 25 Global Tax Automation Software Revenue Market Share (%) By Type (2030)
Figure 26 Global Tax Automation Software Revenue (USD Million) By Applications (2023-2030)
Figure 27 Global Tax Automation Software Revenue Market Share (%) By Applications (2030)
Figure 28 Global Tax Automation Software Market Revenue (USD Million) By Regions (2023-2030)
Figure 29 North America Tax Automation Software Revenue (USD Million) By Country (2023-2030)
Figure 30 North America Tax Automation Software Revenue (USD Million) By Type (2023-2030)
Figure 31 North America Tax Automation Software Revenue (USD Million) By Applications (2023-2030)
Figure 32 Europe Tax Automation Software Revenue (USD Million) By Country (2023-2030)
Figure 33 Europe Tax Automation Software Revenue (USD Million) By Type (2023-2030)
Figure 34 Europe Tax Automation Software Revenue (USD Million) By Applications (2023-2030)
Figure 35 Asia Pacific Tax Automation Software Revenue (USD Million) By Country (2023-2030)
Figure 36 Asia Pacific Tax Automation Software Revenue (USD Million) By Type (2023-2030)
Figure 37 Asia Pacific Tax Automation Software Revenue (USD Million) By Applications (2023-2030)
Figure 38 South America Tax Automation Software Revenue (USD Million) By Country (2023-2030)
Figure 39 South America Tax Automation Software Revenue (USD Million) By Type (2023-2030)
Figure 40 South America Tax Automation Software Revenue (USD Million) By Applications (2023-2030)
Figure 41 Middle East and Africa Tax Automation Software Revenue (USD Million) By Region (2023-2030)
Figure 42 Middle East and Africa Tax Automation Software Revenue (USD Million) By Region (2023-2030)
Figure 43 Middle East and Africa Tax Automation Software Revenue (USD Million) By Type (2023-2030)
Figure 44 Middle East and Africa Tax Automation Software Revenue (USD Million) By Applications (2023-2030)
Figure 45 Bottom-Up and Top-Down Approaches For This Report
Figure 46 Data Triangulation
