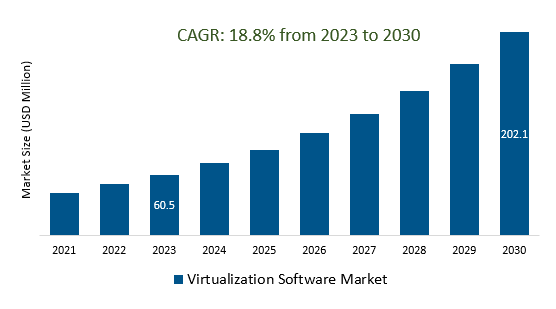
The Global Virtualization Software Market Size is estimated to be US 60.5 billion in 2023. It is poised to register 18.8% growth over the forecast period from 2023 to 2030 to reach US $ 202.1 billion in 2030.
The market growth is driven by the increasing adoption of cloud computing services has driven the demand for virtualization software, as it enables efficient resource allocation and management in cloud environments. Leading Companies focusing on Hybrid and Multi-Cloud Adoption, Edge Computing, 5G and IoT, AI and Machine Learning, Security and Compliance, Automation and Orchestration, Blockchain, DevOps and Continuous Integration/Continuous Deployment (CI/CD), and others to boost market shares in the industry.
Market Overview
The virtualization software market, encompassing server, desktop, network, storage, and application virtualization, has seen widespread adoption with trends including cloud integration, edge computing, automation, and security compliance. Key players such as VMware and Microsoft have driven the industry, but challenges include management complexity and security concerns. The market continues to evolve to meet the demands of hybrid and multi-cloud environments, energy efficiency, and the integration of container technologies, serving as a critical foundation for efficient resource utilization and flexible IT management.
Market Dynamics
Market Trends - Virtualization Software Key to Hybrid and Multi-Cloud Success
Virtualization software is undeniably the linchpin of success in the hybrid and multi-cloud era. In a landscape characterized by diverse cloud providers and evolving infrastructure needs, virtualization stands as the cornerstone for businesses seeking to optimize resource utilization and seamlessly manage their IT environments. By abstracting and decoupling computing resources from physical hardware, it enables organizations to effortlessly navigate the complexities of hybrid and multi-cloud deployments. Whether in the form of server, network, or storage virtualization, these solutions offer the agility to move workloads between on-premises data centers and cloud platforms, ensuring dynamic scalability and cost-efficiency.
Market Driver- Desktop Virtualization Drives Demand for Virtualization Software
The surge in demand for virtualization software is primarily propelled by the adoption of desktop virtualization (VDI). VDI solutions, empowered by virtualization software, have gained prominence due to their ability to streamline desktop management, enhance security, and facilitate remote access, addressing the needs of various sectors, including education and healthcare. Virtualization software plays a vital role in optimizing VDI environments by efficiently managing resources and ensuring secure data handling. This trend reflects the increasing reliance on remote work and digital transformation, making desktop virtualization a pivotal force in reshaping IT infrastructure and user computing experiences.
Market Opportunity- Virtualization Software Promotes Green Computing Initiatives
Virtualization software plays a central role in advancing green computing initiatives and sustainable IT practices by optimizing hardware usage and reducing energy consumption. By consolidating virtual machines on a single server, it minimizes the need for physical hardware, resulting in significant energy and cost savings. This aligns with environmental objectives and supports efficient resource allocation, scalability, and disaster recovery, making it a key element in creating environmentally responsible and cost-effective IT infrastructures.
The Global Virtualization Software Market is analyzed across Network function virtualization, Desktop virtualization, Software-defined storage, Server virtualization, and others. Software is poised to register the fastest growth. Network Function Virtualization (NFV) is a vital component within the virtualization software market, revolutionizing network architecture by virtualizing traditionally hardware-based network functions. These functions, like firewalls and routers, are now executed as software on standard servers and network equipment, delivering enhanced flexibility and cost-effectiveness. The rise of 5G, IoT, and edge computing necessitates agile, software-defined network services, and virtualization software enables the deployment and efficient management of these virtual network functions. As the networking landscape evolves, NFV, driven by virtualization software, shapes the future of network infrastructure and service delivery.
Market Share Analysis- Mobile Virtualization held a significant market share in 2023
The Global Virtualization Software Market is analyzed across various Platforms including PC Virtualization, Mobile Virtualization, and others. Of these, Mobile Virtualization held a significant market share in 2023. Mobile virtualization, a vital segment of the virtualization software market, enables the concurrent operation of multiple virtual instances of mobile operating systems and applications on a single physical device. It addresses the need for enhanced security and device management, making it valuable for both personal and business use. Mobile virtualization is increasingly relevant in the context of diverse mobile operating systems, ensuring secure and efficient mobile device management. It separates work-related and personal content on a single device, enhancing data security and privacy compliance, and will continue to play a crucial role in providing secure and efficient mobile experiences.
Virtualization Software Market Segmentation
By Technology
- Network function virtualization
- Desktop virtualization
- Software-defined storage
- Server virtualization
By Platform
- PC Virtualization
- Mobile Virtualization
By Region
- North America (United States, Canada, Mexico)
- Europe (Germany, France, United Kingdom, Spain, Italy, Others)
- Asia Pacific (China, India, Japan, South Korea, Australia, Others)
- Latin America (Brazil, Argentina, Others)
- Middle East and Africa (Saudi Arabia, UAE, Kuwait, Other Middle East, South Africa, Nigeria, Other Africa)
Virtualization Software Market Companies
- Citrix Systems Inc
- Google LLC
- VMware Inc
- Microsoft Corp
- Red Hat Inc
- Lynx Software Technologies
- Amazon Inc
- NComupting Co Ltd
- Parallels International GmbH
- Datadog Inc
- Nutanix Inc
- TenAsys Corp
- Huawei Technologies Co Ltd
*List not exhaustive
Virtualization Software Market Outlook 2023
1 Market Overview
1.1 Introduction to the Virtualization Software Market
1.2 Scope of the Study
1.3 Research Objective
1.3.1 Key Market Scope and Segments
1.3.2 Players Covered
1.3.3 Years Considered
2 Executive Summary
2.1 2023 Virtualization Software Industry- Market Statistics
3 Market Dynamics
3.1 Market Drivers
3.2 Market Challenges
3.3 Market Opportunities
3.4 Market Trends
4 Market Factor Analysis
4.1 Porter’s Five Forces
4.2 Market Entropy
4.2.1 Global Virtualization Software Market Companies with Area Served
4.2.2 Products Offerings Global Virtualization Software Market
5 COVID-19 Impact Analysis and Outlook Scenarios
5.1.1 Covid-19 Impact Analysis
5.1.2 post-COVID-19 Scenario- Low Growth Case
5.1.3 post-COVID-19 Scenario- Reference Growth Case
5.1.4 post-COVID-19 Scenario- Low Growth Case
6 Global Virtualization Software Market Trends
6.1 Global Virtualization Software Revenue (USD Million) and CAGR (%) by Type (2018-2030)
6.2 Global Virtualization Software Revenue (USD Million) and CAGR (%) by Applications (2018-2030)
6.3 Global Virtualization Software Revenue (USD Million) and CAGR (%) by regions (2018-2030)
7 Global Virtualization Software Market Revenue (USD Million) by Type, and Applications (2018-2022)
7.1 Global Virtualization Software Revenue (USD Million) by Type (2018-2022)
7.1.1 Global Virtualization Software Revenue (USD Million), Market Share (%) by Type (2018-2022)
7.2 Global Virtualization Software Revenue (USD Million) by Applications (2018-2022)
7.2.1 Global Virtualization Software Revenue (USD Million), Market Share (%) by Applications (2018-2022)
8 Global Virtualization Software Development Regional Status and Outlook
8.1 Global Virtualization Software Revenue (USD Million) By Regions (2018-2022)
8.2 North America Virtualization Software Revenue (USD Million) by Type, and Application (2018-2022)
8.2.1 North America Virtualization Software Revenue (USD Million) by Country (2018-2022)
8.2.2 North America Virtualization Software Revenue (USD Million) by Type (2018-2022)
8.2.3 North America Virtualization Software Revenue (USD Million) by Applications (2018-2022)
8.3 Europe Virtualization Software Revenue (USD Million), by Type, and Applications (USD Million) (2018-2022)
8.3.1 Europe Virtualization Software Revenue (USD Million), by Country (2018-2022)
8.3.2 Europe Virtualization Software Revenue (USD Million) by Type (2018-2022)
8.3.3 Europe Virtualization Software Revenue (USD Million) by Applications (2018-2022)
8.4 Asia Pacific Virtualization Software Revenue (USD Million), and Revenue (USD Million) by Type, and Applications (2018-2022)
8.4.1 Asia Pacific Virtualization Software Revenue (USD Million) by Country (2018-2022)
8.4.2 Asia Pacific Virtualization Software Revenue (USD Million) by Type (2018-2022)
8.4.3 Asia Pacific Virtualization Software Revenue (USD Million) by Applications (2018-2022)
8.5 South America Virtualization Software Revenue (USD Million), by Type, and Applications (2018-2022)
8.5.1 South America Virtualization Software Revenue (USD Million), by Country (2018-2022)
8.5.2 South America Virtualization Software Revenue (USD Million) by Type (2018-2022)
8.5.3 South America Virtualization Software Revenue (USD Million) by Applications (2018-2022)
8.6 Middle East and Africa Virtualization Software Revenue (USD Million), by Type, Technology, Application, Thickness (2018-2022)
8.6.1 Middle East and Africa Virtualization Software Revenue (USD Million) by Country (2018-2022)
8.6.2 Middle East and Africa Virtualization Software Revenue (USD Million) by Type (2018-2022)
8.6.3 Middle East and Africa Virtualization Software Revenue (USD Million) by Applications (2018-2022)
9 Company Profiles
10 Global Virtualization Software Market Revenue (USD Million), by Type, and Applications (2023-2030)
10.1 Global Virtualization Software Revenue (USD Million) and Market Share (%) by Type (2023-2030)
10.1.1 Global Virtualization Software Revenue (USD Million), and Market Share (%) by Type (2023-2030)
10.2 Global Virtualization Software Revenue (USD Million) and Market Share (%) by Applications (2023-2030)
10.2.1 Global Virtualization Software Revenue (USD Million), and Market Share (%) by Applications (2023-2030)
11 Global Virtualization Software Development Regional Status and Outlook Forecast
11.1 Global Virtualization Software Revenue (USD Million) By Regions (2023-2030)
11.2 North America Virtualization Software Revenue (USD Million) by Type, and Applications (2023-2030)
11.2.1 North America Virtualization Software Revenue (USD) Million by Country (2023-2030)
11.2.2 North America Virtualization Software Revenue (USD Million), by Type (2023-2030)
11.2.3 North America Virtualization Software Revenue (USD Million), Market Share (%) by Applications (2023-2030)
11.3 Europe Virtualization Software Revenue (USD Million), by Type, and Applications (2023-2030)
11.3.1 Europe Virtualization Software Revenue (USD Million), by Country (2023-2030)
11.3.2 Europe Virtualization Software Revenue (USD Million), by Type (2023-2030)
11.3.3 Europe Virtualization Software Revenue (USD Million), by Applications (2023-2030)
11.4 Asia Pacific Virtualization Software Revenue (USD Million) by Type, and Applications (2023-2030)
11.4.1 Asia Pacific Virtualization Software Revenue (USD Million), by Country (2023-2030)
11.4.2 Asia Pacific Virtualization Software Revenue (USD Million), by Type (2023-2030)
11.4.3 Asia Pacific Virtualization Software Revenue (USD Million), by Applications (2023-2030)
11.5 South America Virtualization Software Revenue (USD Million), by Type, and Applications (2023-2030)
11.5.1 South America Virtualization Software Revenue (USD Million), by Country (2023-2030)
11.5.2 South America Virtualization Software Revenue (USD Million), by Type (2023-2030)
11.5.3 South America Virtualization Software Revenue (USD Million), by Applications (2023-2030)
11.6 Middle East and Africa Virtualization Software Revenue (USD Million), by Type, and Applications (2023-2030)
11.6.1 Middle East and Africa Virtualization Software Revenue (USD Million), by region (2023-2030)
11.6.2 Middle East and Africa Virtualization Software Revenue (USD Million), by Type (2023-2030)
11.6.3 Middle East and Africa Virtualization Software Revenue (USD Million), by Applications (2023-2030)
12 Methodology and Data Sources
12.1 Methodology/Research Approach
12.1.1 Research Programs/Design
12.1.2 Market Size Estimation
12.1.3 Market Breakdown and Data Triangulation
12.2 Data Sources
12.2.1 Secondary Sources
12.2.2 Primary Sources
12.3 Disclaimer
List of Tables
Table 1 Market Segmentation Analysis
Table 2 Global Virtualization Software Market Companies with Areas Served
Table 3 Products Offerings Global Virtualization Software Market
Table 4 Low Growth Scenario Forecasts
Table 5 Reference Case Growth Scenario
Table 6 High Growth Case Scenario
Table 7 Global Virtualization Software Revenue (USD Million) And CAGR (%) By Type (2018-2030)
Table 8 Global Virtualization Software Revenue (USD Million) And CAGR (%) By Applications (2018-2030)
Table 9 Global Virtualization Software Revenue (USD Million) And CAGR (%) By Regions (2018-2030)
Table 10 Global Virtualization Software Revenue (USD Million) By Type (2018-2022)
Table 11 Global Virtualization Software Revenue Market Share (%) By Type (2018-2022)
Table 12 Global Virtualization Software Revenue (USD Million) By Applications (2018-2022)
Table 13 Global Virtualization Software Revenue Market Share (%) By Applications (2018-2022)
Table 14 Global Virtualization Software Market Revenue (USD Million) By Regions (2018-2022)
Table 15 Global Virtualization Software Market Share (%) By Regions (2018-2022)
Table 16 North America Virtualization Software Revenue (USD Million) By Country (2018-2022)
Table 17 North America Virtualization Software Revenue (USD Million) By Type (2018-2022)
Table 18 North America Virtualization Software Revenue (USD Million) By Applications (2018-2022)
Table 19 Europe Virtualization Software Revenue (USD Million) By Country (2018-2022)
Table 20 Europe Virtualization Software Revenue (USD Million) By Type (2018-2022)
Table 21 Europe Virtualization Software Revenue (USD Million) By Applications (2018-2022)
Table 22 Asia Pacific Virtualization Software Revenue (USD Million) By Country (2018-2022)
Table 23 Asia Pacific Virtualization Software Revenue (USD Million) By Type (2018-2022)
Table 24 Asia Pacific Virtualization Software Revenue (USD Million) By Applications (2018-2022)
Table 25 South America Virtualization Software Revenue (USD Million) By Country (2018-2022)
Table 26 South America Virtualization Software Revenue (USD Million) By Type (2018-2022)
Table 27 South America Virtualization Software Revenue (USD Million) By Applications (2018-2022)
Table 28 Middle East and Africa Virtualization Software Revenue (USD Million) By Region (2018-2022)
Table 29 Middle East and Africa Virtualization Software Revenue (USD Million) By Type (2018-2022)
Table 30 Middle East and Africa Virtualization Software Revenue (USD Million) By Applications (2018-2022)
Table 31 Financial Analysis
Table 32 Global Virtualization Software Revenue (USD Million) By Type (2023-2030)
Table 33 Global Virtualization Software Revenue Market Share (%) By Type (2023-2030)
Table 34 Global Virtualization Software Revenue (USD Million) By Applications (2023-2030)
Table 35 Global Virtualization Software Revenue Market Share (%) By Applications (2023-2030)
Table 36 Global Virtualization Software Market Revenue (USD Million), And Revenue (USD Million) By Regions (2023-2030)
Table 37 North America Virtualization Software Revenue (USD)By Country (2023-2030)
Table 38 North America Virtualization Software Revenue (USD Million) By Type (2023-2030)
Table 39 North America Virtualization Software Revenue (USD Million) By Applications (2023-2030)
Table 40 Europe Virtualization Software Revenue (USD Million) By Country (2023-2030)
Table 41 Europe Virtualization Software Revenue (USD Million) By Type (2023-2030)
Table 42 Europe Virtualization Software Revenue (USD Million) By Applications (2023-2030)
Table 43 Asia Pacific Virtualization Software Revenue (USD Million) By Country (2023-2030)
Table 44 Asia Pacific Virtualization Software Revenue (USD Million) By Type (2023-2030)
Table 45 Asia Pacific Virtualization Software Revenue (USD Million) By Applications (2023-2030)
Table 46 South America Virtualization Software Revenue (USD Million) By Country (2023-2030)
Table 47 South America Virtualization Software Revenue (USD Million) By Type (2023-2030)
Table 48 South America Virtualization Software Revenue (USD Million) By Applications (2023-2030)
Table 49 Middle East and Africa Virtualization Software Revenue (USD Million) By Region (2023-2030)
Table 50 Middle East and Africa Virtualization Software Revenue (USD Million) By Region (2023-2030)
Table 51 Middle East and Africa Virtualization Software Revenue (USD Million) By Type (2023-2030)
Table 52 Middle East and Africa Virtualization Software Revenue (USD Million) By Applications (2023-2030)
Table 53 Research Programs/Design for This Report
Table 54 Key Data Information from Secondary Sources
Table 55 Key Data Information from Primary Sources
List of Figures
Figure 1 Market Scope
Figure 2 Porter’s Five Forces
Figure 3 Global Virtualization Software Revenue (USD Million) By Type (2018-2022)
Figure 4 Global Virtualization Software Revenue Market Share (%) By Type (2022)
Figure 5 Global Virtualization Software Revenue (USD Million) By Applications (2018-2022)
Figure 6 Global Virtualization Software Revenue Market Share (%) By Applications (2022)
Figure 7 Global Virtualization Software Market Revenue (USD Million) By Regions (2018-2022)
Figure 8 Global Virtualization Software Market Share (%) By Regions (2022)
Figure 9 North America Virtualization Software Revenue (USD Million) By Country (2018-2022)
Figure 10 North America Virtualization Software Revenue (USD Million) By Type (2018-2022)
Figure 11 North America Virtualization Software Revenue (USD Million) By Applications (2018-2022)
Figure 12 Europe Virtualization Software Revenue (USD Million) By Country (2018-2022)
Figure 13 Europe Virtualization Software Revenue (USD Million) By Type (2018-2022)
Figure 14 Europe Virtualization Software Revenue (USD Million) By Applications (2018-2022)
Figure 15 Asia Pacific Virtualization Software Revenue (USD Million) By Country (2018-2022)
Figure 16 Asia Pacific Virtualization Software Revenue (USD Million) By Type (2018-2022)
Figure 17 Asia Pacific Virtualization Software Revenue (USD Million) By Applications (2018-2022)
Figure 18 South America Virtualization Software Revenue (USD Million) By Country (2018-2022)
Figure 19 South America Virtualization Software Revenue (USD Million) By Type (2018-2022)
Figure 20 South America Virtualization Software Revenue (USD Million) By Applications (2018-2022)
Figure 21 Middle East and Africa Virtualization Software Revenue (USD Million) By Region (2018-2022)
Figure 22 Middle East and Africa Virtualization Software Revenue (USD Million) By Type (2018-2022)
Figure 23 Middle East and Africa Virtualization Software Revenue (USD Million) By Applications (2018-2022)
Figure 24 Global Virtualization Software Revenue (USD Million) By Type (2023-2030)
Figure 25 Global Virtualization Software Revenue Market Share (%) By Type (2030)
Figure 26 Global Virtualization Software Revenue (USD Million) By Applications (2023-2030)
Figure 27 Global Virtualization Software Revenue Market Share (%) By Applications (2030)
Figure 28 Global Virtualization Software Market Revenue (USD Million) By Regions (2023-2030)
Figure 29 North America Virtualization Software Revenue (USD Million) By Country (2023-2030)
Figure 30 North America Virtualization Software Revenue (USD Million) By Type (2023-2030)
Figure 31 North America Virtualization Software Revenue (USD Million) By Applications (2023-2030)
Figure 32 Europe Virtualization Software Revenue (USD Million) By Country (2023-2030)
Figure 33 Europe Virtualization Software Revenue (USD Million) By Type (2023-2030)
Figure 34 Europe Virtualization Software Revenue (USD Million) By Applications (2023-2030)
Figure 35 Asia Pacific Virtualization Software Revenue (USD Million) By Country (2023-2030)
Figure 36 Asia Pacific Virtualization Software Revenue (USD Million) By Type (2023-2030)
Figure 37 Asia Pacific Virtualization Software Revenue (USD Million) By Applications (2023-2030)
Figure 38 South America Virtualization Software Revenue (USD Million) By Country (2023-2030)
Figure 39 South America Virtualization Software Revenue (USD Million) By Type (2023-2030)
Figure 40 South America Virtualization Software Revenue (USD Million) By Applications (2023-2030)
Figure 41 Middle East and Africa Virtualization Software Revenue (USD Million) By Region (2023-2030)
Figure 42 Middle East and Africa Virtualization Software Revenue (USD Million) By Region (2023-2030)
Figure 43 Middle East and Africa Virtualization Software Revenue (USD Million) By Type (2023-2030)
Figure 44 Middle East and Africa Virtualization Software Revenue (USD Million) By Applications (2023-2030)
Figure 45 Bottom-Up and Top-Down Approaches for This Report
Figure 46 Data Triangulation
