Biodegradable Tableware Market Outlook: Eco-Friendly Dining Trends & Growth Potential (2025–2034)
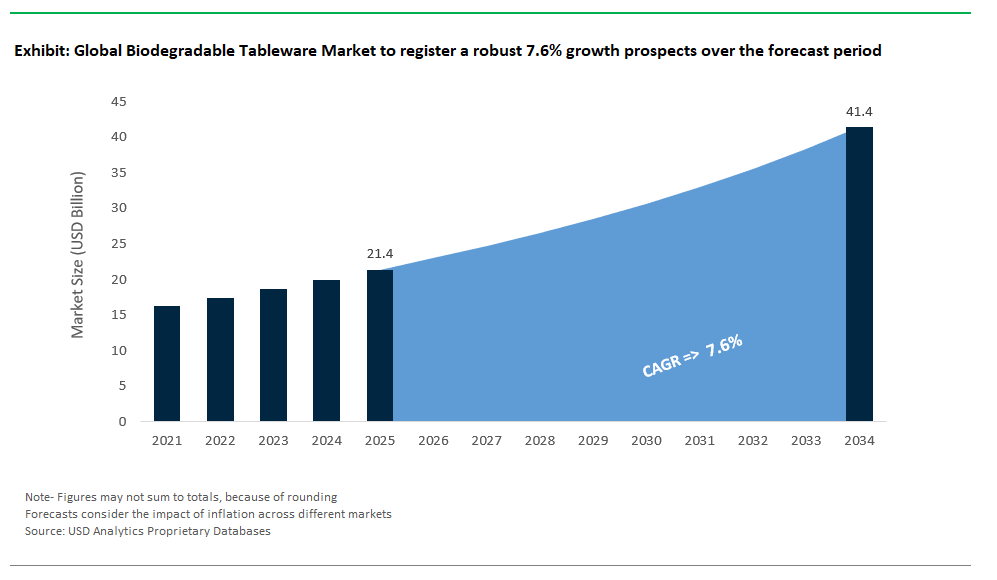
The Global Biodegradable Tableware Market is poised for strong growth between 2025 and 2034, as environmental regulations tighten and consumers worldwide increasingly demand sustainable alternatives to single-use plastics in foodservice and hospitality. Industry forecasts project the market will grow from USD 21.4 billion in 2025 to USD 41.4 billion by 2034, reflecting a solid CAGR of 7.6%. Rising bans on plastic tableware, coupled with growing eco-consciousness across households, foodservice businesses, and retailers, are propelling widespread adoption of biodegradable materials in everyday dining and catering applications.
The latest edition, fueled by proprietary data from USDAnalytics, offers a detailed assessment and forecast of the global Biodegradable Tableware Market, spanning 21 countries and featuring profiles of more than 20 key companies- By Material Type (Bagasse (Sugarcane Fiber), Bamboo, Palm Leaf, Paper & Paperboard, Bioplastics, Wheat Bran, Wood), By Product Type (Plates & Trays, Bowls & Containers, Cups & Glasses, Cutlery, Straws & Stirrers, Others), By End-Use Industry (Foodservice Industry, Hotels & Hospitality, Institutional, Household Use, Retail & E-commerce), By Distribution Channel (Supermarkets & Hypermarkets, Specialty Stores, Small Retail Stores, Online Retail / E-commerce, Direct Sales).
Highlighting critical trends reshaping the industry, this analysis explores the rapid diversification of biodegradable materials such as bagasse and bamboo for durable, compostable, and visually appealing tableware solutions. It examines technological advancements in manufacturing that enhance product strength and heat resistance, the evolution of designs tailored for upscale hospitality markets, and innovations in bioplastics and wheat bran tableware responding to both regulatory mandates and consumer expectations. The report also evaluates shifts in distribution dynamics, from booming online retail channels to direct sales partnerships with large foodservice chains. Packed with actionable insights and validated data, this report serves as an essential guide for manufacturers, distributors, hospitality brands, investors, and policymakers aiming to capitalize on sustainable growth opportunities in the biodegradable tableware market through 2034.
Market Analysis of the Biodegradable Tableware Market: Future Opportunities
The global biodegradable tableware market is booming, driven by new regulations against single-use plastics, brand pledges for sustainability, and material innovations. This sector is quickly moving away from traditional plastics, embracing renewable, compostable, and even edible materials that meet performance, compliance, and environmental goals. The market is maturing from small-scale alternatives to widespread adoption in foodservice, retail, and travel.
Innovative Products Lead the Way
The biodegradable tableware market is seeing impressive progress as new products deliver both material innovation and enhanced functionality. Leading companies like Huhtamaki are setting high sustainability benchmarks with advanced compostable tableware solutions designed to reduce environmental impact. Dart Container is introducing PLA-coated paper cups that feature plant-based waterproof barriers, offering both compostability and reliable leak resistance for foodservice applications. Similarly, Pactiv Evergreen has developed compostable bowls capable of withstanding high temperatures while fully degrading after use, ensuring convenience without compromising sustainability. These breakthroughs demonstrate that biopolymers can effectively rival traditional plastics, combining strong performance with significant environmental benefits, and positioning compostable tableware as a key solution in the shift toward sustainable packaging.
Production Capacity is Growing
Investments in capacity show the market is ready for large-scale production. Stora Enso has significantly expanded its molded fiber production, boosting the supply of biodegradable plates and trays. Biotrem is scaling up wheat bran tableware production to meet demand for natural, low-impact options. CKF's molded pulp facilities in North America are increasing capacity to help clients switch from banned plastics to compostable solutions. These expansions confirm that the supply chain is prepared for surging demand from regulations and company pledges.
Partnerships Drive Adoption
Collaborations are key to scaling up and building the necessary infrastructure. Major foodservice brands like McDonald's are moving to molded fiber packaging, showing mainstream acceptance. Industry groups are working to standardize collection and composting for bioplastic cups, closing a historical gap. Brand-led initiatives, like Taco Bell's partnership with Terracycle for sauce packet recycling, demonstrate how companies can create practical closed-loop systems.
Regulations Accelerate the Shift
Global policies are forcing rapid change. The EU's Single-Use Plastics Directive, effective from July 2021, banned many plastic items like cutlery and plates, making bio-based and compostable options the standard. India's Plastic Waste Management Rules, banning specific single-use plastics from July 2022, have caused a huge shift to alternatives like bagasse in food delivery. California's AB 1276 is pushing for single-use foodware to be provided only by request, supporting a broader move to compostable items. These rules are creating huge demand and encouraging investment in bio-based tableware.
Tech Breakthroughs Improve Performance
Advances in material science are solving old problems like heat resistance and strength. Research into nanocellulose-reinforced bagasse is improving strength and heat tolerance for biodegradable plates. New bio-based composites are being developed for microwave-safe, compostable meal packaging. Edible seaweed coatings are emerging for paper plates, offering extended shelf life and safety, appealing to industries seeking zero-waste solutions. These breakthroughs expand biodegradable tableware to hot and high-moisture applications.
Commercial Success Confirms Viability
Widespread adoption by top brands proves biodegradable tableware is ready and scalable. Starbucks is using biodegradable solutions for high-volume cold beverage packaging. Advanced biodegradable tableware is gaining traction in premium travel sectors like airline catering. Digital platforms like Swiggy are driving massive shifts to sustainable packaging in India, showing how regulations and consumer preferences can create system-wide change.
Market Dynamics: Biodegradable Tableware Industry
Trend: Marine-Biodegradable Tableware Transforms Coastal Sustainability and Ocean Health
The global biodegradable tableware industry is undergoing a major transformation as manufacturers shift toward marine-biodegradable products made from upcycled seaweed and aquaculture waste. This innovation directly tackles the urgent problem of plastic waste polluting oceans, offering tableware designed to break down in seawater within a few months, a huge improvement over traditional plastics that persist for centuries. Companies like Notpla are leading the way with alginate-kelp composites that biodegrade naturally in as little as 4–6 weeks in home composting conditions, delivering sustainable alternatives without sacrificing functionality. Other innovators are using biopolymers derived from aquaculture waste to produce tableware that rivals conventional plastics in durability, proving that sustainable materials can also meet performance demands.
Regulatory policies are driving this shift, with measures like the EU Single-Use Plastics Directive banning certain plastic products and APAC countries pushing for marine-friendly alternatives to reduce plastic waste. The benefits of marine-biodegradable tableware are significant, offering a solution to plastic and microplastic pollution, especially in regions reliant on coastal tourism. This transition not only helps protect marine ecosystems but also positions marine-biodegradable tableware as a powerful market differentiator, aligning environmental responsibility with emerging consumer and regulatory expectations in the global tableware market.
Opportunity: Edible Biodegradable Tableware Integrates Functional Additives for Food Preservation and Zero-Waste Solutions
Beyond the goal of replacing conventional plastics, the biodegradable tableware market is embracing an exciting opportunity in edible tableware infused with functional additives that directly enhance food safety and extend shelf life. Companies are pioneering edible solutions that address food waste at its source. For example, India’s Bakeys has developed cinnamon oil-infused rice bran bowls that inhibit microbial growth, keeping meals fresh for an additional three hours, even in humid climates, a game-changer for foodservice in tropical regions. Similarly, South Korea’s Yuhan Chemical has innovated probiotic wheat straw trays containing Bacillus subtilis, which reduce food spoilage by up to 90% compared to plastic containers, opening new avenues for health-conscious and sustainable dining experiences.
The value proposition extends far beyond immediate food safety benefits. Post-use, edible tableware products can serve as animal feed with nutrition-enhanced formulations or act as compost accelerators, facilitating decomposition 30% faster than traditional organic waste. This closed-loop sustainability approach not only eliminates waste but also aligns perfectly with global circular economy goals. As consumer demand grows for eco-friendly and multifunctional dining solutions, edible biodegradable tableware infused with active food-preserving compounds is poised to capture significant market share, positioning itself as the next frontier in sustainable foodservice innovation.
Competitive Landscape of the Global Biodegradable Tableware Market
The global biodegradable tableware market is booming in 2024, driven by global bans on single-use plastics, rising eco-consciousness among consumers, and surging demand from hospitality and foodservice sectors for sustainable alternatives. Innovations span materials like PLA-lined fiber, wheat bran, palm leaves, bamboo, bagasse, and even seaweed, delivering compostable, edible, or carbon-negative solutions. Market leaders are scaling production, investing in regional manufacturing, and forging partnerships with major brands and foodservice chains. The competitive landscape reflects a vibrant, fast-moving industry poised to redefine disposable tableware with sustainable and innovative products.
Pactiv Evergreen: Major Force in North American Biodegradable Tableware
Pactiv Evergreen (US) Pactiv Evergreen is a major force in the North American biodegradable tableware market. Their EarthChoice® PFAS-Free fiber blend containers and tableware are made with a blend of bagasse (sugar cane), bamboo, or wood fibers, which are renewable resources. These products are BPI-certified to be commercially compostable only and meet ASTM D6868 compostability standards. Pactiv Evergreen's "Compostable Collection" includes PLA-coated paper products that meet ASTM D6868 compostability standards. Pactiv Evergreen offers a breadth of products to meet off-premise packaging needs for restaurants, emphasizing sustainable solutions that are commercially compostable, recyclable, and/or made of recycled or renewable materials.
Huhtamaki: Leading in Premium Biodegradable Tableware for Global Hospitality
Huhtamaki (Finland) continues to lead in premium biodegradable tableware for global hospitality markets. Huhtamaki offers a range of foodservice packaging and tableware solutions, including those made from molded fiber like Chinet Classic® and Envirable™. Their Huhtamaki Future Smart™ paper cup is made of 100% renewable plant-based materials and uses sugarcane plant-based coating. The bagasse tableware product market, where Huhtamaki is a strategic competitor, was estimated at USD 5.70 billion in 2024 and is expected to grow significantly. Huhtamaki provides a vast array of products – plates, bowls, cups, and trays – based on bagasse, and is active in more than 30 countries. Huhtamaki emphasizes continuous investment in research and development to innovate new bagasse products and reduce its carbon footprint.
Dart Container: Strengthening Compostable Offerings with Solo® Brand
Dart Container (US) Dart Container, renowned for its Solo® brand, has significantly strengthened its compostable offerings. Dart's SOLO® Compostable Paper Dinnerware* can serve hot or cold food with durable, moisture-resistant qualities. These products are BPI-certified compostable in commercial facilities and meet ASTM D6868 standards. They include paper plates and bowls, with options for classic white or ProPlanet™ Seal stock print. In the global eco-friendly tableware market, Dart Container is a key player, holding a Significant market share.
Vegware: Committed to Certified Compostable Tableware Solutions
Vegware (UK) Vegware stands out for its commitment to compostable tableware. Vegware is a leading brand in compostable foodservice packaging, offering products certified by BPI and other compostability standards. Their materials section indicates the use of PLA (polylactic acid), derived from plant sugars, for clear products and as a lining for board-based products. Vegware also highlights its expertise in helping clients find composting solutions for their used products and boasts a deep set of compostability certifications.
Biotrem: Unique Patented Wheat Bran Tableware
Biotrem (Poland) Biotrem offers one of the most unique products in the biodegradable tableware industry: patented wheat bran plates and bowls that fully decompose within 30 days and are even edible. Biotrem's current production line's performance is estimated at approximately 15 million pieces of biodegradable disposable plates or bowls a year. Their manufacturing facility in Zambrow, Poland, located in an ecologically clean, traditionally agricultural region, has permanent access to high-quality raw material. Biotrem products are fully biodegradable through composting in just 30 days and are suitable for serving hot and cold meals, and can be used in classic ovens or microwave ovens.
Yash Pakka: Emerging Global Supplier Through CHUK Brand
Yash Pakka (India) Yash Pakka is rapidly emerging as a major global supplier of biodegradable tableware through its CHUK brand. CHUK manufactures compostable and biodegradable tableware using bagasse as a raw material, including plates, compartment plates, bowls, and containers. Yash Pakka's manufacturing capacity for paper is 39,100 tonnes and for pulp is 42,900 tonnes. All CHUK products are biodegradable and compost within 180 days. Yash Pakka emphasizes its commitment to sustainable packaging solutions and aims to expand its global reach. Yash Pakka has significantly expanded its capacity over the years and is a solution provider for sustainable packaging. Yash Pakka supplies its products to over 40 countries, and aims to build the largest compostable packaging factory in the world (in the Americas) to serve that market.
Market Share Analysis: Biodegradable Tableware Market
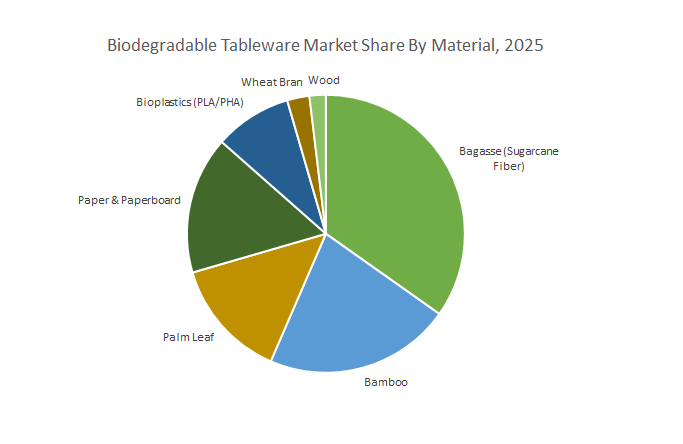
By Material Type: Bagasse Leads Market Share, Bioplastics Grow Fastest
In 2025, bagasse (sugarcane fiber) dominates the biodegradable tableware market with a 38.4% share, thanks to its cost-effectiveness, strength, and abundance as an agricultural byproduct. Bioplastics (PLA/PHA) represent the fastest-growing segment with a CAGR of 8.2%, fueled by rising adoption in transparent cups, cutlery, and foodservice applications where compostability and visual appeal are both key. Bamboo is also surging, as premium hospitality brands embrace its durability and natural look for eco-luxury experiences. Palm leaf, paper, wheat bran, and wood each contribute unique sustainability and aesthetic benefits across diverse market niches.
By Product Type: Plates & Trays Dominate, Straws & Stirrers Post Explosive Growth
Plates and trays lead the product landscape, accounting for 39.1% of demand in 2025, as foodservice and takeaway sectors drive the transition from conventional plastics to compostable, renewable solutions. Straws and stirrers show the highest growth, as global single-use plastic bans boost demand for compostable alternatives in QSRs, cafes, and bars. Cutlery is another fast-growing area, with edible, bamboo, and wheat-based innovations gaining traction in the premium segment.
By End-Use Industry: Foodservice Sector Leads, Retail & E-Commerce Grow Most Rapidly
The foodservice industry remains the largest end-use segment, holding a significant market share in 2025, as quick service restaurants, cafes, and catering operations rapidly transition to sustainable tableware to comply with regulations and meet customer preferences. Retail and e-commerce channels are the fastest-growing, with a CAGR of 8.5%, driven by consumers purchasing compostable tableware for home use and celebrations. Hotels and hospitality are also significant adopters, particularly for premium bamboo and palm leaf products that align with eco-luxury branding and guest expectations.
China Dominates Global Biodegradable Tableware Production
China has firmly established itself as the world’s largest producer and market leader in the biodegradable tableware industry. With a significant production capacity, China accounts for a large share of global supply. Major players such as Kingfa are producing vast quantities of PLA/PBAT-based cutlery. Kingfa is actively participating in industry events in 2025, showcasing their innovative products and solutions, including those focused on sustainable development and circular economy in the plastics and rubber industry, which aligns with their position in biodegradable materials. Zhejiang Hisun Biomaterials focuses on high-volume PLA tableware production. Policy is a significant driver: by 2025, China continues to implement mandates promoting biodegradable materials in packaging, influencing both domestic consumption and manufacturing output. Leading companies like Alibaba are actively promoting the use of sustainable packaging in their operations. China is solidifying its status as a cornerstone of the global biodegradable tableware supply chain.
India Becomes Fastest-Growing Biodegradable Tableware Market
India is emerging as a rapidly growing biodegradable tableware market, with significant growth projected for 2023–2025. The surge is driven by booming domestic demand and a thriving export sector. Indigenous materials such as sugarcane bagasse account for a substantial portion of India’s eco-tableware production, offering a sustainable alternative for disposable plates, bowls, and food containers. Meanwhile, areca palm leaf tableware is gaining popularity in export markets, including Europe and the United States, valued for its natural aesthetics and compostability. The India biodegradable tableware & packaging products market size was valued at USD 2.15 billion in 2024 and is expected to grow at a CAGR of 6.0% from 2024 to 2030, driven by increased awareness of plastic pollution and government regulations on single-use plastics. Indian food delivery giants like Zomato and Swiggy are committed to using sustainable tableware, accelerating market adoption. The government is also fueling growth through various initiatives supporting micro, small, and medium enterprises (MSMEs) involved in manufacturing compostable tableware. India’s unique blend of natural materials, cost-competitive manufacturing, and policy support positions it as a major future player in the global biodegradable tableware sector.
United States Sees Growth Fueled by Premium Demand and Regulation
The United States is witnessing robust expansion in the biodegradable tableware sector, propelled by both regulatory mandates and consumer demand for premium sustainable products. Leading companies like Eco-Products produce PLA-based cold cups and compostable cutlery, while World Centric specializes in bagasse-based tableware designed for compostability and durability. Regulatory developments such as California’s SB 54, which restricts single-use plastic foodware, are acting as significant catalysts for industry growth. The U.S. biodegradable tableware market was valued at USD 2.67 billion in 2024 and is expected to reach USD 3.89 billion by 2030, growing at a CAGR of 6.53%, driven by heightened environmental awareness, stricter government regulations on single-use plastics, and a growing consumer shift toward eco-friendly alternatives. Major brands are responding, with McDonald’s continuing to explore and test sustainable packaging alternatives, signaling mainstream acceptance of biodegradable options. The investment landscape remains dynamic, with ongoing funding directed toward compostable packaging startups. These trends underscore the U.S. market’s dual appeal as both a center of sustainability-driven innovation and a lucrative segment for premium biodegradable tableware products.
Germany Drives Biodegradable Tableware Innovation in Europe
Germany remains the EU’s innovation hub for biodegradable tableware solutions, leveraging strong research capabilities and stringent environmental regulations. Key innovations include BASF’s Ecovio® compostable food containers, which deliver both strength and biodegradability. As of May 2025, BASF is actively promoting its Ecovio 70 PS14H6 biopolymer coating for compostable paper and paperboard food packaging, which is home compostable and offers excellent barrier properties. Bio-lutions’ tableware is produced from agricultural waste, further minimizing both plastic waste and agricultural residue. Bio-lutions continues to focus on dry molded packaging solutions made from agricultural waste, emphasizing their recyclability and affordability as alternatives to single-use plastics. Regulatory momentum is building, with the EU Single-Use Plastics Directive enforcing biodegradable alternatives in packaging and tableware. Notably, Südzucker is expanding its sustainable packaging initiatives, including the use of starch-based materials. Researchers at the Fraunhofer Institute, in collaboration with partners, have developed home-compostable single-use tableware based on local agricultural residue from sugar production, which will be transitioned to an industrial scale for marketing by July 2025. Germany’s combination of technical expertise, regulatory drivers, and sustainability-focused manufacturing keeps it at the forefront of Europe’s biodegradable tableware industry.
Thailand Emerges as ASEAN’s Biodegradable Tableware Hub
Thailand is establishing itself as Southeast Asia’s leading production hub for biodegradable tableware, driven by abundant natural resources and growing export demand. The country is renowned for innovative materials, including cassava starch used to produce eco-friendly cutlery exported to markets such as the EU and Japan, and rice husk-based bowls that combine sustainability with unique aesthetics. PTT MCC Biochem has expanded its production capacity for PLA tableware, signaling Thailand’s commitment to scaling production. Additionally, SCG Packaging supplies major clients with biodegradable cups, highlighting Thailand’s integration into both regional and international supply chains. Thailand is actively promoting bioplastics through the Bio-Circular-Green (BCG) Economy model, with initiatives aimed at developing bio-based industries, including bioplastics for various applications such as packaging and tableware. The country's strategic location and agricultural resources make it an attractive hub for bioplastics production in ASEAN. Thailand’s strategic focus on renewable resources and bioplastics positions it as a crucial player in the global biodegradable tableware market.
Italy Blends Biodegradability with Luxury and Design
Italy stands out in the biodegradable tableware sector for combining sustainability with high-end design and aesthetics. Major players like Novamont produce Mater-Bi® compostable tableware, widely recognized for performance and environmental compatibility. Novamont continues to be a key player in the biodegradable bioplastics market with its Mater-Bi® family of products, focusing on sustainable solutions for organic waste management and agricultural soil pollution. Leaf Republic has pioneered 100% leaf-based plates that appeal to eco-conscious consumers seeking natural elegance. Regulatory developments are driving adoption: the EU Packaging and Packaging Waste Regulation (PPWR) includes provisions encouraging sustainable packaging, influencing the use of biodegradable tableware. The EU Parliament and Council reached a provisional agreement on the Packaging and Packaging Waste Regulation (PPWR) in March 2024, aiming to reduce packaging waste, promote recycling, and set targets for recycled content. While the specific mandate for biodegradable tableware for events by 2025 is subject to the final adopted text of the PPWR, the overall direction encourages such solutions. Additionally, iconic Italian brand Lavazza has transitioned to PLA-lined coffee cups, reflecting the country’s broader commitment to integrating bioplastics into consumer goods. Lavazza's partnership with Novamont on compostable coffee capsules made from Mater-Bi, launched in 2015, continues to be a notable example of their commitment to circular economy principles. Italy’s blend of technical innovation, design sophistication, and regulatory compliance secures its place as a premium segment leader in the global biodegradable tableware market.
Biodegradable Tableware Market Report Scope
Biodegradable Tableware Market
|
Parameter
|
Details
|
|
Market Size (2025)
|
$21.4 Billion
|
|
Market Size (2034)
|
$41.4 Billion
|
|
Market Growth Rate
|
7.6%
|
|
Segments
|
By Material Type (Bagasse (Sugarcane Fiber), Bamboo, Palm Leaf, Paper & Paperboard, Bioplastics, Wheat Bran, Wood), By Product Type (Plates & Trays, Bowls & Containers, Cups & Glasses, Cutlery, Straws & Stirrers, Others), By End-Use Industry (Foodservice Industry, Hotels & Hospitality, Institutional, Household Use, Retail & E-commerce), By Distribution Channel (Supermarkets & Hypermarkets, Specialty Stores, Small Retail Stores, Online Retail / E-commerce, Direct Sales)
|
|
Study Period
|
2019- 2024 and 2025-2034
|
|
Units
|
Revenue (USD)
|
|
Qualitative Analysis
|
Porter’s Five Forces, SWOT Profile, Market Share, Scenario Forecasts, Market Ecosystem, Company Ranking, Market Dynamics, Industry Benchmarking
|
|
Companies
|
Huhtamaki Oyj (Finland), Pactiv Evergreen (U.S.), Vegware (UK), Eco-Products, Inc. (U.S.), Biotrem (Poland), BioPak (Australia), Dart Container Corporation (U.S.), Novolex (U.S.), Ancheng (China), Pappco Greenware (India), Ecoware (India), Chuk (India), Verterra (U.S.), Earthware (UK), PAPSTAR GmbH (Germany), SOLIA (France), Better Earth LLC (U.S.), Good Start Packaging (U.S.), PacknWood (France / U.S.), GreenGood USA (U.S.), Bioleader® Environmental Protection Technology Co., Ltd. (China), YJS Environmental (China), Ecolates (China), Green Olive Group (China), Zhiben (China), Envigreen Biotech (India), WinCup (U.S.), and Others.
|
|
Countries
|
US, Canada, Mexico, Germany, France, Spain, Italy, UK, Russia, China, India, Japan, South Korea, Australia, South East Asia, Brazil, Argentina, Middle East, Africa
|
Biodegradable Tableware Market Segmentation
By Material Type
- Bagasse (Sugarcane Fiber)
- Bamboo
- Palm Leaf
- Paper & Paperboard
- Bioplastics
- Wheat Bran
- Wood
By Product Type
- Plates & Trays
- Bowls & Containers
- Cups & Glasses
- Cutlery
- Straws & Stirrers
- Others
By End-Use Industry
- Foodservice Industry
- Hotels & Hospitality
- Institutional
- Household Use
- Retail & E-commerce
By Distribution Channel
- Supermarkets & Hypermarkets
- Specialty Stores
- Small Retail Stores
- Online Retail / E-commerce
- Direct Sales
Countries Analyzed
- North America (US, Canada, Mexico)
- Europe (Germany, UK, France, Spain, Italy, Russia, Rest of Europe)
- Asia Pacific (China, India, Japan, South Korea, Australia, South East Asia, Rest of Asia)
- South America (Brazil, Argentina, Rest of South America)
- Middle East and Africa (Saudi Arabia, UAE, Rest of Middle East, South Africa, Egypt, Rest of Africa)
Top Companies in the Biodegradable Tableware Market
- Huhtamaki Oyj (Finland)
- Pactiv Evergreen (US)
- Vegware (UK)
- Eco-Products, Inc. (US)
- Biotrem (Poland)
- BioPak (Australia)
- Dart Container Corporation (US)
- Novolex (US)
- Ancheng (China)
- Pappco Greenware (India)
- Ecoware (India)
- Chuk (India)
- Verterra (US)
- Earthware (UK)
- PAPSTAR GmbH (Germany)
- SOLIA (France)
- Better Earth LLC (US)
- Good Start Packaging (US)
- PacknWood (France / U.S.)
- GreenGood USA (US)
- Bioleader® Environmental Protection Technology Co., Ltd. (China)
- YJS Environmental (China)
- Ecolates (China)
- Green Olive Group (China)
- Zhiben (China)
- Envigreen Biotech (India)
- WinCup (US)
*List not exhaustive
Methodology:
The research methodology for the Global Biodegradable Tableware Market leverages extensive primary research, including direct interviews with manufacturers, material scientists, industry associations, and distributors across key regions. Insights from these industry stakeholders are validated through in-depth secondary research drawn from reputable sources corporate filings, government regulatory updates (e.g., EU Single-Use Plastics Directive, India’s Plastic Waste Management Rules), patent databases, scientific publications, and trusted industry reports. Market sizing and forecasts for 2025–2034 are built using a comprehensive triangulation approach, ensuring accuracy and consistency across segments and geographies. This methodology provides robust intelligence into emerging technologies, supply chain dynamics, regional trends, and regulatory impacts shaping the global biodegradable tableware industry.
Research Coverage:
- Geographic Scope: Analysis spans over 25 countries, including major markets in North America, Europe, Asia Pacific, South America, and the Middle East & Africa.
- Segmentation: Deep-dive segmentation and analysis by:
- Material Type: Bagasse (Sugarcane Fiber), Bamboo, Palm Leaf, Paper & Paperboard, Bioplastics, Wheat Bran, Wood.
- Product Type: Plates & Trays, Bowls & Containers, Cups & Glasses, Cutlery, Straws & Stirrers, Others.
- End-Use Industry: Foodservice Industry, Hotels & Hospitality, Institutional, Household Use, Retail & E-commerce.
- Distribution Channel: Supermarkets & Hypermarkets, Specialty Stores, Small Retail Stores, Online Retail / E-commerce, Direct Sales.
- Competitive Landscape: Detailed profiles and strategic insights on more than 20 prominent manufacturers and innovators in the biodegradable tableware market.
- Key Themes: Technological advances in biodegradable materials, regulatory shifts driving adoption, emerging edible tableware concepts, competitive benchmarking, and innovations transforming the industry.
- Industry Dynamics: Comprehensive coverage of market drivers, restraints, growth opportunities, technological breakthroughs, and sustainability trends influencing the market trajectory.
- Historic data from 2021 to 2024 and forecasts from 2025 to 2034.
Deliverables:
- Full Market Research Report (PDF and Excel), featuring granular data tables, graphs, and interactive dashboards.
- Country-Level Forecasts and Insights.
- Segment-Wise Revenue Projections (2025–2034).
- Competitive Intelligence and SWOT Analysis.
- Recent Developments and Technology Tracker.
- Executive Summary with Analyst Commentary.
- Post-Purchase Analyst Support for Client-Specific Questions and Custom Data Requirements.
