Labels Market Overview: Growth Driven by Pressure-Sensitive Dominance and Sustainability Shift
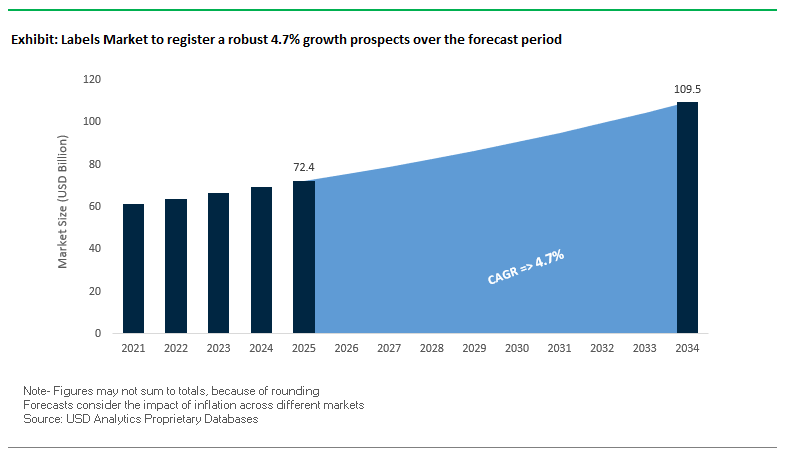
The Global Labels Market is projected to reach $72.4 billion in 2025 and is expected to expand to $109.5 billion by 2034, growing at a CAGR of 4.7%. Labels are more than identification tools they are now integral to branding, product safety, traceability, and regulatory compliance across food, beverage, pharmaceutical, personal care, and industrial markets. Pressure-sensitive labels dominate due to their ease of application and ability to adhere to multiple substrates, while digital printing and sustainable materials are reshaping the industry landscape.
With consumers demanding eco-friendly packaging and brands prioritizing circular economy practices, the demand for recycled-content, bioplastic-based, and linerless labels is surging. Meanwhile, flexographic printing remains critical for large-scale production, but digital printing’s rapid rise is enabling customization, variable data, and faster turnaround times. This convergence of sustainability, efficiency, and digital transformation is positioning the label industry for steady long-term growth.
Key Insights for Industry Professionals
- Pressure-sensitive labels lead the market, with widespread adoption in food, beverage, healthcare, and logistics.
- Flexographic printing remains dominant, offering cost-effective solutions for long-run, high-volume label production.
- Sustainability is driving innovation, with recycled content, linerless solutions, and bioplastics gaining share.
- Digital label printing grows rapidly, enabling personalized packaging campaigns and shorter lead times.
Market Analysis: Recent Developments in the Global Labels Industry
The labels market is undergoing strategic transformations and technological innovation, highlighted by major industry announcements and expansions. In August 2025, Mondi unveiled a new paper-based packaging solution under its Ad/Vantage Smooth Brown Semi Extensible line, demonstrating its commitment to sustainable label materials. That same month, CCL Industries announced record Q2 results, supported by nine acquisitions in 2025, underscoring its aggressive expansion strategy.
In July 2025, Labelexpo Europe confirmed its “Festival of Innovation” event in Barcelona, a landmark platform for showcasing new advancements in label printing technologies. During the same month, UPM Adhesive Materials (formerly UPM Raflatac) announced an investment in a state-of-the-art coating line in Johor Bahru, Malaysia, strengthening its growth trajectory in Southeast Asia. Investments are also reshaping the North American market R.R. Donnelley, in June 2025, injected $25 million into its Georgia facility, installing digital presses and robotic automation to double its workforce and production capacity.
Collaboration and diversification into new market segments are equally notable. In June 2025, Mondi partnered with Saga Nutrition to launch a new sustainable pet food packaging solution, highlighting the diversification of label applications into specialized niches. Meanwhile, UPM Adhesive Materials showcased its Carbon Action Label Portfolio at Labelexpo Mexico in March 2025, reinforcing its sustainability-first approach.
Labels Market: Key Trends and Emerging Opportunities
Mainstream Integration of Digital Watermarks for Intelligent Recycling
The labels market is undergoing a transformative shift with the mainstream adoption of digital watermarking technologies, moving beyond pilot phases into commercial-scale deployment. Initiatives like HolyGrail 2.0 are spearheading this evolution, embedding imperceptible digital codes directly into printed labels to enable high-accuracy sorting at recycling facilities. Industrial-scale trials conducted in Germany demonstrated the commercial viability of this technology, with a detection efficiency exceeding 90% and an average throughput of nearly 56,000 detections per day across a 100-day trial. This breakthrough allows for granular sorting capabilities, enabling the separation of food-grade packaging from non-food-grade packaging an essential factor for meeting EU regulatory requirements on recycled content in plastic packaging. The move toward digital watermarking directly supports the Packaging and Packaging Waste Regulation (PPWR), ensuring that future recycling streams yield high-quality recyclates suitable for reuse in food and beverage applications. With adoption programs already launched in Germany and Belgium, digital watermarks are fast becoming the backbone of intelligent recycling systems that underpin a circular economy for packaging.
Rapid Adoption of RFID Labels for Omnichannel Retail Fulfillment
RFID technology, particularly UHF RFID tags embedded within labels, is revolutionizing omnichannel retail operations. Initially used in apparel, RFID is now expanding across mass retail categories, driven by the pressing need for inventory precision and real-time visibility. Retail leaders such as Macy’s and lululemon have credited RFID with achieving inventory accuracy rates of up to 98%, a prerequisite for enabling services like buy-online-pick-up-in-store (BOPIS), same-day delivery, and ship-from-store. Global retail adoption is accelerating, with Walmart mandating RFID tagging for multiple product categories in 2022, marking a clear transition from pilot initiatives to standard industry practice. The technology not only improves stock accuracy but also reduces shrinkage, enhances supply chain efficiency, and supports data-driven decision-making. For retailers, the adoption of RFID-enabled labels has become a cornerstone strategy in omnichannel fulfillment, enabling seamless integration of digital and physical retail channels while meeting growing consumer expectations for convenience and availability.
Development of Fiber-Based Release Liners
A significant opportunity for innovation lies in replacing petrochemical-based silicone release liners with fiber-based alternatives that reduce environmental impact while improving recyclability. Traditional PET liners represent a substantial waste stream in pressure-sensitive labeling, often lacking viable end-of-life pathways. However, studies by industry bodies such as Assocarta confirm that silicone-coated paper release liners can be recycled within paper streams, offering a sustainable alternative. Leading players like Ahlstrom are introducing release liners incorporating at least 15% post-consumer recycled fibers, reducing carbon footprints while aligning with circular economy goals. These fiber-based solutions not only lower reliance on petroleum-derived materials but also help brands meet rising regulatory requirements and consumer expectations for eco-friendly packaging components. The development and adoption of renewable and recycled-content release liners are poised to reshape the label production landscape, providing a more sustainable foundation for pressure-sensitive applications.
Expansion of NFC-Enabled Labels for Consumer Engagement
NFC-enabled labels are moving from niche, high-end applications into broader adoption as brands seek to create deeper, interactive connections with consumers. While NFC technology has traditionally been used for authentication in luxury goods and pharmaceuticals, its role is now expanding to include consumer engagement and brand storytelling. By tapping a smartphone against an NFC-enabled label, consumers can access dynamic content such as personalized promotions, preparation instructions, sustainability credentials, and recycling guidelines. This digital extension of the physical product transforms the label into a branded content hub, driving loyalty and differentiation in crowded markets. Food and beverage brands are emerging as key adopters, leveraging NFC to highlight product origins and sustainability practices in real time. As production costs decrease and adoption scales, NFC-enabled labels are expected to become a mainstream tool for authentication, personalization, and transparency, offering brands a powerful mechanism to merge physical packaging with digital ecosystems.
Competitive Landscape: Global Leaders in the Labels Market
The global labels industry is highly competitive, with established multinationals investing heavily in sustainable materials, regional expansions, and digital transformation. The following companies are shaping the future of the sector:
Avery Dennison Corporation: Expanding Pressure-Sensitive and Intelligent Labels
Avery Dennison is a global leader in pressure-sensitive labels, merchandise tags, and RFID-enabled solutions. In August 2025, it expanded its portfolio by acquiring Meridian’s Flooring Adhesives Division, a move that enhances its product mix in high-value categories. Strategically, Avery Dennison emphasizes sustainability and digital solutions, publishing industry-leading white papers on circular packaging. Its new manufacturing facility in Greater Noida, India, reinforces its regional growth and ability to serve high-demand emerging markets.
CCL Industries Inc.: Growth Through Acquisitions and Healthcare Expansion
CCL Industries continues to lead the specialty labels market with strong momentum from acquisitions. In mid-2025, it acquired Faubel & Co., a specialist in clinical trial labels, strengthening its healthcare footprint. Posting record revenues in 2024, the company is expanding with new state-of-the-art facilities that support high-quality supply for global brand launches. CCL’s EcoStream® and EcoFloat® solutions highlight its commitment to sustainable labeling aligned with circular economy goals.
UPM Adhesive Materials: Driving Sustainability Beyond Fossil-Based Labels
Formerly UPM Raflatac, UPM Adhesive Materials is redefining the industry with its goal to become the “world’s first label materials company beyond fossils.” In March 2025, it launched the Carbon Action Plastic Labels Portfolio, reducing carbon footprints across packaging. Expansions in North America and Johor Bahru, Malaysia reflect its commitment to scale up production capacity globally. Its strategic focus remains on traceability and GHG reduction, with clear targets to cut emissions by 65% by 2030.
3M Company: Leveraging Material Science for Durable Label Solutions
3M remains a powerful player in industrial and durable labels, offering adhesives, films, and specialty tapes for industries like automotive, electronics, and healthcare. In August 2025, 3M India appointed Aseem Joshi as President and MD (Designate), reinforcing its leadership team to drive growth in emerging markets. With over 60,000 products and 3,000 patents annually, 3M leverages deep expertise in adhesives and material science, making it a reliable partner for high-performance label applications.
Constantia Flexibles Group GmbH: Advancing Sustainability with New Technologies
Constantia Flexibles is a global manufacturer of flexible packaging and labels, with a strong focus on food, beverage, pet food, and pharmaceuticals. In July 2025, it invested €6.5 million in Hosokawa Alpine MDO technology, advancing its packaging innovation capabilities. Its five Centers of Competence and Product Excellence Centers enable strong R&D and compliance expertise, particularly in food law and raw materials. With a growing reputation for sustainable innovation, Constantia continues to expand its role as a key provider of eco-friendly label solutions.
Labels Market Share Insights
Pressure-Sensitive Labels Dominate Market Share by Label Type
Pressure-sensitive labels hold the largest 58% share of the labels industry, reflecting their position as the most versatile and automation-friendly solution across global packaging lines. Their dominance is reinforced by their ability to adhere seamlessly to diverse substrates including glass, plastics, and metals while maintaining performance in both high-speed and precision applications. The segment’s strength lies in its continuous evolution premium aesthetics such as tactile finishes and metallic foils support brand differentiation, while the integration of RFID and NFC inlays transforms labels into smart packaging tools for real-time supply chain tracking and consumer engagement. Regulatory compliance, sustainability pressures, and the shift toward linerless innovations further consolidate pressure-sensitive labels as the industry’s anchor format.
Food & Beverages Lead Market Share by End-Use Industry in Labels
Food and beverages account for 38% of global label demand, making this segment the volume and compliance backbone of the labels industry. Beyond branding, labels in this segment serve critical roles in communicating nutritional facts, allergen warnings, ingredient transparency, and origin traceability. The segment’s scale is tied to the explosive growth in packaged and ready-to-eat foods, as well as the expansion of beverage categories into functional drinks and plant-based alternatives. Innovation is driven by the adoption of moisture-resistant substrates for chilled goods, high-gloss finishes for premium food branding, and QR-code–enabled smart labels that enhance consumer engagement while enabling anti-counterfeiting protections. The dominance of this segment ensures it sets the pace for material innovation and regulatory adaptation across the wider labels industry.
United States: Digital Printing and Sustainability Driving Advanced Label Solutions
The U.S. labels market is being transformed by rising sustainability awareness among consumers and corporations, creating strong demand for recyclable, compostable, and paper-based labels across food, beverage, and personal care sectors. Digital printing technology is a major enabler, offering speed, customization, and reduced waste, making it the fastest-growing solution for short runs, seasonal packaging, and limited-edition launches.
The market is further driven by eco-conscious initiatives, such as the How2Recycle Plus label, which incorporates QR codes to help consumers verify recyclability locally. Corporate sustainability goals are reshaping label procurement, with a focus on reduced material usage and separable labels for easier recycling. Regulatory mandates like the Drug Supply Chain Security Act (DSCSA) are driving adoption of specialized labels with barcodes and RFID tags, particularly in pharmaceutical and healthcare sectors, while high-end labels in beauty, fashion, and luxury goods are enhancing brand perception. Functional, tamper-evident labels are also increasingly in demand in the food and beverage industry.
Germany: Circular Economy and Technological Innovation Shape Eco-Friendly Labeling
Germany’s labels market is strongly influenced by the EU Packaging and Packaging Waste Regulation (PPWR 2025), which mandates eco-friendly and fully recyclable labels. The country’s leadership in the circular economy ensures that labels are designed with high recycled content, meeting national and EU sustainability targets while fostering innovation in mono-material films such as polyethylene (PE) and polypropylene (PP).
Technological advancements are encouraging product innovations that improve recyclability and overall circularity. Governmental mandates under PPWR, combined with rising consumer demand for sustainable packaging, have added momentum to the market. Industry consolidation is accelerating as larger conglomerates expand their market presence, intensifying competition and driving efficiency across supply chains. Germany’s labels market is now positioned as a global benchmark for sustainable, technologically advanced labeling solutions.
China: Carbon Neutral Goals and E-Commerce Expansion Boost Sustainable Label Demand
China’s labels industry is being shaped by the government’s dual carbon objectives, promoting eco-friendly, reduced, and reusable materials in packaging. Manufacturers are investing in automation, AI, and “5G plus industrial internet” technologies, enhancing production efficiency and flexible manufacturing capacity.
Sustainability-focused policies, such as restrictions on non-degradable plastics by 2025, are driving demand for paper-based and recyclable labels. The rapid expansion of e-commerce platforms is another critical driver, with FMCG companies leveraging intelligent labeling solutions, including QR codes and anti-counterfeiting features, to enhance traceability, product authentication, and supply chain efficiency. This combination of policy support, technological advancement, and e-commerce growth positions China as a key market for innovative and sustainable labels.
India: Smart Labels and Government Initiatives Accelerate Growth in the Labels Market
India’s labels market is benefiting from initiatives like Make in India and Zero Effect Zero Defect, which support high-quality domestic production and sustainable practices. The National Packaging Initiative (2021) promotes logistics efficiency and product safety, fostering adoption of eco-friendly labeling solutions. Regulatory measures, including the Plastic Waste Management (Amendment) Rules and Food Safety and Standards Packaging Regulations, have accelerated the shift toward sustainable and compliant labels.
Investments in advanced machinery and printing technology are enhancing market capabilities. Notable developments include Epson India’s ColorWorks CW-C8050 high-speed label printer and Avery Dennison’s RFID inlay and label manufacturing facility in Pune, reflecting India’s growing focus on smart labels for authentication, tracking, and industrial applications. The convergence of governmental support, technology adoption, and corporate initiatives ensures India’s labels market remains innovative, sustainable, and competitive globally.
Labels Market Report Scope
Labels Market
|
Parameter
|
Details
|
|
Market Size (2025)
|
$72.4 Billion
|
|
Market Size (2034)
|
$109.5 Billion
|
|
Market Growth Rate
|
4.7%
|
|
Segments
|
By Label Type (Pressure-Sensitive Labels, Wet-Glue Labels, Linerless Labels, In-Mold Labels, Shrink Sleeves, Stretch Sleeves, Other Labels), By Material Type (Paper-Based Labels, Plastic-Based Labels, Metal-Based Labels, Other Materials), By Printing Technology (Flexography, Digital Printing, Gravure, Offset, Electrophotography, Other Printing Technologies), By End-Use Industry (Food & Beverages, Home & Personal Care, Consumer Goods, Pharmaceuticals & Healthcare, Retail, Industrial & Automotive, Other Industries)
|
|
Study Period
|
2019- 2024 and 2025-2034
|
|
Units
|
Revenue (USD)
|
|
Qualitative Analysis
|
Porter’s Five Forces, SWOT Profile, Market Share, Scenario Forecasts, Market Ecosystem, Company Ranking, Market Dynamics, Industry Benchmarking
|
|
Companies
|
Avery Dennison Corporation, CCL Industries Inc., UPM Raflatac, Fuji Seal International, Inc., Lintec Corporation, HP Inc., Mondi Group, 3M Company, Nippon Paper Industries Co., Ltd., SATO Holdings Corporation, Toray Industries, Inc., Multi-Color Corporation (a part of CCL Industries), Cenveo Worldwide Limited, Smyth Companies, Fort Dearborn Company
|
|
Countries
|
US, Canada, Mexico, Germany, France, Spain, Italy, UK, Russia, China, India, Japan, South Korea, Australia, South East Asia, Brazil, Argentina, Middle East, Africa
|
Labels Market Segmentation
By Label Type
- Pressure-Sensitive Labels
- Wet-Glue Labels
- Linerless Labels
- In-Mold Labels
- Shrink Sleeves
- Stretch Sleeves
- Other Labels
By Material Type
- Paper-Based Labels
- Plastic-Based Labels
- Metal-Based Labels
- Other Materials
By Printing Technology
- Flexography
- Digital Printing
- Gravure
- Offset
- Electrophotography
- Other Printing Technologies
By End-Use Industry
- Food & Beverages
- Home & Personal Care
- Consumer Goods
- Pharmaceuticals & Healthcare
- Retail
- Industrial & Automotive
- Other Industries
Countries Analyzed
- North America (US, Canada, Mexico)
- Europe (Germany, UK, France, Spain, Italy, Russia, Rest of Europe)
- Asia Pacific (China, India, Japan, South Korea, Australia, South East Asia, Rest of Asia)
- South America (Brazil, Argentina, Rest of South America)
- Middle East and Africa (Saudi Arabia, UAE, Rest of Middle East, South Africa, Egypt, Rest of Africa)
Top Companies in Labels Market
- Avery Dennison Corporation
- CCL Industries Inc.
- UPM Raflatac
- Fuji Seal International, Inc.
- Lintec Corporation
- HP Inc.
- Mondi Group
- 3M Company
- Nippon Paper Industries Co., Ltd.
- SATO Holdings Corporation
- Toray Industries, Inc.
- Multi-Color Corporation (a part of CCL Industries)
- Cenveo Worldwide Limited
- Smyth Companies
- Fort Dearborn Company
* List Not Exhaustive
Methodology
USDAnalytics conducted an in-depth, multi-faceted research methodology to deliver actionable insights into the global Labels Market. Our approach combined extensive primary research including interviews with label manufacturers, brand owners across food, beverage, pharmaceutical, personal care, and industrial sectors, as well as sustainability and supply chain experts with rigorous secondary research from company filings, press releases, trade events such as Labelexpo Europe, and industry publications. Market sizing, growth forecasts, and CAGR calculations were derived from historical trends, technology adoption patterns in flexography, digital, and hybrid printing, and emerging innovations such as pressure-sensitive, linerless, bioplastic, and NFC/RFID-enabled smart labels. Segmentation analysis covered label type, material type, printing technology, and end-use industries, while qualitative insights highlighted mergers, acquisitions, capacity expansions, sustainability initiatives, and regulatory compliance trends. This comprehensive methodology ensured that USDAnalytics provides industry professionals with a detailed, forward-looking perspective on the evolving competitive landscape, technological shifts, and sustainability-driven opportunities shaping the global Labels Market.
Deliverables:
- Comprehensive Market Research Report (PDF and Excel) with detailed tables, charts, and interactive visualizations.
- Country-Specific Forecasts & Analysis.
- Segment-Wise Revenue Forecasts (2025–2034).
- Competitive Analysis, Benchmarking, and SWOT Profiles.
- Recent Developments & Innovation Tracker.
- Executive Summary & Analyst Commentary.
- Post-Purchase Analyst Support for Client-Specific Questions and Custom Data Requirements.
