Point-of-Use Water Treatment Systems Market Valuation and Growth Outlook
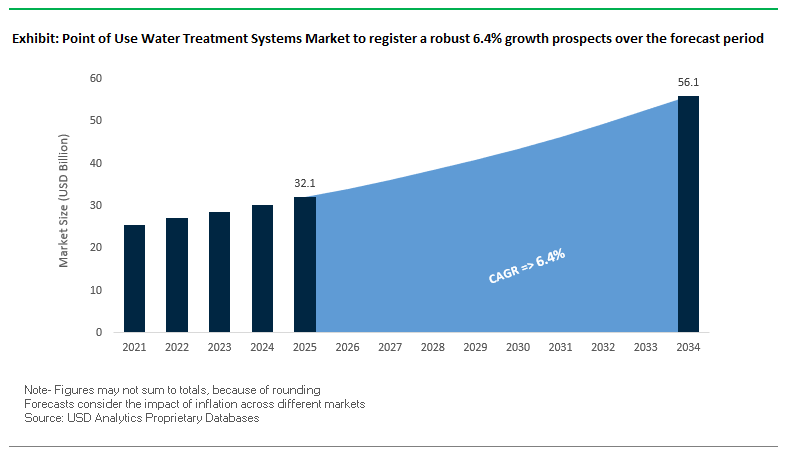
Point-of-Use (POU) Water Treatment Systems global market is anticipated to reach USD 32.1 billion in 2025 and will be growing to reach USD 56.1 billion by 2034 at a growth rate of 6.4% throughout the forecast period. Strong growth is driven by increased awareness about the danger of water contamination among consumers, fast urbanization, old age in municipal infrastructures, and continued innovation in water filtration technology. Special attention among professionals is paid to how advanced reverse osmosis (RO) and activated carbon technology paired with ultraviolet (UV) disinfection and IoT features create new standards in water purification effectiveness and convenience to users.
Market growth is further boosted by increased use of smart POU systems that can be used to monitor water quality in real-time and issue predictive maintenance warnings. Decentralized POU solutions become economical, immediate upgrades to drinking water quality in places experiencing deteriorating water infrastructure or rapid urbanization and thus become a component part of residential and small commercial water planning.
Key Insights for Industry Leaders:
- Heightened Public Health Awareness: Growing concerns over PFAS, lead, bacteria, and micropollutants are reshaping consumer buying patterns.
- Technological Integration: Combining RO, activated carbon, UV, and advanced media to tackle a broader contaminant spectrum.
- IoT-Driven Innovation: Smart systems deliver enhanced monitoring, predictive maintenance, and improved user engagement.
- Urban Infrastructure Challenges: Decentralized solutions are critical for regions with aging pipelines and limited centralized treatment.
Comprehensive Market Analysis and Recent Developments in Point-of-Use Water Treatment Systems
The POU water treatment systems industry is evolving rapidly, with technological innovations and strategic corporate moves driving market momentum. Technological developments like LG Chem's recent introduction in May 2025 of the LG NF9 nanofiltration membrane will eventually filter down to residential applications and improve contaminant-removal effectiveness. Pentair's award-winning PFAS Reduction Systems product, certified in April 2025, is another illustration of how companies zero in on fighting "forever chemicals" becoming a matter of public health.
Corporate performance trends also signal market growth. A. O. Smith reported strong Q2 2025 results in July 2025, India operations exhibiting 19% organic growth indicative of increased purification system adoption in high growth markets. Pentair's Water Solutions segment realized a 9% year-on-year income growth in Q1 2025 thanks to strong residential POU unit sales. Strategic portfolio studies, such as Honeywell's July 2025 move, indicate a stricter focus on core automation and water-based business units freeing up resources to innovate and penetrate markets.
Sustainability pledges are becoming a defining feature. 3M's May 2024 promise to spend $1 billion across 20 years on water conservation and high-quality return of water reaffirms alignment between product innovation and environmental stewardship. Marketing campaigns, such as H2O Innovation's August 2025 "Be Water Positive" promotion, are connecting consumer awareness and brand positioning, especially within those markets where sustainability and water scarcity are critical issues.
Trends and Opportunities in Point of Use Water Treatment Systems Market
Trend 1: Military-Grade Filtration for PFAS & Emerging Contaminants
Point of Use (POU) water treatment systems market is experiencing rapid growth due to skyrocketing awareness among consumers and regulatory response concerning "forever chemicals" (PFAS) and other new-age contaminants like pharmaceuticals and endocrine-disrupting chemicals. The United States Environment Protection Agency (EPA) has finalized enforceable nationwide drinking water standards for six PFAS chemicals, including PFOA and PFOS, setting near-zero limits and requiring monitoring and remediation within a few years. Regulatory activity is compelling consumers to demand personal-level water purification technology to address health concerns involving persistent chemical exposure. Filtration technology innovation involving granular activated carbon, ion-exchange resins, and multi-stage hybrid technology integrating reverse osmosis (RO) and special carbon or ion-exchange filters has shown impressive ability to remove PFAS at both large-scale remediation programs and household levels. Pilot programs at military bases like Wright-Patterson Air Force Base have substantiated these technologies, realizing impressive contaminant level reduction and demonstrating feasibility for mass market appeal. A shift in the market toward multi-barrier, PFAS-specific POU systems reflects a mounting need for residential and commercial markets to achieve high-performing, health-driven water solutions that create a solid growth trajectory for the market as regulatory enforcement intensifies and awareness about public health escalates.
Trend 2: Smart Connected Filtration Systems
Blurring the lines between IoT and AI within POU water treatment technology is redefining the market by facilitating real-time monitoring, predictive maintenance, and user-friendly convenience. IoT-capable units enable consumers to monitor key water quality parameters like Total Dissolved Solids (TDS), pH level, turbidity, and contaminant levels directly via smartphone app, providing transparency and peace of mind. High-end smart filtration units can provide automatic notifications upon filter replacement need, optimize against drinking water consumption patterns, and prolong filter life via AI-based predictive analysis. Technological innovation meets consumer need for technology-driven simplicity, operational effectiveness, and performance, creating a competitive advantage in a fast-growing market. Tech-savvy urban consumers in developed and emerging markets respond to convenient convergence of control, water quality assurance, and connectivity in smart POU devices. Smart connected filtration system demand will be boosted in markets where IoT uptake is widespread, and consumers will pay a premium to receive real-time data, predictive maintenance, and better water safety.
Opportunity 1: Emerging Market Premiumization
Asia and Latin American middle-class expansion creates a large market opportunity for premium POU water treatment systems. Economic growth, social mobility, and urbanization are changing consumption patterns among traditionally underserved consumers in Asia and Latin America from conventional water treatment techniques like boiling to modern, convenient, and attractive filtration products. Based on World Bank statistics, Latin America has witnessed more than 50 million people entering the middle class in recent years and boosting discretionary purchases in health and wellness products such as household water treatment technology. Urbanization in Asia has put pressure on municipal water supply systems, making water quality inconsistent and thus creating a large demand for in-home purification products that will assure both safety and convenience. POU systems offering consistent pathogen elimination, contaminant control, and user-friendly designs are gaining acceptance among consumers as a new class of required household appliances and creating a huge opportunity for companies to grab a growing slice of health-oriented and high-end consumers.
Opportunity 2: Disaster and Emergency Response Systems
Climate change-inspired natural disasters like hurricanes, flood relief efforts, and water contamination outbreaks are creating demand for portable, modular, and rapid-deployment POU water treatment systems. Emergency response, humanitarian relief efforts, and resilient water supply in resource-scarce locations rely upon these systems. Portable POU units can integrate myriad filtration technologies such as carbon filtration, UV disinfection technology, and membrane systems and can be powered on alternative energy supplies such as solar pumps or hand pumps. NGOS and governmental agencies continue integrating these systems into disaster relief efforts, where ease of use, effectiveness, and quick installation in difficult situations drive relevance. Emergency POU device case studies indicate that these devices will need to treat multifaceted contaminant profiles such as heavy metal contaminants, pathogens, and chemical contaminants to provide protected water access in disaster situations. Disaster-response POU solution demand is growing due to climate risk escalation and presents a chance for companies to innovate long-lasting high-performing portable filtration systems both in human relief efforts and commercial applications.
Point-of-Use Water Treatment Systems Market Share Insights
Market Share by System Type: Reverse Osmosis Leads While Carbon Filtration Dominates Volume
Reverse osmosis (RO) POU systems are expected to hold around 35% of the global market share in 2025, making them the revenue leader due to their higher price point and unmatched contaminant removal efficiency. RO units are increasingly adopted in households and commercial settings where comprehensive purification from dissolved solids to heavy metals remains critical. In parallel, filtration systems, primarily carbon and sediment-based, capture nearly 30%, representing the highest unit volumes. Their affordability and accessibility drive mass-market penetration, particularly through pitchers and faucet-mounted filters that address chlorine, sediment, and taste concerns.
 Water Treatment Systems Market By Type (2025).png)
Market Share by Installation Type: Under-Sink Systems Dominate Revenue While Pitchers Drive Volume
In terms of installation, under-sink water purification systems account for about 30% of market revenues, cementing their status as the premium residential choice. These high-capacity units based on RO offer convenience, permanence, and aesthetic appeal, making them popular among homeowners seeking reliable long-term solutions. On the other hand, pitcher and carafe filters represent 25% of the market, driven by low upfront costs, retail availability, and ease of use. Although the revenue per unit is limited, The segment contributes the highest sales volume, especially in North America and Europe where consumer awareness of water quality is high.
Market Share by Technology: Carbon Filtration Ubiquity vs. RO Membrane Dominance
Carbon filtration technology remains the backbone of the global POU water treatment systems market, with a projected 45% share in 2025. Its widespread integration from entry-level pitchers to advanced under-sink RO units underscores its role in enhancing taste, odor, and chlorine removal. Simultaneously, RO membrane technology holds about 35% of the market, representing the gold standard for comprehensive purification. RO’s importance is particularly strong in regions facing salinity and dissolved solids challenges, where consumers prioritize removal of nitrates, fluoride, and heavy metals alongside microbiological safety.
Market Share by End-User: Residential Sector Dominates Global POU Adoption
The residential sector is expected to account for nearly 80% of the market share in 2025, driven by consumer health concerns, distrust of municipal tap water, and demand for convenience-focused systems such as pitchers, faucet-mounted units, and under-sink RO filters. The dominance also reflects rising interest in premium and smart-enabled water purifiers tailored for household use. In contrast, the commercial sector, representing 15%, is expanding steadily, with offices, hotels, and schools adopting high-capacity countertop and under-sink units to ensure safe, good-tasting drinking water. The industrial sector remains niche at 5%, limited to low-volume process applications and employee hydration stations.
Market Share by Sales Channel: E-Commerce Emerges as the Fastest-Growing Distribution Hub
E-commerce platforms are projected to contribute around 40% of global POU system sales by 2025, making them the dominant and fastest-growing distribution channel. Online platforms enable consumers to research product specifications, compare prices, and directly access emerging DTC (direct-to-consumer) brands offering subscription filter replacements. Specialty stores and distributors hold about 25%, playing a pivotal role in complex, high-performance systems like RO and UV purifiers where professional installation and after-sales service are critical. Meanwhile, supermarkets and hypermarkets drive 20%, especially for pitcher filters and replacement cartridges, benefiting from visibility and impulse-driven purchases.
Country Analysis of the Point of Use (POU) Water Treatment Systems Market
United States: Rising Demand for Advanced POU Water Purifiers
United States POU water treatment systems market is growing robustly due to federal programs and growing awareness about water quality among consumers. The Bipartisan Infrastructure Law has invested more than $50 billion to improve drinking water and sewerage facilities, directly boosting demand for complementary POU systems in residential applications and commercial centers. Contamination fears regarding "forever chemicals" (PFAS) have further boosted demand for sophisticated filtration solutions capable of selective removal. Pentair was awarded the 2025 Kitchen Innovations Award for its Everpure PFOA/PFOS Reduction Systems, reflecting PFAS removal innovation leaders. Furthermore, 3M's $12.5 billion settlement to cleanup PFAS across public water supply systems is boosting investment in residential-level water treatment technology. Top companies like A.O. Smith have grown their domestic presence through purchases of Atlantic Filter in Florida (2022) and Master Water Conditioning Corporation in Pennsylvania (2021) and reviewing Chinese opportunities to streamline global operations. Pentair's 2025 Innovation Award further reveals innovation in smart, sustainable water solutions improving user experience and monitoring of water quality.
China: Urbanization and Smart Technologies Boost POU Water Purifiers
China's POU water treatment system market is expanding continuously due to urbanization, improving disposable incomes, and rising awareness about healthcare. Urbanized consumers are purchasing high-end residential water purifiers to guarantee safer drinking water, primarily in locations hit by heavy metals and other pollutants. Technological development, such as integrating smarter technology and IoT-capable water purifiers, is improving convenience and real-time tracking for consumers. Progressing affordability has made POU water filters available to a wider range of people, while key players like A.O. Smith remain considering strategies to respond to changing consumer demand. Expanding use of residential POU water treatment technology is driven by increased awareness about water quality and a need for sustainable, efficient purification technology.
India: Government Initiatives and Technological Integration Drive Market Growth
Indian POU water treatment systems market is growing due to the impact of national programs like the Jal Jeevan Mission to provide a functional household tap connection to all rural households by 2028. Potable water quality assurance through preliminary and POU treatment systems is core to the program. A.O. Smith has realized 19% Q2 2025 local currency sales growth due in part to the Pureit brand acquisition, reflective of increasing demand for sophisticated residential water purifiers. Innovative technology solutions such as automated filtration units, solar-driven water supplies, and dual-water systems separating potable and non-potable water drive new POU application opportunities. Government financial incentives supporting infrastructure and technology uptake provide continued growth opportunity for household water treatment solutions in India.
Japan: Technological Advancement and Disaster-Preparedness Focus
Japan’s POU water treatment systems market is driven by a culture of preventive healthcare, hygiene awareness, and space-efficient, energy-conscious designs. Residential water purifiers are increasingly integrating smart technologies, including sensors for real-time water quality monitoring and cartridge replacement alerts. WOTA Corp., a Japanese startup, developed a portable water recycling system capable of reclaiming over 98% of wastewater, deployed in the 2024 Noto Peninsula Earthquake-affected areas. The innovation reflects Japan’s focus on disaster countermeasures, decentralized water solutions, and self-sufficiency, making POU water treatment systems a crucial part of urban and rural water management strategies.
Germany: Sustainability and Climate-Responsive POU Solutions
Germany’s POU water treatment systems market emphasizes sustainability, water conservation, and climate-adaptive technologies. Despite well-developed water infrastructure, modernization efforts and rising concerns over climate change are promoting the adoption of advanced POU solutions. The German Association for Gas and Water (DVGW) launched the Innovation Programme Water to bridge knowledge gaps between climate change and water supply, influencing the development of residential water treatment technologies. Government strategies, including the National Water Strategy, encourage resilient water management systems capable of maintaining high-quality water standards. Companies are developing solutions that reduce pollutants and enhance technological efficiency, reflecting Germany’s commitment to eco-friendly, advanced POU water treatment solutions.
United Kingdom: Regulatory Standards and Eco-Friendly Innovation
The United Kingdom’s POU water treatment systems market is shaped by regulatory oversight and sustainability initiatives. The Drinking Water Inspectorate (DWI) enforces stringent regulations to ensure water quality, encouraging the adoption of POU systems across residential and commercial sectors. Market innovations focus on sustainable and eco-friendly water treatment solutions, emphasizing energy efficiency, minimal maintenance, and safe removal of contaminants. These factors collectively drive the demand for advanced POU systems that support high hygiene standards and promote safe, reliable drinking water.
Competitive Landscape in the Global Point-of-Use Water Treatment Systems Market
The global POU water treatment systems market is highly competitive, characterized by multinational corporations leveraging technological innovation, geographic expansion, and strategic acquisitions to strengthen their market position. Industry leaders are focusing on both product performance and sustainability, reflecting the dual priorities of water quality and environmental responsibility.
A. O. Smith Corporation: Strength in Premium and High-Growth Markets
A. O. Smith has made a solid presence in North America and India with its high-efficiency, premium water treatment products. With its recent 2024 India takeover of Pureit and United States-based Impact Water Products, the global company has both grown geographically and technically. Its Q2 2025 showing, fueled by a 19% India growth level, shows it has a capacity to take advantage of new demand in markets. The range consists of under-sink RO systems, countertop purifiers, and softeners that serve residential and light commercial markets.
Pentair plc: Innovation in Addressing Emerging Contaminants
Pentair's broad-based portfolio encompasses whole-house and point-of-use water solutions that emphasize sustainability and contaminant-targeted innovation. Its April 2025 Kitchen Innovations Award for its Everpure PFAS Reduction Systems demonstrates its forefront role in combating harmful "forever chemicals." Its December 2024 acquisition of Porous Media boosted filtration and separation capacity while improving product performance and extending application ranges.
3M Company: Science-Driven Sustainability
3M brings materials science expertise to bear to offer advanced POU filtration technology designed to eliminate lead, chlorine, and sediment. Its new $1 billion environmental investment announced in May 2024 cements its dedication to helping achieve global water sustainability targets. Its Professional Series under-the-sink filtration systems remain a benchmark against which others judge reliability and specified contaminant effectiveness.
LG Electronics: User-Centric Smart Water Solutions
LG embeds state-of-the-art water purification technology within its overall home appliance portfolio. Its POU products that incorporate RO, UV, and multi-stage filtration lead the market because of their sleek designs, instant hot/cold dispensing, and filter life notification. Its technology prowess in water primarily emanates from LG Water Solutions division such that industrial-grade membrane technology finds its way into household applications.
H2O Innovation: Expertise in Membrane Technologies
Although mostly catering to municipal and industrial customers, H2O Innovation leverages its membrane technology know-how to elements employed within residential POU systems. H2O Innovation's August 2025 "Be Water Positive" promotion demonstrates how it has contributed to awareness regarding sustainable use of water. Its special products branch provides high-performing membranes and resins, facilitating innovation within the broader POU marketplace.
Point of Use Water Treatment Systems Market Report Scope
Point of Use Water Treatment Systems Market
|
Parameter
|
Details
|
|
Market Size (2025)
|
$32.1 Billion
|
|
Market Size (2034)
|
$56.1 Billion
|
|
Market Growth Rate
|
6.4%
|
|
Segments
|
Type (Filtration Systems, Reverse Osmosis Systems, Distillation Systems, UV Purification Systems, Others), By Installation Type (Countertop models, Under-sink systems, Faucet-mounted units, Pitcher/carafe filters, Refrigerator filters), By Technology (RO Systems, UV Systems, Carbon Filtration, Others), By End-User (Residential Sector, Commercial Sector, Industrial Sector), By Sales Channel (E-commerce platforms, Specialty stores, Supermarkets/hypermarkets, Direct sales, Distributor networks)
|
|
Study Period
|
2019- 2024 and 2025-2034
|
|
Units
|
Revenue (USD)
|
|
Qualitative Analysis
|
Porter’s Five Forces, SWOT Profile, Market Share, Scenario Forecasts, Market Ecosystem, Company Ranking, Market Dynamics, Industry Benchmarking
|
|
Companies
|
Pentair, A.O. Smith, LG Electronics, Eureka Forbes, Panasonic Holdings Corporation, Whirlpool Corporation, Kent RO Systems Ltd., Coway Co., Ltd., Culligan Water, 3M, Unilever, BWT Holding GmbH, Kinetico Incorporated, Amway, EcoWater Systems
|
|
Countries
|
US, Canada, Mexico, Germany, France, Spain, Italy, UK, Russia, China, India, Japan, South Korea, Australia, South East Asia, Brazil, Argentina, Middle East, Africa
|
Point of Use Water Treatment Systems Market Segmentation
By Type
- Filtration Systems
- Activated carbon filters
- Ceramic filters
- Sediment filters
- Hollow fiber membrane filters
- Reverse Osmosis Systems
- Standard RO systems
- Tankless RO systems
- Compact RO units
- Distillation Systems
- Countertop distillers
- Automatic distillers
- UV Purification Systems
- UV lamp systems
- LED UV systems
- Others
By Installation Type
- Countertop models
- Under-sink systems
- Faucet-mounted units
- Pitcher/carafe filters
- Refrigerator filters
By Technology
- RO Systems
- UV Systems
- Carbon Filtration
- Others
By End-User
- Residential Sector
- Commercial Sector
- Offices
- Restaurants
- Schools
- Hotels
- Industrial Sector
- Small manufacturing units
- Laboratories
- Food service providers
- Others
By Sales Channel
- E-commerce platforms
- Specialty stores
- Supermarkets/hypermarkets
- Direct sales
- Distributor networks
Countries Analyzed
- North America (US, Canada, Mexico)
- Europe (Germany, UK, France, Spain, Italy, Russia, Rest of Europe)
- Asia Pacific (China, India, Japan, South Korea, Australia, South East Asia, Rest of Asia)
- South America (Brazil, Argentina, Rest of South America)
- Middle East and Africa (Saudi Arabia, UAE, Rest of Middle East, South Africa, Egypt, Rest of Africa)
Top Companies in Point of Use Water Treatment Systems Market
- Pentair
- A.O. Smith
- LG Electronics
- Eureka Forbes
- Panasonic Holdings Corporation
- Whirlpool Corporation
- Kent RO Systems Ltd.
- Coway Co., Ltd.
- Culligan Water
- 3M
- Unilever
- BWT Holding GmbH
- Kinetico Incorporated
- Amway
- EcoWater Systems
* List Not Exhaustive
Research Coverage
This report investigates the Global Point-of-Use (POU) Water Treatment Systems Market, offering comprehensive analysis reviews of valuation trends, breakthrough technologies, and strategic developments shaping the sector. Published by USDAnalytics, the study highlights how rising public health awareness, rapid urbanization, and innovation in reverse osmosis (RO), activated carbon, UV disinfection, and IoT-enabled filtration are redefining consumer adoption patterns. It emphasizes how companies are responding to challenges such as PFAS contamination, aging water infrastructure, and sustainability demands through advanced product portfolios, M&A activities, and smart filtration systems. With detailed coverage of global adoption drivers, competitive strategies, and growth opportunities, this report is an essential resource for water technology professionals, corporate strategists, policymakers, and investors seeking actionable insights into the evolving landscape of residential and commercial water purification markets.
Scope Includes:
- Segmentation: By System Type (RO, Carbon Filtration, UV, Multi-Stage, Others), Installation (Under-Sink, Countertop, Pitcher, Faucet-Mounted, Others), Technology (RO Membrane, Carbon Filtration, Hybrid Systems, UV, Others), End-User (Residential, Commercial, Industrial), and Sales Channel (E-Commerce, Specialty Stores, Supermarkets/Hypermarkets, Direct Sales).
- Geographic Scope: Analysis spans 25+ countries across North America, Europe, Asia Pacific, Latin America, and the Middle East & Africa.
- Timeframe: Historic data from 2021–2024 and forecast data from 2025–2034.
- Companies: Competitive profiling and analysis of 15+ companies active in the global POU water treatment systems market.
Methodology
The research methodology applied by USDAnalytics integrates both primary and secondary approaches to deliver accurate and reliable insights into the Point-of-Use Water Treatment Systems Market. Primary research included structured interviews with manufacturers, distributors, water utilities, regulators, and industry experts to capture real-time market adoption trends, consumer preferences, and regulatory impacts. Secondary research utilized government publications, corporate filings, recognized industry journals, and technology reviews to strengthen the evidence base. Market sizing and forecasts were derived using a mix of top-down and bottom-up approaches, validated through data triangulation, sensitivity analysis, and scenario modeling. Expert validation ensured consistency and accuracy, making this study a trusted reference for strategic decision-making, policy formulation, and investment planning.
Deliverables:
- Comprehensive Market Research Report (PDF and Excel) with detailed tables, charts, and interactive visualizations.
- Country-Specific Forecasts & Analysis.
- Segment-Wise Revenue Forecasts (2025–2034).
- Competitive Analysis, Benchmarking, and SWOT Profiles.
- Recent Developments & Innovation Tracker.
- Executive Summary & Analyst Commentary.
- Post-Purchase Analyst Support for Client-Specific Questions and Custom Data Requirements.
Table of Contents: Point-of-Use (POU) Water Treatment Systems Market
1. Executive Summary
1.1. Market Highlights
1.2. Key Insights for Industry Leaders
1.3. Global Market Snapshot
2. Point-of-Use (POU) Water Treatment Systems Market Valuation & Growth Outlook (2025–2034)
2.1. Introduction to the POU Market
2.2. Market Valuation and Growth Projections (2025–2034)
2.2.1. Current Market Size (2025): $32.1 Billion
2.2.2. Forecasted Market Size (2034): $56.1 Billion at 6.4% CAGR
2.3. Market Drivers and Key Trends
2.3.1. Heightened Public Health Awareness
2.3.2. Technological Integration and IoT-Driven Innovation
2.3.3. Urban Infrastructure Challenges
3. Comprehensive Market Analysis and Recent Developments
3.1. Overview of Market Evolution
3.2. Recent Product Innovations
3.2.1. LG Chem's Nanofiltration Membrane
3.2.2. Pentair's PFAS Reduction Systems
3.3. Corporate Performance and Strategic Moves
3.3.1. A. O. Smith's Q2 2025 India Growth
3.3.2. Pentair's Q1 2025 Water Solutions Segment Growth
3.3.3. Honeywell's Strategic Portfolio Review
3.4. Sustainability and Brand Positioning
3.4.1. 3M's Water Conservation Pledge
3.4.2. H2O Innovation's "Be Water Positive" Campaign
4. Trends and Opportunities in Point-of-Use Water Treatment Systems Market
4.1. Trend 1: Military-Grade Filtration for PFAS & Emerging Contaminants
4.1.1. Regulatory Landscape (EPA Standards)
4.1.2. Technology Innovation (GAC, Ion-Exchange)
4.1.3. Market Shift and Growth Trajectory
4.2. Trend 2: Smart Connected Filtration Systems
4.2.1. IoT, AI, and Real-Time Monitoring
4.2.2. Consumer Adoption and Competitive Advantage
4.3. Opportunity 1: Emerging Market Premiumization
4.3.1. Growth of the Middle Class in Asia and Latin America
4.3.2. Urbanization and In-Home Purification Demand
4.4. Opportunity 2: Disaster and Emergency Response Systems
4.4.1. Climate Change and Demand for Portable Systems
4.4.2. Role in Humanitarian and Commercial Applications
5. Point-of-Use Water Treatment Systems Market Share Insights
5.1. By System Type
5.1.1. Reverse Osmosis (RO) Systems
5.1.2. Filtration Systems (Carbon, Sediment)
5.2. By Installation Type
5.2.1. Under-Sink Systems
5.2.2. Pitcher and Carafe Filters
5.2.3. Countertop, Faucet-Mounted, and Refrigerator Filters
5.3. By Technology
5.3.1. Carbon Filtration
5.3.2. RO Membrane Technology
5.3.3. UV Systems and Others
5.4. By End-User
5.4.1. Residential Sector
5.4.2. Commercial Sector
5.4.3. Industrial Sector
5.5. By Sales Channel
5.5.1. E-commerce Platforms
5.5.2. Specialty Stores and Distributors
5.5.3. Supermarkets/Hypermarkets and Direct Sales
6. Country Analysis of the Point of Use (POU) Water Treatment Systems Market
6.1. United States: Advanced POU Water Purifiers
6.2. China: Urbanization and Smart Technologies
6.3. India: Government Initiatives and Technological Integration
6.4. Japan: Technological Advancement and Disaster-Preparedness
6.5. Germany: Sustainability and Climate-Responsive Solutions
6.6. United Kingdom: Regulatory Standards and Eco-Friendly Innovation
6.7. Other Country Analysis (e.g., Brazil, Saudi Arabia, Australia)
7. Point of Use Water Treatment Systems Market Size Outlook by Region (2025–2034)
7.1. North America Market Size Outlook to 2034
7.1.1. By System Type, Installation Type, Technology, End-User, Sales Channel
7.2. Europe Market Size Outlook to 2034
7.2.1. By System Type, Installation Type, Technology, End-User, Sales Channel
7.3. Asia Pacific Market Size Outlook to 2034
7.3.1. By System Type, Installation Type, Technology, End-User, Sales Channel
7.4. South America Market Size Outlook to 2034
7.4.1. By System Type, Installation Type, Technology, End-User, Sales Channel
7.5. Middle East and Africa Market Size Outlook to 2034
7.5.1. By System Type, Installation Type, Technology, End-User, Sales Channel
8. Company Profiles: Top Companies in POU Water Treatment Systems Market
8.1. Pentair
8.2. A.O. Smith
8.3. LG Electronics
8.4. Eureka Forbes
8.5. Panasonic Holdings Corporation
8.6. Whirlpool Corporation
8.7. Kent RO Systems Ltd.
8.8. Coway Co., Ltd.
8.9. Culligan Water
8.10. 3M
8.11. Unilever
8.12. BWT Holding GmbH
8.13. Kinetico Incorporated
8.14. Amway
8.15. EcoWater Systems
9. Research Coverage & Methodology
9.1. Report Scope and Focus
9.2. Research Methodology
9.3. Deliverables
10. Appendix
10.1. List of Tables
10.2. List of Figures
10.3. Abbreviations
