Market Overview: Rising Demand for Premium and Sustainable Chocolate Packaging
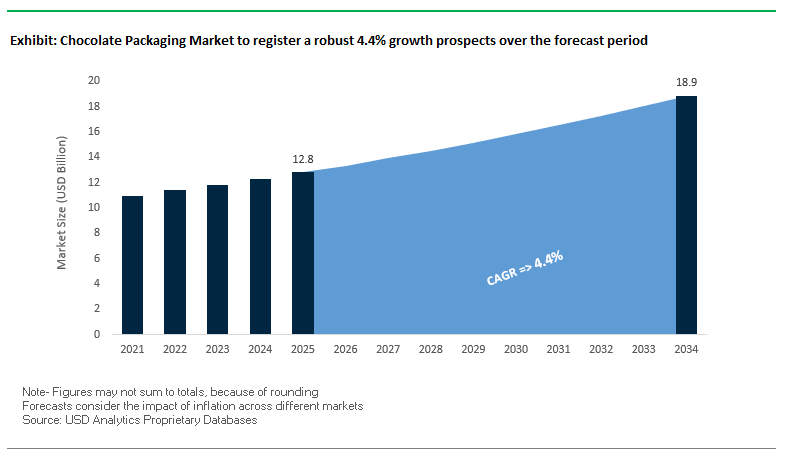
The Chocolate Packaging Market is valued at $12.8 billion in 2025 and is projected to reach $18.9 billion by 2034, growing at a CAGR of 4.4%. This growth is driven by the convergence of sustainability, consumer premiumization, and protective packaging technologies. Paper and paperboard lead the market, widely used in rigid boxes, folding cartons, and wrappers across both mass-market and premium chocolates. Their versatility makes them the preferred choice for packaging bulk chocolates, artisanal products, and luxury gift assortments.
Plastic packaging, especially flexible flow wraps and pouches, remains indispensable due to its strong barrier properties that protect chocolate from moisture, oxygen, and light, thus extending shelf life and ensuring product freshness. At the same time, sustainability has become a key driver, with over 40% of chocolate manufacturers in 2025 testing or launching eco-friendly packaging solutions, including compostable films, mono-materials, and recycled-content packs.
Premium and artisanal chocolates are also shaping demand. Around 30% of global chocolate consumption is now linked to the premium segment, where sophisticated, visually appealing, and interactive packaging is critical to delivering a memorable unboxing experience. Combined with the rise of e-commerce and gifting occasions, chocolate packaging is no longer a functional element but a vital branding tool.
Key Insights for Industry Professionals
- Paperboard dominance: Widely used in rigid boxes, cartons, and wrappers for premium and bulk chocolates.
- Plastic’s essential role: Flow wraps and pouches ensure shelf life and freshness with high-barrier properties.
- Sustainability transition: Over 40% of manufacturers have adopted or are piloting eco-friendly chocolate packaging.
- Premiumization impact: About 30% of chocolate demand now requires luxury-style packaging with a strong design focus.
Market Analysis: Recent Developments Transforming Chocolate Packaging
The global chocolate packaging industry has seen significant activity in recent years, marked by sustainability commitments, brand redesigns, and legal challenges around packaging practices.
In September 2025, Mondelēz International faced a lawsuit in Germany over “shrinkflation” in its Milka chocolate bars, where the product size was reduced but packaging remained unchanged, raising concerns over consumer transparency. In July 2025, Cadbury Bournville introduced a refreshed packaging design across its dark chocolate portfolio, aiming to make dark chocolate more approachable, while in May 2025, Cadbury innovated with cold-activated thermochromic wrappers that reveal hidden designs when refrigerated, enhancing the consumer experience.
Innovation also came from packaging manufacturers. In April 2025, UPM Raflatac launched its Carbon Action Plastic Films portfolio, providing low-carbon, recyclable solutions for the confectionery sector. In March 2025, India’s Morde unveiled a new brand identity and chocolate packaging at the Aahar trade fair, signaling its ambition to expand globally. Consolidation also shaped the sector: in January 2024, Mars acquired Hotel Chocolat, strengthening its premium chocolate presence, while in November 2023, Mars advanced sustainability by using advanced recycling materials in KIND snack bar packaging.
Earlier, in July 2023, Amcor launched its AmFiber™ Performance Paper in Latin America a recyclable, high-barrier solution designed for confectionery packaging. These developments reflect an industry balancing premium branding, sustainability, and compliance with consumer expectations while innovating to differentiate products in competitive markets.
Key Trends and Opportunities Shaping the Chocolate Packaging Market
Rapid Transition Toward Sustainable and Digitally-Enabled Chocolate Packaging
The chocolate packaging market is experiencing a profound transformation as brands adopt mono-material solutions, recycled content, and digital printing to enhance sustainability and personalization. These shifts are reinforced by corporate sustainability pledges, regulatory deadlines, and consumer demand for transparency. At the same time, opportunities for innovation lie in high-barrier paper packaging and the integration of smart packaging technologies that redefine consumer engagement and product protection.
Rapid Adoption of Mono-Material, Polypropylene-Based Flexible Packaging
Chocolate manufacturers are accelerating their move from multi-material laminates (PET/ALU/PE) toward recyclable, mono-material polypropylene (PP) packaging to comply with stricter sustainability targets. Nestlé has been at the forefront, transitioning entire confectionery lines such as Smarties to recyclable paper packaging as part of its pledge for 100% recyclable or reusable packaging by 2025. Similarly, Cadbury has implemented wrappers for its sharing bar range containing 80% certified recycled plastic, replacing nearly 600 tons of virgin plastic each year. These commitments are supported by advances in material science. For example, Mondi has developed PP-based mono-material barrier films that provide ultra-high protection against oxygen, water vapor, and fat essential for preserving chocolate’s flavor, texture, and shelf stability. This trend reflects a systemic market shift: brands are no longer experimenting with sustainability but embedding mono-material packaging as a compliance and performance necessity.
Integration of Digital Printing for Hyper-Personalization and Limited Editions
Digital printing is reshaping chocolate packaging into a flexible, consumer-centric marketing tool. Unlike traditional flexographic processes, digital printing eliminates plate costs, enabling cost-effective short runs and personalization. Luxury and premium chocolate brands are increasingly turning to digital presses for limited-edition packaging linked to seasonal events, regional campaigns, or personalized gifting. For example, Ricoh partnered with a premium chocolate brand to launch diverse designs across packaging runs, offering a visually distinctive and premium consumer experience. Smaller brands such as Doisy & Dam have leveraged digital printing to streamline inventory and reduce waste by adopting on-demand production models. This agility allows brands to react quickly to shifting consumer preferences, enhancing time-to-market and minimizing obsolete packaging stock. In a competitive confectionery market, the ability to deliver hyper-personalized, limited-edition packaging is proving to be a key differentiator for consumer engagement and brand loyalty.
Development of High-Barrier Paper and Fiber-Based Solutions
The biggest opportunity in chocolate packaging lies in the creation of recyclable paper-based solutions that meet the stringent moisture, oxygen, and grease barrier requirements essential to chocolate preservation. While paper is inherently sustainable, its barrier limitations pose challenges for sensitive products like chocolate, which is prone to fat bloom and flavor degradation. Brands like Nestlé have already pioneered recyclable paper packaging for Smarties, proving consumer acceptance. Innovation is now focused on barrier technologies such as metallized papers or advanced coatings based on cellulose and chitosan that retain recyclability while providing high-level protection. Packaging leaders like Graphic Packaging International are investing in barrier paper technologies applicable to confectionery, bridging the gap between sustainability and performance. As regulatory frameworks such as the EU’s PPWR set firm deadlines for recyclable packaging, demand for high-barrier paper solutions in chocolate packaging will intensify, creating a major innovation-driven growth segment.
Embedding Smart Packaging for Traceability, Engagement, and Freshness
Smart packaging technologies represent a game-changing opportunity to elevate chocolate packaging beyond its protective function into a data-rich, interactive consumer touchpoint. QR codes and NFC tags can create a digital passport for premium and artisanal chocolates, enabling supply chain transparency from farm to consumer. This not only assures ethical sourcing but also combats the growing issue of counterfeit premium chocolates. Time-temperature indicators (TTIs) further enhance chocolate packaging by providing visual confirmation of freshness and exposure history critical for heat-sensitive products during shipping. A consumer scanning a QR code could access not just origin and ingredient details but also sustainability credentials, loyalty programs, and pairing suggestions. This dual role of brand protection and consumer engagement positions smart packaging as an indispensable tool for differentiation in the premium and mainstream chocolate segments. By integrating traceability, authenticity verification, and freshness assurance, smart packaging aligns directly with rising consumer expectations for transparency, safety, and sustainability.
Competitive Landscape: Leading Companies Driving Chocolate Packaging Industry
The chocolate packaging industry is highly competitive, with global leaders innovating in paper-based, plastic, and hybrid formats. Companies are investing in recyclable materials, premium finishes, and smart packaging to meet consumer and brand-owner demands.
Amcor plc: Innovating with AmFiber™ Performance Paper
Amcor leads in both plastic and paper-based chocolate packaging, offering films, foils, and recyclable solutions. In July 2023, it introduced AmFiber™ Performance Paper in Latin America, a recyclable, PVDC-free paper solution for confectionery. Amcor is pushing toward its 2025 target of 100% recyclable or reusable packaging, with recycle-ready films and paper formats designed to run on existing machinery. Its portfolio supports premium brands that seek eco-friendly yet high-barrier packaging.
Mondi Group: Launching Ultra-High-Barrier Paper Solutions
Mondi remains at the forefront of sustainable chocolate packaging. Its FunctionalBarrier Paper Ultimate, unveiled in September 2025, replaces traditional multi-layer plastic or aluminum while remaining recyclable. Mondi’s integrated supply model from forestry to packaging design ensures consistent quality and sustainability compliance. Its paper and film portfolio supports both everyday chocolate packaging and high-end luxury assortments.
Smurfit WestRock: Strengthening Luxury Chocolate Cartons
Formed in 2025 through the merger of Smurfit Kappa and WestRock, Smurfit WestRock is now a leader in paper-based folding cartons and rigid boxes for chocolates. Its portfolio emphasizes premium finishes, corrugated gift packaging, and e-commerce-ready solutions. The company’s vertical integration ensures circularity, with forest-to-recycling operations enabling sustainable premium packaging that enhances brand unboxing experiences.
Graphic Packaging International: Scaling with Boardio™ and EnviroClip™
Graphic Packaging International focuses on fiber-based solutions for chocolate packaging. Its 2024 Impact Report highlighted replacing nearly 1 billion plastic packs with paperboard. The company’s proprietary Boardio™ and EnviroClip™ technologies help brands reduce plastic dependency while retaining performance. A new recycled paperboard mill in Waco, Texas (operational in 2025) is part of its long-term expansion to serve confectionery and premium chocolate brands worldwide.
Constantia Flexibles: Award-Winning Sustainable Chocolate Packaging
Constantia Flexibles specializes in flexible laminates, foils, and films for chocolates, offering high-barrier solutions that preserve freshness and taste. In August 2025, it won two WorldStar Global Packaging Awards for innovations such as EcoPeelCover and EcoLamHighPlus, both eco-friendly packaging formats. With its strong focus on sustainability and advanced barrier laminates, Constantia caters to both mass-market and premium chocolate brands seeking innovative, recyclable solutions.
Chocolate Packaging Market Share Insights
Wrappers Hold the Largest Market Share by Packaging Type in Chocolate Packaging
Wrappers lead chocolate packaging with a 40% share, cementing their position as the most cost-effective and high-speed solution for protecting chocolates from moisture, light, and oxygen. Flow wraps and twist wraps dominate primary packaging, particularly for countlines and bars produced in the billions annually. Their prevalence reflects not only functionality but also production efficiency, as modern flow-wrap lines can handle extreme volumes with minimal downtime. A critical technical driver is the industry’s ongoing shift from aluminum-foil laminates toward recyclable mono-material films, such as advanced PE or PP, to meet EPR and circular economy mandates without compromising shelf life. This makes wrappers both the economic and sustainability battleground of the chocolate packaging sector, as brands race to balance barrier performance with recyclability.
Countlines Dominate Market Share by Application in Chocolate Packaging
Countlines, representing 35% of chocolate packaging demand, remain the volume leader thanks to the mass-market appeal of individually wrapped bars like KitKat, Mars, and Snickers. The segment’s dominance is a function of scale, brand visibility, and affordability packaging is designed for rapid throughput and maximum shelf recognition, often with bold colors and high-impact graphics. However, the technical challenge lies in transitioning billions of units annually into recyclable formats without raising costs or undermining barrier performance. This application segment also drives packaging line investments, as manufacturers require ultra-high-speed wrapping systems capable of handling global demand surges around seasonal peaks. Countlines thus define both the operational tempo and the sustainability roadmap of the chocolate packaging industry, making them the bellwether for innovation across formats.
United States: Sustainability and E-Commerce Driving Demand for Innovative Chocolate Packaging
The U.S. chocolate packaging market is witnessing significant growth, fueled by rising consumer awareness of sustainability and corporate responsibility. Brands are increasingly adopting recyclable and eco-friendly packaging solutions that cater to environmentally conscious consumers. A key industry development is advanced packaging machinery that enables the use of innovative materials. For example, in June 2024, Constantia Flexibles launched EcoTwistPaper, a wax-free twist-wrap made entirely from paper, prioritizing recyclability in confectionery packaging.
The surge of e-commerce has also reshaped the market, increasing demand for protective, temperature-stable packaging that ensures product safety during shipping while offering a memorable unboxing experience. Major brands like Ghirardelli are leading the charge toward sustainability, targeting over 90% recyclable packaging by 2025. Regulatory frameworks at the state level, such as California’s truth-in-labeling laws and PFAS bans, further drive innovation by requiring compliance with stringent material and safety standards, impacting design and material selection for chocolate packaging.
Germany: Circular Economy Regulations Propel Eco-Friendly Chocolate Packaging
Germany’s chocolate packaging industry is strongly influenced by the EU Packaging and Packaging Waste Regulation (PPWR 2025), which mandates fully recyclable packaging by 2030 and sets ambitious reuse and refill targets. This regulatory environment is creating high demand for eco-friendly chocolate packaging and sustainable material adoption across the supply chain.
The country’s leadership in circular economy practices fosters collaboration between manufacturers and end-users to develop recyclable packaging with high recycled content, aligning with EU sustainability targets. Technological innovation is also driving the market, as seen in December 2023 when LoeschPack unveiled flexible and efficient chocolate packaging machinery at ProSweets 2024. These advancements enable manufacturers to produce high-quality packaging that balances aesthetic appeal, functionality, and environmental compliance, reinforcing Germany’s position as a global hub for sustainable chocolate packaging solutions.
China: Government Policies and Technological Advancements Encourage Sustainable Chocolate Packaging
China’s chocolate packaging market is being shaped by the government’s dual carbon goals, which encourage the use of eco-friendly, reduced, and reusable materials in the food and packaging industries. Manufacturers are increasingly adopting sustainable materials and complying with regulations aimed at reducing environmental impact, fostering innovation in recyclable and biodegradable chocolate packaging.
Technological advancements, including AI integration and 5G-enabled industrial internet, are enhancing production efficiency and flexible manufacturing capabilities. The e-commerce boom in Tier 2 and 3 cities has further increased demand for secure, tamper-proof packaging, while government policies actively promote the use of recyclable or biodegradable materials for express delivery. These combined factors are accelerating the shift toward sustainable chocolate packaging solutions in China.
India: Rising Gifting Culture and Sustainability Drive Premium Chocolate Packaging
The Indian chocolate packaging market is experiencing robust growth due to the rising gifting culture, especially during festivals like Diwali and Raksha Bandhan, which boosts demand for premium, aesthetically appealing packaging. Government initiatives by the Food Safety and Standards Authority of India (FSSAI) have further accelerated the adoption of sustainable packaging materials, including awareness programs and risk assessments for alternative packaging.
Sustainability remains a critical driver, with the Plastic Waste Management (Amendment) Rules phasing out certain single-use plastics and creating demand for eco-friendly alternatives. Technological investments are also enhancing the market, such as the use of advanced barrier films, which extend the shelf life of chocolates in India’s hot and humid climate. These trends position India as a growing hub for innovative, sustainable, and premium chocolate packaging solutions.
Chocolate Packaging Market Report Scope
Chocolate Packaging Market
|
Parameter
|
Details
|
|
Market Size (2025)
|
$12.8 Billion
|
|
Market Size (2034)
|
$18.9 Billion
|
|
Market Growth Rate
|
4.4%
|
|
Segments
|
By Material Type (Paper & Paperboard, Plastic, Aluminum, Other Materials), By Packaging Type (Boxes, Wrappers, Pouches, Bags, Other Types), By Application (Chocolate Bars, Boxed Chocolates, Molded Chocolates, Countlines, Other Applications)
|
|
Study Period
|
2019- 2024 and 2025-2034
|
|
Units
|
Revenue (USD)
|
|
Qualitative Analysis
|
Porter’s Five Forces, SWOT Profile, Market Share, Scenario Forecasts, Market Ecosystem, Company Ranking, Market Dynamics, Industry Benchmarking
|
|
Companies
|
Amcor plc, Mondi Group, WestRock Company, Smurfit Kappa Group, DS Smith plc, Constantia Flexibles, Graphic Packaging Holding Company, International Paper, Avery Dennison Corporation, Huhtamaki Oyj, Sonoco Products Company, AR Packaging, Ahlstrom-Munksjö Oyj, BillerudKorsnäs AB, LoeschPack
|
|
Countries
|
US, Canada, Mexico, Germany, France, Spain, Italy, UK, Russia, China, India, Japan, South Korea, Australia, South East Asia, Brazil, Argentina, Middle East, Africa
|
Chocolate Packaging Market Segmentation
By Material Type
- Paper & Paperboard
- Plastic
- Aluminum
- Other Materials
By Packaging Type
- Boxes
- Wrappers
- Pouches
- Bags
- Other Types
By Application
- Chocolate Bars
- Boxed Chocolates
- Molded Chocolates
- Countlines
- Other Applications
Countries Analyzed
- North America (US, Canada, Mexico)
- Europe (Germany, UK, France, Spain, Italy, Russia, Rest of Europe)
- Asia Pacific (China, India, Japan, South Korea, Australia, South East Asia, Rest of Asia)
- South America (Brazil, Argentina, Rest of South America)
- Middle East and Africa (Saudi Arabia, UAE, Rest of Middle East, South Africa, Egypt, Rest of Africa)
Top Companies in Chocolate Packaging Market
- Amcor plc
- Mondi Group
- WestRock Company
- Smurfit Kappa Group
- DS Smith plc
- Constantia Flexibles
- Graphic Packaging Holding Company
- International Paper
- Avery Dennison Corporation
- Huhtamaki Oyj
- Sonoco Products Company
- AR Packaging
- Ahlstrom-Munksjö Oyj
- BillerudKorsnäs AB
- LoeschPack
* List Not Exhaustive
Methodology
USDAnalytics conducted the Chocolate Packaging Market study using a robust combination of primary and secondary research methodologies to ensure accurate and actionable insights for industry professionals. Primary research involved detailed interviews with key stakeholders, including chocolate manufacturers, packaging designers, sustainability experts, and regulatory authorities, to capture insights on market trends, consumer preferences, and material innovations. Secondary research drew on company reports, press releases, trade journals, industry databases, and regulatory updates to validate market dynamics, technological advancements, and competitive movements such as mergers, acquisitions, and sustainability initiatives. Market sizing and forecast were calculated using historical data, regional consumption patterns, and industry-specific growth drivers, while segmentation analysis examined packaging materials, types, applications, and regional dynamics across key markets such as the U.S., Germany, China, and India. Quantitative data focused on market value, adoption rates of sustainable materials, and premium packaging trends, while qualitative assessment analyzed innovations in mono-materials, high-barrier paper, digital printing, and smart packaging technologies. The methodology emphasizes the convergence of sustainability, premiumization, and technological innovation, providing industry professionals with a comprehensive, data-driven understanding of market opportunities and challenges through 2034.
Deliverables:
- Comprehensive Market Research Report (PDF and Excel) with detailed tables, charts, and interactive visualizations.
- Country-Specific Forecasts & Analysis.
- Segment-Wise Revenue Forecasts (2025–2034).
- Competitive Analysis, Benchmarking, and SWOT Profiles.
- Recent Developments & Innovation Tracker.
- Executive Summary & Analyst Commentary.
- Post-Purchase Analyst Support for Client-Specific Questions and Custom Data Requirements.
