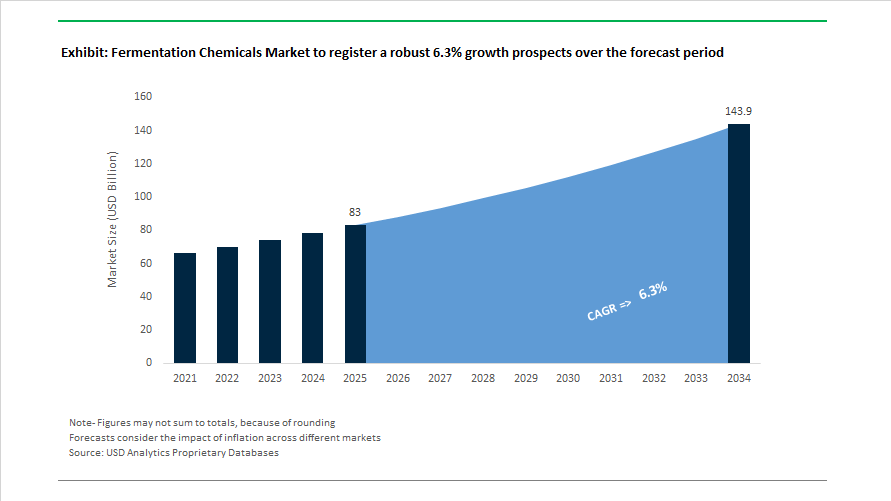
Fermentation Chemicals Market Size 2025–2034: $83 Billion to $143.8 Billion at 6.3% CAGR Fueled by Bio-Based Industrial Scale-Up
The Fermentation Chemicals Market is projected to grow from $83 billion in 2025 to $143.8 billion by 2034, expanding at a CAGR of 6.3%. Market expansion is being driven by large-scale substitution of petrochemical intermediates with bio-based alternatives across food ingredients, industrial enzymes, pharmaceuticals, surfactants, biodegradable polymers, and specialty materials. Industrial fermentation has transitioned from niche biotechnology to core chemical manufacturing infrastructure, supported by advances in precision microbial engineering, synthetic biology, and continuous fermentation systems. Capital deployment is accelerating toward high-value chemicals such as 1,4-butanediol (BDO), caprolactam substitutes, collagen proteins, surfactants, and high-intensity sweeteners.
In January 2024, Novozymes and Chr. Hansen completed their merger to form Novonesis, creating one of the largest global biosolutions platforms integrating enzyme technology and microbial fermentation portfolios for food, beverage, agriculture, and industrial chemical applications. In July 2024, Olon Group acquired GTP Bioways, strengthening its vertically integrated fermentation-based biopharmaceutical and therapeutic protein production capabilities. During 2023 and 2024, Evonik Industries scaled global commercialization of Vecollan®, a fermentation-derived, animal-free collagen targeting medical and cosmetic markets, marking a structural shift toward precision fermentation in biomaterials.
Industrial bio-based chemical production reached new scale in 2024. The Qore joint venture between Cargill and HELM achieved full-scale operations at its Iowa facility, producing Bio-BDO using fermentation pathways as a renewable alternative to fossil-based intermediates for biodegradable plastics and textile fibers. At Food Ingredients Europe 2024, Cargill introduced the latest iteration of EverSweet®, manufactured via yeast fermentation to produce rare steviol glycosides such as Reb M and Reb D at commercial scale without land-intensive cultivation. In 2024, fermentation-driven sweetener innovation reinforced demand for high-intensity, low-calorie sugar alternatives within global beverage and food manufacturing.
Investment intensity expanded further in 2025. In July 2025, BASF doubled DMAPA production capacity in Nanjing, China, incorporating renewable electricity to reduce carbon intensity in detergent and betaine production chains. In September 2025, ADM launched Digest Carb, a rumen fermentation optimizer designed to improve fiber degradability and milk yield efficiency in dairy cattle. In October 2025, Geno partnered with Sojitz Corporation to commercialize plant-based Nylon-6 using proprietary fermentation technology to replace petroleum-derived caprolactam. In November 2025, BASF inaugurated an expanded Alkyl Polyglucosides production facility in Thailand to scale fermentation-derived bio-based surfactants for personal care and industrial applications. During 2025, ADM also advanced its microbiome and postbiotic portfolio, integrating heat-treated fermentation derivatives such as Bifidobacterium longum CECT7347 into functional beverages and nutraceutical formulations. In 2025, Hyosung announced construction of the world’s first fully integrated bio-based spandex manufacturing site using fermented feedstocks, reinforcing fermentation’s penetration into performance textiles. BASF’s planned U.S. bio-based surfactant facility in Cincinnati, scheduled for start-up in early 2026, signals sustained North American demand for fermentation-derived care chemicals and sustainable intermediates.
Trends and Opportunities in the Fermentation Chemicals Market
Decentralized and Modular Biomanufacturing for Regional Supply Security
Global fermentation capacity is being re-architected around decentralized, modular production units rather than single large-scale hubs. These facilities, often referred to as biofoundries, allow chemical producers to localize manufacturing near feedstock sources, reduce logistics exposure, and respond faster to regional demand volatility.
A major policy catalyst emerged in November 2025 when the Government of India launched the National Biofoundry Network under the BioE3 Policy. This initiative establishes six regionally distributed fermentation hubs designed to co-locate agricultural biomass, microbial R&D, and downstream processing. The objective is to build a domestic bioeconomy valued at approximately $300 billion by 2030, positioning fermentation chemicals as a strategic industrial asset rather than an import-dependent specialty.
On the private sector side, Fermenta Biotech announced a capital investment of INR 110 crore in December 2025 to expand its Dahej operations. The focus is on modular, commercial-scale fermentation of enzymes such as CAL-B lipase and plant-derived vitamin D3. This move reflects a broader industry pivot away from fossil-based intermediates toward flexible, biology-first manufacturing that can be rapidly reconfigured across product lines.
The enabling infrastructure is scaling in parallel. The global modular biotech and pharmaceutical construction market reached an estimated $2.8 billion in 2025. Engineering players such as Hovione and Microinnova Engineering, through their September 2025 collaboration, are deploying plug-and-play fermentation units that shorten time-to-market for specialty chemicals and APIs. For fermentation chemical producers, this model significantly lowers capital risk while improving responsiveness to customer qualification cycles.
Scaling Precision Fermentation for Bio-Identical Ingredients and Fragrances
Precision fermentation has crossed a critical inflection point, moving from pilot validation into industrial-scale commercialization. The ability to produce bio-identical proteins, enzymes, and aroma molecules with consistent quality is redefining cost structures and regulatory acceptance across food, cosmetics, and specialty chemicals.
In late 2025, Perfect Day confirmed progress on its large-scale precision fermentation facility in Gujarat, India, with operations targeted for 2026. The plant is designed to address sustained global demand for recombinant whey protein beta-lactoglobulin, which offers superior emulsification and gelling performance in high-protein nutrition products compared to conventional dairy inputs. This signals that fermentation-derived ingredients are no longer capacity constrained but demand constrained.
Innovation is also accelerating in fragrances. In March 2025, Osmo launched its Generation platform, combining artificial intelligence with olfactory intelligence to design fermentation-derived aroma molecules such as Glossine and Quasarine. These molecules replicate rare or endangered botanical notes while offering superior stability and regulatory compliance, allowing fragrance houses to decouple product development from agricultural yield volatility.
Regulatory acceptance is expanding beyond Western markets. In December 2025, China granted its first approval for mycoprotein as a food raw material to Fushine Bio. This decision represents a strategic shift in the world’s largest food market, signaling that fermentation-derived proteins are being integrated into
Conversion of Waste Carbon into Circular Platform Chemicals
Fermentation-based conversion of waste carbon into platform chemicals is emerging as one of the most economically scalable decarbonization pathways for materials and polymers. Products such as lactic acid, succinic acid, and downstream bioplastics are increasingly sourced from industrial off-gases, agricultural residues, and food waste.
A major policy tailwind arrived in November 2025 with the adoption of the EU Bioeconomy Strategy 2025. The strategy targets a €2.7 trillion bio-based economy and includes a flagship Bio-based Europe Alliance, under which corporations have committed to purchasing €10 billion worth of bio-based materials by 2030. This guaranteed offtake materially de-risks fermentation investments and accelerates capacity commitments.
Industrial symbiosis models are scaling fastest in Asia. Outcomes from China’s 14th Five-Year Plan reported in late 2025 show a 20% increase in bio-fermentation output value compared to 2020. Large industrial clusters are converting exhaust gases into protein for aquaculture feed and used cooking oil into sustainable aviation fuel through microbial routes, demonstrating national-scale deployment of waste-to-chemical systems.
Venture capital interest reinforces this trajectory. In November 2025, Green Spot Technologies raised €5 million to scale the upcycling of cocoa by-products into fermented food and feed ingredients. This reflects investor confidence that circular fermentation platforms can achieve both margin expansion and regulatory preference.
Fermentation-Derived Additives for Methane Mitigation and Animal Health
One of the most commercially immediate opportunities for fermentation chemicals lies in livestock methane mitigation. Enteric methane is under growing regulatory and economic scrutiny, transforming fermentation-derived feed additives into compliance-critical inputs.
Following the EU Methane Strategy, countries such as New Zealand are moving toward pricing agricultural emissions by 2025. This has accelerated adoption of fermentation-derived inhibitors such as 3-nitrooxypropanol, which has demonstrated methane reductions ranging from 30% to as high as 90% depending on diet and species.
Beyond emissions reduction, these additives are increasingly positioned as productivity tools. Data from 2025 indicates that redirecting metabolic energy away from methane production can improve feed conversion ratios by 3 to 5%. For a large commercial dairy operation, this efficiency gain can translate into feed cost savings approaching $75,000 annually, strengthening the economic case independent of carbon pricing.
Scientific standardization is reducing market entry risk. In January 2025, the Journal of Dairy Science published globally harmonized technical guidelines for testing anti-methanogenic feed additives. These protocols provide the evidence base required for regulatory approvals, label claims, and participation in voluntary carbon credit markets, creating a clear commercialization pathway for fermentation-based solutions.
Fermentation Chemicals Market Share and Segmentation Insights
Organic Acids Lead Fermentation Chemicals Production Amid Expanding Bioplastics and Food Processing Demand
Organic acids accounted for 28.40% of the Fermentation Chemicals Market share in 2025, positioning them as the largest product category within industrial fermentation technologies. Key fermentation-derived organic acids—including citric acid, lactic acid, acetic acid, and gluconic acid—play a critical role across multiple industries, particularly in food preservation, beverage acidulants, pharmaceutical intermediates, biodegradable plastics, and industrial processing applications. Their dominance is supported by highly optimized microbial fermentation processes that allow cost-efficient large-scale production using sugars, starch feedstocks, and renewable biomass. A defining development shaping the fermentation chemicals industry in 2025 is the rapid expansion of lactic acid production to support the growing polylactic acid (PLA) bioplastics market. As global regulations and corporate sustainability commitments accelerate demand for biodegradable packaging materials, manufacturers in China, Thailand, and other Asia-Pacific production hubs have significantly expanded fermentation capacity to supply high-purity lactic acid for PLA polymerization. PLA is increasingly used in compostable food packaging, 3D printing filaments, disposable consumer goods, and textile fibers, reinforcing organic acids as a foundational component of the global fermentation chemicals value chain.
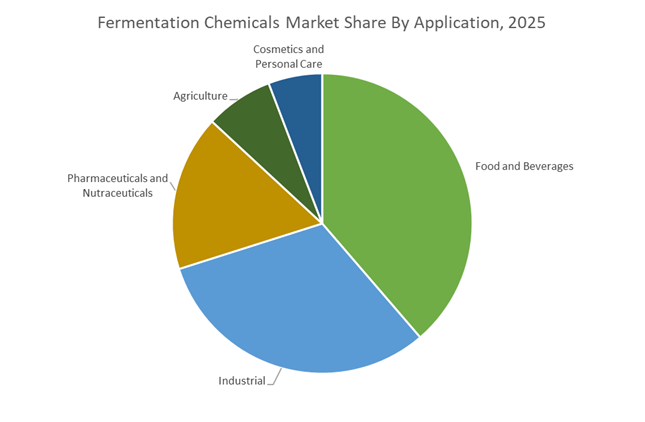
Food and Beverage Manufacturing Drives the Largest Consumption of Fermentation-Derived Ingredients
Food and beverages represented 38.70% of the Fermentation Chemicals Market share in 2025, making it the largest application segment for fermentation-based industrial chemicals. The global food industry depends heavily on fermentation-derived ingredients including citric acid, lactic acid, amino acids such as monosodium glutamate (MSG), vitamins, and industrial enzymes that function as acidulants, preservatives, flavor enhancers, nutritional fortifiers, and processing aids. These ingredients play essential roles in improving food shelf life, taste profile, texture stability, and nutritional value across processed foods, beverages, dairy products, and convenience meals. In 2025, a key structural driver supporting fermentation chemicals demand is the growing clean label movement within the food industry. Consumers increasingly prefer ingredients perceived as natural, biologically produced, and minimally processed, while rejecting synthetic chemical additives. Fermentation-derived compounds benefit from strong “nature-identical” positioning, allowing food manufacturers to reformulate products using biologically produced acids, enzymes, and vitamins that align with clean-label standards. As a result, major food companies are actively replacing chemically synthesized additives with fermentation-produced alternatives, even when production costs are higher, strengthening the strategic importance of fermentation technology in the global food ingredient supply chain.
Competitive Landscape in Fermentation Chemicals Market
Novonesis Consolidates Leadership as the World’s Largest Pure-Play Biosolutions Company
Novonesis, formed through the 2024 merger of Novozymes and Chr. Hansen, represents the largest pure-play biosolutions company in the global fermentation chemicals market. The company manages a microbial strain library exceeding 100,000 strains supported by more than 10,000 patents, reinforcing its dominance in industrial enzymes, microbial cultures, and specialty fermentation-derived chemicals. In late 2025, Novonesis acquired dsm-firmenich’s animal feed enzyme business, consolidating the Feed Enzyme Alliance and strengthening its global distribution and R&D integration in livestock nutrition enzymes. The opening of a dedicated Powder Lab in India during 2025 enhances localized co-development of fermentation-derived enzymes for detergent and textile processing markets. Financially, Novonesis delivered 7% organic growth in 2025 with an adjusted EBITDA margin near 37%, underscoring strong operating leverage in high-value biosolutions. Its strategic ambition to generate €877 billion in economic value by 2035 through CO₂ reduction and chemical substitution positions the company at the forefront of industrial biotechnology and sustainable fermentation chemicals.
ADM Expands Industrial Biosolutions Through Vertically Integrated Fermentation Platforms
Archer Daniels Midland has transformed from a conventional grain processor into a major force in industrial fermentation chemicals and bio-based solvents. Its Industrial Biosolutions division produces large-scale fermentation nutrients, organic acids, and renewable chemical intermediates designed to replace petrochemical raw materials with crop-derived feedstocks. ADM’s vertical integration across oilseed crushing and wet milling operations provides secure access to dextrose and starch substrates required for industrial fermentation, strengthening cost control and supply reliability. In 2025, the company deployed a High-Speed Development System leveraging artificial intelligence to accelerate microbial strain engineering and shorten commercialization timelines for new bio-based chemicals. With $5.5 billion in operating cash flow reported in 2025, ADM reinforced capital allocation toward fermentation expansion and demedication strategies that utilize fermentation-derived palatants to support antibiotic-free livestock production. This combination of feedstock integration, AI-enabled strain optimization, and biorefinery scale solidifies ADM’s competitive position in renewable fermentation chemicals.
BASF Accelerates Bio-Based Chemical Integration Within Its Global Verbund Network
BASF continues to reposition its Nutrition and Care portfolio toward fermentation-derived vitamins, amino acids, and enzymes while leveraging its integrated Verbund production model. The company maintains significant scale in lysine, threonine, and fermentation-based intermediates for detergents and automotive coatings. In November 2025, BASF initiated operations at the core of the Zhanjiang Verbund site in China, adding capacity for non-ionic surfactants and citral produced through integrated bio-chemical pathways. Parallel expansion at the Geismar, Louisiana facility, targeted for completion in 2026, increases MDI capacity to 600,000 metric tons with gradual integration of bio-based precursors where commercially viable. Under the Winning Ways strategy for 2025 and 2026, BASF focuses on unlocking value in Agricultural Solutions and optimizing core chemical production efficiency. Despite macro volatility in 2025, BASF’s ability to embed fermentation chemistry into its global infrastructure reinforces its competitive resilience in industrial biotechnology and sustainable chemical manufacturing.
Ajinomoto Group Leverages AminoScience to Expand Specialty Fermentation Chemicals
Ajinomoto Group remains a global authority in amino acid fermentation and high-purity biochemical production under its AminoScience platform. The company dominates specialty amino acids for healthcare, food formulation, and advanced materials applications, supported by decades of microbial fermentation expertise. Its innovation pipeline extends beyond nutrition into biodegradable plastics and semiconductor materials such as ABF film, which is essential for advanced AI processors and autonomous vehicle electronics. The 2025 ASV Report outlining the Vision for 2030 prioritizes Healthcare, Food and Wellness, ICT, and Green sustainability as core growth pillars. Ajinomoto is accelerating its Bio-Pharma CDMO services, particularly in gene therapy using AAV vectors and antibody culture media manufactured through proprietary fermentation technologies. By integrating fermentation-derived specialty chemicals across healthcare and electronics, Ajinomoto strengthens its positioning in high-margin industrial biotechnology markets.
Evonik Targets Precision Biosolutions and Bio-Based Surfactants for Future Growth
Evonik Industries has streamlined its portfolio by divesting fossil-intensive operations and prioritizing precision biosolutions and fermentation-derived specialty chemicals. The company leads in fermentation-based animal nutrition products such as Biolys and in rhamnolipid biosurfactants designed for eco-friendly household and industrial cleaners. In 2025, Evonik partnered with AGAE Technologies to scale what is positioned as the largest rhamnolipid production facility in Asia, supporting growing demand for biodegradable surfactants. The launch of the Next Markets Program in September 2025 enables rapid entry into adjacent sectors including circular packaging and aerospace materials through fermentation-derived polymers. Evonik also targets balanced regional revenue distribution across North America, Europe, and Asia Pacific by 2026 to mitigate geopolitical risks. Its emphasis on bio-based surfactants, specialty amino acids, and advanced fermentation platforms consolidates its role in the evolving global fermentation chemicals market.
India: Precision Fermentation Scale-Up Anchored by Policy and Soil Health Economics
India’s fermentation chemicals landscape is moving from pilot-led experimentation to industrial-scale execution, underpinned by coordinated policy instruments and downstream demand creation. A pivotal development is the Gujarat manufacturing facility being developed by Perfect Day, scheduled to begin initial operations in the second half of 2026. This world-scale plant is designed for recombinant whey protein production and positions India as a regional export base for precision-fermented food ingredients targeting Asia’s expanding alternative protein and nutrition markets. The project reflects a broader shift toward high-value fermentation outputs rather than commodity bio-chemicals.
This transition is structurally supported by the BioE3 Policy, which entered its execution-heavy phase in 2025. The policy framework accelerates the creation of biomanufacturing hubs, offering fiscal incentives, shared infrastructure, and faster clearances for fermentation-based specialty chemicals. In parallel, agriculture-linked fermentation demand is strengthening. Under the PM-PRANAM initiative, the government has prioritized Fermented Organic Manure. In January 2026, FACT reported profit growth driven by its FACT FOM product line, highlighting how microbial fermentation is being monetized through soil fertility and yield enhancement rather than pure chemical substitution. Additionally, the Production-Linked Incentive scheme for bulk drugs and specialty chemicals is driving localization of fermentation-based synthesis for 41 APIs, reinforcing India’s ambition to integrate fermentation deeper into pharmaceutical value chains.
China: Self-Sufficiency Targets and Feed Additive Scale Define Fermentation Trajectory
China’s fermentation chemicals market is being shaped by a clear industrial mandate centered on self-sufficiency and scale. The MIIT-led Green Growth Work Plan for 2025–2026 targets more than 5% annual growth in chemical value addition while mandating 90% self-reliance in high-end fine chemicals by 2026. Bio-based amino acids, enzymes, and fermentation-derived feed additives are explicit beneficiaries of this roadmap, particularly as China seeks to insulate strategic supply chains from external volatility.
Execution on the ground is visible through capacity expansions. Adisseo completed mechanical construction of its 37KT specialty blending facility in Nanjing in late 2024, with ramp-up continuing through 2025. The site is emerging as a hub for high-performance fermentation-derived additives serving China’s livestock and aquaculture sectors. Upstream integration is also strengthening. In April 2025, Wanhua Chemical operationalized its Phase II ethylene complex, securing feedstock pathways for large-scale fermentation-derived polymers such as bio-based succinic acid. This integration reduces cost variability and improves scalability for downstream fermentation chemistry.
United States: Regulatory Validation and Joint Ventures Accelerate Commercial Adoption
The United States remains a global commercialization engine for fermentation chemicals, driven by regulatory clarity and strategic partnerships. In April 2025, IFF and Kemira launched AlphaBio, a joint venture focused on renewable, fermentation-derived specialty materials for personal care and industrial markets. The venture underscores a growing preference for fermentation routes that deliver performance parity with petrochemical materials while meeting sustainability benchmarks.
Regulatory milestones are further de-risking adoption. In 2025, Onego Bio received a “No Questions” GRAS letter from the US FDA for its Bioalbumen product, confirming immediate suitability for food applications. Precision fermentation scaling is also advancing through manufacturing alliances. Vivici, a venture between DSM-Firmenich and Fonterra, partnered with Liberation Bioindustries in 2025 to manufacture bovine lactoferrin at industrial scale in Indiana, with production commencing in early 2026. These developments highlight how the U.S. market is translating fermentation innovation into bankable, regulated supply chains.
Germany: Industrial Fermentation Repositioned Toward Crop Protection and Biopharma
Germany’s fermentation chemicals sector is pivoting toward high-margin, regulation-aligned applications in agriculture and biopharmaceuticals. At the industrial core, BASF is preparing to commission a new fermentation plant at its Ludwigshafen site in the second half of 2025. The facility will produce the active building block for Inscalis, a fungal-derived insecticide, signaling a decisive shift toward biological crop protection as regulatory pressure mounts on synthetic chemistries across Europe.
In parallel, biopharmaceutical demand is reshaping fermentation portfolios. Croda International, in collaboration with Amino GmbH, announced the January 2026 launch of the BioXPro range. This portfolio comprises high-purity fermentation-derived amino acids and specialty esters designed for biologic drug stabilization and advanced bioprocessing. These moves reflect Germany’s emphasis on precision, purity, and regulatory robustness in fermentation chemistry.
United Arab Emirates: Circular Bioeconomy and Pilot-to-Scale Ambitions
The UAE is positioning fermentation chemicals as a strategic pillar of its industrial diversification agenda. Under the Operation 300bn strategy, the country has prioritized the circular bioeconomy as a growth vector. In 2025, the government announced new grant funding for pilot-scale fermentation facilities aimed at strengthening domestic capabilities in bio-solvents and organic acids. While current capacity remains limited, these pilots are designed to de-risk scale-up and attract foreign technology partners, laying the groundwork for regional fermentation hubs serving the Middle East and Africa.
Strategic Snapshot: Fermentation Chemicals Market by Country (2025–2026)
Fermentation Chemicals Market County Level Snapshot
|
Country
|
Primary Policy or Investment Driver
|
Fermentation Focus Area
|
Strategic Implication
|
|
India
|
BioE3 Policy and PLI schemes
|
Precision proteins, FOM, APIs
|
Rapid scale-up and export-oriented capacity
|
|
China
|
MIIT self-sufficiency mandate
|
Amino acids, feed additives, bio-polymers
|
Cost-led scale with integrated feedstocks
|
|
United States
|
GRAS clearances and JVs
|
Precision proteins, specialty materials
|
Fast commercialization with regulatory certainty
|
|
Germany
|
Crop protection and biopharma shift
|
Fungal actives, amino acids
|
High-margin, regulation-aligned production
|
|
UAE
|
Operation 300bn bioeconomy push
|
Bio-solvents, organic acids
|
Pilot-led ecosystem building
|
Fermentation Chemicals Market Report Scope
Fermentation Chemicals Market
|
Parameter
|
Details
|
|
Market Size (2025)
|
$83 Billion
|
|
Market Size (2034)
|
$143.8 Billion
|
|
Market Growth Rate
|
6.3%
|
|
Segments
|
By Product Type (Alcohols, Organic Acids, Amino Acids, Industrial Enzymes, Biopolymers, Vitamins and Antibiotics), By Feedstock (Grains, Sugar Crops, Lignocellulosic Biomass, Roots and Tubers), By Process (Batch Fermentation, Continuous Fermentation, Aerobic Fermentation, Anaerobic Fermentation), By Application (Industrial, Food and Beverages, Pharmaceuticals and Nutraceuticals, Agriculture, Cosmetics and Personal Care)
|
|
Study Period
|
2019- 2025 and 2026-2034
|
|
Units
|
Revenue (USD)
|
|
Qualitative Analysis
|
Porter’s Five Forces, SWOT Profile, Market Share, Scenario Forecasts, Market Ecosystem, Company Ranking, Market Dynamics, Industry Benchmarking
|
|
Companies
|
BASF SE, Cargill, Incorporated, Archer Daniels Midland Company, DSM-Firmenich, Evonik Industries AG, Novonesis, Ajinomoto Co., Inc., Corbion N.V., Lonza Group AG, DuPont de Nemours, Inc., Dow Inc., Bluestar Adisseo Co., Biocon Limited, Lallemand Inc., Kyowa Hakko Bio Co., Ltd.
|
|
Countries
|
US, Canada, Mexico, Germany, France, Spain, Italy, UK, Russia, China, India, Japan, South Korea, Australia, South East Asia, Brazil, Argentina, Middle East, Africa
|
Fermentation Chemicals Market Segmentation
By Product Type
- Alcohols
- Organic Acids
- Amino Acids
- Industrial Enzymes
- Biopolymers
- Vitamins and Antibiotics
By Feedstock
- Grains
- Sugar Crops
- Lignocellulosic Biomass
- Roots and Tubers
By Process
- Batch Fermentation
- Continuous Fermentation
- Aerobic Fermentation
- Anaerobic Fermentation
By Application
- Industrial
- Food and Beverages
- Pharmaceuticals and Nutraceuticals
- Agriculture
- Cosmetics and Personal Care
By Region
- North America (United States, Canada, Mexico)
- Europe (Germany, France, United Kingdom, Spain, Italy, Rest of Europe)
- Asia Pacific (China, India, Japan, South Korea, Australia, Rest of APAC)
- South and Central America (Brazil, Argentina, Rest of SCA)
- Middle East and Africa (Saudi Arabia, UAE, South Africa, Rest of Middle East, Rest of Africa)
Top Companies in the Fermentation Chemicals Industry
- BASF SE
- Cargill, Incorporated
- Archer Daniels Midland Company
- DSM-Firmenich
- Evonik Industries AG
- Novonesis
- Ajinomoto Co., Inc.
- Corbion N.V.
- Lonza Group AG
- DuPont de Nemours, Inc.
- Dow Inc.
- Bluestar Adisseo Co.
- Biocon Limited
- Lallemand Inc.
- Kyowa Hakko Bio Co., Ltd.
*- List not Exhaustive
