Water Treatment Systems Market Overview: Strong Growth Driven by Urbanization, Scarcity, and Digital Innovation
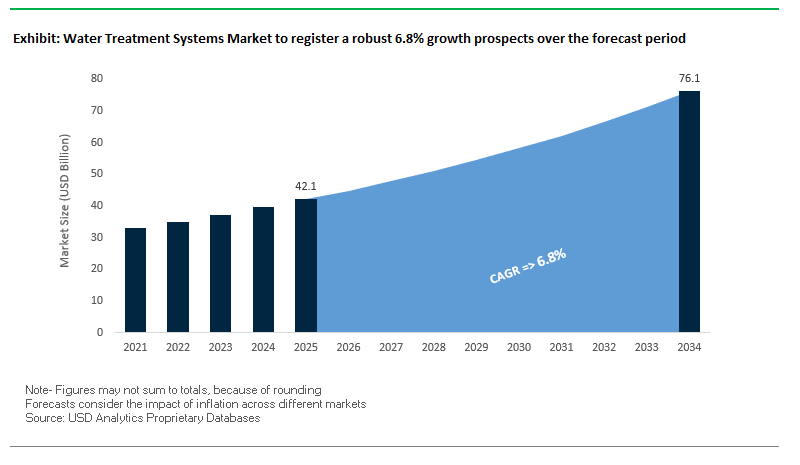
The global water treatment systems market is projected to grow from USD 42.1 billion in 2025 to USD 76.1 billion by 2034, reflecting a CAGR of 6.8%. The strong growth path is powered by a confluence of structural forces such as acceleration in urbanization, deepening water scarcity, upgrading aging infrastructure, and embedding digital technologies in water management practices. With 55% of the world's population now living in urban areas and projected to grow to 68% by 2050, cities and industries are increasingly encountering surging demand for high-tech water purification, wastewater management, and resource recovery solutions. Secondly, the World Health Organization's estimate that more than 2 billion individuals lack access to clean drinking water highlights the need for innovation in both potable and non-potable treatment systems. Developed economies, especially the U.S., are facing water infrastructure of more than 50 years, providing huge-scale replacement and upgrade opportunities.
Key Insights for Industry Professionals:
- Urbanization Surge: Expanding cities are intensifying demand for municipal water treatment capacity.
- Water Scarcity Pressure: Growing contamination and climate-induced droughts are accelerating technology adoption.
- Infrastructure Renewal: Aging pipelines and plants in developed markets are driving multi-billion-dollar investments.
- Digital Transformation: Smart sensors, analytics, and AI are revolutionizing water treatment efficiency.
Market Analysis – Strategic Shifts, M&A Activity, and Technology Advancements
Market dynamics are changing through a series of infrastructure spending, sustainability-focused technology launches, and high-value mergers and acquisitions. Accelerating urbanization and industrialization propel municipal and industrial customers toward more sophisticated systems with greater loads handling capacity and adherence to more stringent environmental standards. Governments and private utilities increasingly give high priority to energy-efficient, digitally connected systems, with Xylem presenting dramatic results like "smart sewer" technology cut combined sewer overflow by 80%, saving a utility USD 400 million in capital costs.
Strategic alliances and buys are transforming the competitive landscape of the industry. For example, Solenis' June 2025 deal to merge with NCH Corporation will establish a more diversified vendor with excellent cross-selling opportunities for digital and sustainable water solutions. Likewise, Veolia's buys from December 2024 through May 2025, such as Serquip Tratamentos Residuos Al Ltda and Alagoas Ambiental SA, show focused expansion in niche regional markets. SUEZ's December 2024 Toulouse-area concession agreement emphasizes the increasing overlap between water treatment and energy recovery solutions, while its January 2025 acquisition of a controlling stake in Gruppo Ecosistem solidifies its hazardous waste treatment capacity.
Product innovation continues to be a basis for competitive strength. Pentair's January 2025 award for its Everpure PFAS Reduction Systems reacts to increasing regulatory and public demands to eliminate "forever chemicals," while its Manitowoc Ice NEO system combines water filtration to enhance end-user convenience. Firms also continue to deepen their digital offerings, such as Pentair's October 2024 introduction of the mySüdmo app are enhancing customer involvement in industrial valve selection. In September 2024, Xylem's partnership with ADI Systems introduced to market a next-generation anaerobic membrane bioreactor for industrial wastewater treatment with greater potential for energy recovery. Geographic expansion is also in the works, with Solenis' August 2024 investment in a new R&D center in India focused on creating region-specific solutions for the Asia-Pacific.
Key Market Trends Transforming the Water and Wastewater Treatment Equipment Industry
Rising Adoption of Smart Water Treatment Technologies for Efficiency and Sustainability
Water and wastewater treatment equipment market is experiencing a revolutionary transformation toward IoT- and AI-based smart water management solutions that offer real-time monitoring, predictive insights, and operational optimization. Utilities and industrial operators are increasingly using digital twin technology to replicate and manage intricate water networks, facilitating leak detection faster, energy optimization, and cost reduction. Investment activity highlights rising commercial interest and confidence in water-focused venture capital firms, exemplified by Waterly's $4 million Series A investment. The trend toward scalable, cloud-based water management platforms shows increased optimism about trapped and untapped revenues within water utilities. Residential sector developments like GE Appliances' GE Profile Smart Water Valve show how connected devices are improving end-user control and smartphone-enablement of shut-offs. As municipalities, industries, and homes move toward intelligent and efficient water system goals, digitalization is being regarded as a competitive imperative instead of a luxury.
Stricter PFAS Regulations Accelerating Demand for Advanced Filtration Systems
The strength of Per- and Polyfluoroalkyl Substances (PFAS) regulations is driving brisk uptake of next-gen filtration and adsorption technologies, particularly at municipal and industrial water treatment plants. Near-zero EPA regulatory limits of PFOA and PFOS have caused immediate requirements for compliance, accelerating investment in next-gen filtration media. Specialized ion exchange resins specifically developed and launched by Purolite shows the innovation focusing on what is needed by regulators. High capital expenditures like annual health and environmental costs of up to $5.52 billion to $62.6 billion in the U.S. and €52 billion to €84 billion in the EEA representing PFAS-related annual costs are what are pushing next-gen treatment for public health and economic reasons. Decentralized wastewater systems (DWWSs) offer a high-growth opportunity, especially in development regions where central infrastructure is lacking.
Strategic Opportunities Driving Market Growth
Decentralized Water Treatment Solutions in Emerging Economies
Research indicates that although research interests in development countries allocate only 45% of attention toward DWWS performance, their documented ability for sustainable treatment at a small scale has strong scalability potential. Technologies such as AQUAKIT SRL's Bolivia-based greywater reclamation system that is capable of recovering 300,000 liters/month exemplify decentralized, low-footprint technologies that save water, decrease wastewater effluent, and enable community-based management.
Corporate-Driven Water Reuse and Circular Economy Models
Industrial adoption of zero-liquid discharge (ZLD) and closed-loop water reuse technologies is accelerating as businesses seek water footprints of net zero and reduced operating costs. Chile is a testament to the economic viability of the models. The nation's wastewater reuse projects designed for industrial customers have recovered full cost within fewer than five years, and energy recovery retrofits now account for more than 50% of plant energy requirements. Technologically, new technologies such as Membrion's electro-ceramic desalination that recovers up to 98% of water from intricate industrial effluents are redefining what is possible for reuse within harsh process environments. At the intersection of sustainability, cost-effectiveness, and technology maturity are the circular water strategies assuming a key growth driver within the industry.
Water Treatment Systems Market Share Insights
Market Share by Type of System: Point-of-Use Leads the Global Water Treatment Systems Market
Point-of-Use (POU) systems are expected to contribute about 41.8% of the water treatment system market share by 2025 and will therefore remain the largest and most consumer-focused category. This leadership is due to robust adoption of under-sink and countertop reverse osmosis (RO) systems, especially where cities are concerned about the safety of tap water. Conversely, Point-of-Entry (POE) systems are likely to take about 34.9% of the market based on requirements for whole-home protection from hard water, sediments, and chemical contaminants. Alternatively, water softeners are entrenched in their niche within the POE category and are crucial for hard-water zones where scale deposition results in appliance failure and wear and tear on plumbing lines.
.png)
Market Share by Application: Residential Usage Outpaces Industrial and Commercial Demand
The residential sector leads with a 47.8% 2025 share, forecasting the rising health-minded end use base, urbanization growth, and deteriorating municipal water quality. Residential use is strongest with small POU RO system units, pitchers, and faucet-mounted filters. Conversely, the industrial sector, which claims nearly 27.4% market share, has the greatest revenue-per-installation opportunity due to its need for sophisticated, made-to-order solutions within boiler feed water, formulation of products, and water reuse for waste treatment. Commercial use, with a market share of 18.4%, has a steadily growing market and is concentrated within hospitality, healthcare facilities, and institutional kitchens where water quality has a direct bearing on service quality and standard compliance.
Market Share by Technology: Membrane-Based Systems Anchor the Industry
Membrane technologies such as reverse osmosis (RO), ultrafiltration (UF), and nanofiltration (NF) will occupy close to 42.1% of the global water treatment system market share come 2025 and solidify their position as the basis of modern purification. RO is the preferred dissolved solid eliminator method in the domestic market and industrial and commercial applications. Filter technologies comprising sediment and activated carbon filters occupy close to 26.1% of the market share, both supporting individual applications and necessary pre-treatment measures of complex configurations. Ion exchange technologies meanwhile occupy a constant 14.3% of the market share where water softening is at play and at industrial volumes of prevention applications.
Market Share by Sales Channel: Offline Retail Retains Dominance While Online Surges
In spite of the growth of online commerce, brick-and-mortar retailing still leads the pack with nearly 54.7% of global retailing in 2025 due to end-user dependence on special-purpose dealers and skilled installers of mid-to-premium water treatment systems. This is particularly true of POE (point-of-end) systems, which need technical knowledge to install and maintain. Online retailing channels are nevertheless making their mark at a very fast pace and are expected to account for 31.7% of overall retailing, driven by rising end-user interest in convenient retailing, price competitiveness, and the popularity of direct-to-consumer (D2C) water filter brands. Direct retailing nevertheless continues to play a crucial role in B2B and industrial/commercial projects of significant scale and door-to-market top-end domestic systems in a few markets.
Market Share by Price Range: Mid-Range Systems Drive the Core Market
By 2025, mid-range systems will hold the largest share at around 43.8%, establishing themselves as the sweet spot for consumers seeking reliable, multi-stage RO or hybrid systems without premium add-ons. These systems balance affordability and efficiency, making them the most attractive to mass-market buyers across both developed and emerging economies. In contrast, low-cost economy systems are projected to account for 35%, driven by mass adoption of pitchers, faucet-mounted filters, and entry-level countertop systems that appeal to price-sensitive households. The premium segment, although smaller at 20%, is strategically important as it drives innovation through smart RO systems, IoT-enabled monitoring, advanced remineralization, and aesthetically designed whole-home solutions, and others enhance profitability for leading brands.
Country Analysis of the Water Treatment Systems Market
United States: Pioneering Advanced Water Treatment Technologies
The United States is a global innovation water treatment system leader with extensive federal investment and regulatory support. More than $50 billion was committed by the Bipartisan Infrastructure Law of 2021 toward upgrading drinking water, wastewater, and stormwater infrastructure and spurring market growth. Industry giants such as GE Appliances are increasing operations, led by its South Carolina 2022 distribution center, to boost water treatment distribution infrastructure. Strategic acquisitions have assisted A.O. Smith Corporation expand its North American foothold with recent acquisitions of Atlantic Filter of Florida (2022) and Master Water Conditioning Corporation of Pennsylvania (2021). Innovations of technology are equally assisting; Clemson University scientists invented a coated carbon nanotube-based saltwater deionization system improving salt adsorption and reducing energy consumption. NanoResin filtration media development focused on maximizing organic matter removal is led by the University of North Carolina at Charlotte. Regional infrastructure development is seen within Florida, California, and Texas where low-pressure reverse osmosis and solar-powered desalination plants are on a growth trend toward increased use of environmentally friendly and energy-efficient water treatment technologies.
India: Rapid Expansion of Rural and Urban Water Infrastructure
India's water treatment system market is growing at unprecedented rates, driven by government initiatives and innovative private sector engagement. "Namami Gange" has approved 488 projects worth more than ₹39,730 crore, of which 303 are completed up to December 2024, of which 12 new projects are related to expansion and rehabilitation of sewage treatment capacity. In early 2024, a 14 MLD Sewage Treatment Plant (STP) commissioning at Baghpat and a 220 MLD STP ground-breaking at Meerut were examples of the government push toward upgrading water infrastructure. Jal Jeevan Mission is a key catalyst forming targets for potable water supply access by each and every rural family through tap connections. India is also adopting global partnerships; the Smart Laboratory for Clean Rivers (SLCR), co-created with Denmark, introduces end-of-the-line solutions for purification of river water. Startups such as Earthy are using biomimetic membrane technologies based on aquaporin proteins to optimize the efficiency of filtration. Major corporations such as Larsen & Toubro's Water Business Group are undertaking scale-wide water supply and wastewater management projects, further solidifying market adoption and infrastructure functionality.
Saudi Arabia: Strategic Investments in Desalination and Water Treatment
The Saudi water treatment system industry is significantly dominated by seawater desalination with state-led investment and infrastructure development. Desalination plants are primarily operated by the government-owned Saline Water Conversion Corporation (SWCC). Projects like Rabigh 3 desalination plant (600,000 m³/day) are examples of national scale water infrastructure investment within the kingdom. Other projects currently being developed like Yanbu 4 (450,000 m³/day) and Jubail 3A are testament to remarkable growth in desalination capacity. They are examples of Saudi emphasizing sustainable water supply sources to cater to increasing urban and industry demand.
China: Regulatory-Driven Market Growth and Industrial Adoption
China’s water treatment systems market is being propelled by stringent government regulations and rapid industrialization. Environmental laws now mandate effluent treatment across municipal and industrial sectors, creating a robust regulatory framework for water treatment adoption. The increase in industrial activities further accelerates demand for advanced water purification systems. Notable infrastructure projects, such as the Tianjin Desalination Plant with a 200,000 m³/day capacity, underscore the country’s commitment to large-scale water treatment solutions. The combination of regulatory pressure and industrial growth positions China as a critical market for both domestic and international water treatment technology providers.
UAE: Middle East Hub for Large-Scale Desalination Projects
The UAE has established itself as a strategic hub for large-scale desalination and advanced water treatment solutions in the Middle East. Key projects, including the Fujairah and Umm Al Quwain Independent Water Plants (IWP), demonstrate substantial treatment capacity and technological innovation. The Taweelah Desalination Plant, with a capacity of 909,000 m³/day, ranks among the largest globally, illustrating the UAE’s leadership in water treatment infrastructure. Corporations like Doosan Heavy Industry are actively expanding their regional presence, contributing to critical projects such as the Jebel Ali water treatment facility. These developments highlight the UAE’s growing adoption of high-capacity, energy-efficient desalination technologies.
Israel: Innovation in Steam-Driven Seawater Reverse Osmosis
Israel’s water treatment systems market is characterized by cutting-edge technological advancements, particularly in desalination. In March 2025, IDE Water Technologies brought the Sorek 2 – Be'er Miriam Desalination Plant online, marking the world’s first steam-driven seawater reverse osmosis (SWRO) facility. The innovation enhances operational efficiency and sustainability in large-scale water treatment. Israel also maintains significant desalination capacity through existing plants like Sorek I and Hadera, reflecting the country’s leadership in advanced water treatment technology adoption and implementation.
Competitive Landscape- Leading Innovators and Strategic Expansions in Water Treatment
The global water treatment systems market is shaped by a mix of multinational leaders with diverse portfolios and regional specialists driving innovation. Competition centers on technological leadership, operational integration, and geographic reach, with mergers, acquisitions, and product launches serving as primary growth levers.
Xylem Inc. – Expanding Smart Water Solutions Globally
Xylem is dedicated to providing end-to-end water and wastewater solutions powered by digital technologies. Its Xylem Vue Suite delivers utilities with insightful analytics that improve performance and reduce operating expenditures. Supported by a roster of brands like Flygt and Sanitaire and over 8,300 patents and trademarks, it serves municipalities, industry, and commercial institutions in over 150 countries. Its 2023 acquisition of Evoqua Water Technologies added industrial and commercial service expertise and makes it a smart water infrastructure champion.
Veolia Environnement S.A. – Driving Ecological Transformation
Veolia delivers end-to-end services throughout the complete water cycle, waste and energy recovery. Its expertise at designing, constructing and operating infrastructure is a competitive advantage when it comes to turnkey projects. Recent acquisitions like Serquip Tratamentos Residuos Al Ltda. in May 2025 solidify its local leadership and broaden special offerings. Veolia's emphasis on circular economy concepts positions it at the cutting-edge of sustainable urban water management.
SUEZ S.A. – Strengthening Digital and Hazardous Waste Expertise
SUEZ serves 57+ million with drinking water and 36+ million with sanitation solutions using a 40+ country footprint. It possesses both engineering capabilities and a strong digital offering, with 1,700+ patents. Recent initiatives, like the acquisitions of Gruppo Ecosistem in January 2025 and of a 20-year concession agreement spanning the Toulouse region in December 2024, show the pattern of pairing waste recovery and water treatment with greater sustainability impact.
Pentair plc – Innovating for Emerging Contaminant Removal
Pentair is dedicated to environmentally sustainable solutions for home, commercial, and industrial water applications. Its winning Everpure PFAS Reduction Systems of January 2025 address a crucial emerging contaminant threat. It also avails itself of information technologies like the mySüdmo mobile app for improved industrial equipment choice. The diversified product spectrum of Pentair from filtration equipment to pool and spa equipment makes it a robust competitor within a number of end-user segments.
Danaher Corporation – Advancing Water Quality Analytics
Through its Hach subsidiary, Danaher provides meters, reagents, and software for accurate water quality measurement. Its complete solutions encompass hardware and software and service offerings that help clients achieve strict regulatory requirements. Danaher puts significant investment toward research and development and academic partnerships so that it is always at the cutting edge of water testing and analytical technologies.
Water Treatment Systems Market Report Scope
Water Treatment Systems Market
|
Parameter
|
Details
|
|
Market Size (2025)
|
$42.1 Billion
|
|
Market Size (2034)
|
$76.1 Billion
|
|
Market Growth Rate
|
6.8%
|
|
Segments
|
By Type of Water Treatment System (Point-of-Use (POU) Systems, Point-of-Entry (POE) Systems, Ultrafiltration (UF) Systems, Distillation Systems, Disinfection Systems, Membrane Filtration Systems), By Application (Residential, Commercial, Industrial, Municipal), By Technology (Filtration, Membrane Technology, Distillation, Ion Exchange, Electrodialysis, Electrochlorination), By Sales Channel (Online Retail, Offline Retail, Direct Sales), By Price Range (Economy/Low-Cost Systems, Mid-Range Systems, Premium Systems)
|
|
Study Period
|
2019- 2024 and 2025-2034
|
|
Units
|
Revenue (USD)
|
|
Qualitative Analysis
|
Porter’s Five Forces, SWOT Profile, Market Share, Scenario Forecasts, Market Ecosystem, Company Ranking, Market Dynamics, Industry Benchmarking
|
|
Companies
|
Veolia, Xylem Inc., Ecolab, SUEZ, DuPont, Pentair, Kurita Water Industries, Thermax Limited, VA Tech Wabag, Ion Exchange India Ltd., Aquatech International LLC, Calgon Carbon, Toshiba Water Solutions, Larsen & Toubro (L&T) - Water & Effluent Treatment, Sustainable Biosolutions Private Limited (SUSBIO)
|
|
Countries
|
US, Canada, Mexico, Germany, France, Spain, Italy, UK, Russia, China, India, Japan, South Korea, Australia, South East Asia, Brazil, Argentina, Middle East, Africa
|
Water Treatment Systems Market Segmentation
By Type of Water Treatment System
- Point-of-Use (POU) Systems
- Under-sink filters
- Countertop filters
- Faucet-mounted filters
- Water pitchers
- Point-of-Entry (POE) Systems
- Whole-house filtration systems
- Water softeners
- UV purification systems
- Reverse Osmosis (RO) Systems
- Ultrafiltration (UF) Systems
- Distillation Systems
- Disinfection Systems
- Membrane Filtration Systems
By Application
- Residential
- Commercial
- Industrial
- Municipal
By Technology
- Filtration
- Membrane Technology
- Distillation
- Ion Exchange
- Electrodialysis
- Electrochlorination
By Sales Channel
- Online Retail
- Offline Retail
- Direct Sales
By Price Range
- Economy/Low-Cost Systems
- Mid-Range Systems
- Premium Systems
- North America (US, Canada, Mexico)
- Europe (Germany, UK, France, Spain, Italy, Russia, Rest of Europe)
- Asia Pacific (China, India, Japan, South Korea, Australia, South East Asia, Rest of Asia)
- South America (Brazil, Argentina, Rest of South America)
- Middle East and Africa (Saudi Arabia, UAE, Rest of Middle East, South Africa, Egypt, Rest of Africa)
Top Companies in Water Treatment Systems Market
- Veolia
- Xylem Inc.
- Ecolab
- SUEZ
- DuPont
- Pentair
- Kurita Water Industries
- Thermax Limited
- VA Tech Wabag
- Ion Exchange India Ltd.
- Aquatech International LLC
- Calgon Carbon
- Toshiba Water Solutions
- Larsen & Toubro (L&T) - Water & Effluent Treatment
- Sustainable Biosolutions Private Limited (SUSBIO)
* List Not Exhaustive
Research Coverage
This report investigates the global Water Treatment Systems Market with a strong emphasis on the breakthroughs, strategic shifts, and technology advancements reshaping the industry. Developed by USDAnalytics, this report delivers in-depth analysis reviews of market dynamics, mergers and acquisitions, digital transformation trends, and regulatory-driven opportunities that are driving substantial investment across municipal, industrial, and residential applications. It highlights how urbanization, water scarcity, infrastructure renewal, and digitalization converge to transform the competitive landscape, while also spotlighting case studies of leading innovators and region-specific growth strategies. From the adoption of membrane-based purification to the acceleration of smart IoT-enabled treatment systems, this report is an essential resource for decision-makers, engineers, utilities, and corporate strategists seeking authoritative insights into one of the most critical industries of the 21st century.
Scope Includes:
- Segmentation: Market share analysis by type of system, application, technology, sales channel, and price range
- Geographic Scope: Analysis spans 25+ countries across North America, Europe, Asia Pacific, Latin America, and the Middle East & Africa
- Timeframe: Historic data from 2021 to 2024 and forecast data from 2025 to 2034
- Companies: Profiles and competitive benchmarking of 15+ leading companies shaping the industry
Methodology
The research methodology adopted by USDAnalytics combines a blend of primary and secondary approaches to deliver reliable and actionable insights into the Water Treatment Systems Market. Primary research involved structured interviews with industry stakeholders, including utility managers, technology providers, regulators, and supply chain participants across multiple geographies. Secondary research leveraged government reports, regulatory databases, annual reports, technical publications, and academic papers to validate and enrich findings. Proprietary market modeling techniques were applied to forecast growth across different system types, applications, technologies, and price ranges. Data triangulation, sensitivity analysis, and scenario forecasting were used to ensure accuracy, while expert validation safeguarded the report’s credibility for use by industry professionals, policymakers, and corporate strategists.
Deliverables:
- Comprehensive Market Research Report (PDF and Excel) with detailed tables, charts, and interactive visualizations.
- Country-Specific Forecasts & Analysis.
- Segment-Wise Revenue Forecasts (2025–2034).
- Competitive Analysis, Benchmarking, and SWOT Profiles.
- Recent Developments & Innovation Tracker.
- Executive Summary & Analyst Commentary.
- Post-Purchase Analyst Support for Client-Specific Questions and Custom Data Requirements.
Table of Contents: Water Treatment Systems Market
1. Executive Summary
1.1. Market Highlights
1.2. Key Insights for Industry Professionals
1.3. Global Market Snapshot
2. Market Overview & Growth Projections (2025-2034)
2.1. Introduction to the Water Treatment Systems Market
2.2. Market Valuation and Growth Projections (2025-2034)
2.2.1. Current Market Size (2025): $42.1 Billion
2.2.2. Forecasted Market Size (2034): $76.1 Billion at 6.8% CAGR
2.3. Key Drivers of Market Growth
2.3.1. Urbanization Surge
2.3.2. Water Scarcity Pressure
2.3.3. Infrastructure Renewal
2.3.4. Digital Transformation
3. Market Analysis: Strategic Shifts, M&A Activity, and Technology Advancements
3.1. Overview of Market Dynamics
3.2. Strategic Alliances & M&A Activity
3.2.1. Solenis' Merger with NCH Corporation
3.2.2. Veolia's Acquisitions in Niche Markets
3.2.3. SUEZ's Concession and Acquisition Agreements
3.3. Product and Technology Innovation
3.3.1. Pentair's Everpure PFAS Reduction Systems
3.3.2. Xylem's Anaerobic Membrane Bioreactor
3.3.3. Digital Offerings (mySüdmo app)
3.4. Geographic Expansion and R&D Focus
4. Key Market Trends & Drivers
4.1. Rising Adoption of Smart Water Treatment Technologies
4.1.1. IoT and AI-based solutions
4.1.2. Digital Twin Technology
4.1.3. Residential and Commercial Digital Solutions
4.2. Stricter PFAS Regulations
4.2.1. Demand for Advanced Filtration Systems
4.2.2. Innovation in Ion Exchange Resins
4.2.3. Public Health and Economic Impact
4.3. Strategic Opportunities Driving Market Growth
4.3.1. Decentralized Water Treatment Solutions in Emerging Economies
4.3.2. Corporate-Driven Water Reuse and Circular Economy Models
4.3.3. Zero-Liquid Discharge (ZLD) Technologies
5. Market Share & Segmentation Insights
5.1. Market Share by Type of System
5.1.1. Point-of-Use (POU) Systems
5.1.2. Point-of-Entry (POE) Systems
5.2. Market Share by Application
5.2.1. Residential
5.2.2. Industrial
5.2.3. Commercial
5.3. Market Share by Technology
5.3.1. Membrane-Based Systems
5.3.2. Filter Technologies
5.3.3. Ion Exchange
5.4. Market Share by Sales Channel
5.4.1. Offline Retail
5.4.2. Online Retail
5.4.3. Direct Sales
5.5. Market Share by Price Range
5.5.1. Mid-Range Systems
5.5.2. Low-Cost Economy Systems
5.5.3. Premium Segment
6. Country Analysis & Regional Outlook
6.1. United States: Pioneering Advanced Technologies
6.2. India: Rapid Expansion of Water Infrastructure
6.3. Saudi Arabia: Strategic Investments in Desalination
6.4. China: Regulatory-Driven Market Growth
6.5. UAE: Middle East Hub for Large-Scale Projects
6.6. Israel: Innovation in Steam-Driven Reverse Osmosis
7. Water Treatment Systems Market Size Outlook by Region (2025-2034)
7.1. North America Water Treatment Systems Market Size Outlook to 2034
7.1.1. By Type of System
7.1.2. By Application
7.1.3. By Technology
7.1.4. By Sales Channel
7.1.5. By Price Range
7.2. Europe Water Treatment Systems Market Size Outlook to 2034
7.2.1. By Type of System
7.2.2. By Application
7.2.3. By Technology
7.2.4. By Sales Channel
7.2.5. By Price Range
7.3. Asia Pacific Water Treatment Systems Market Size Outlook to 2034
7.3.1. By Type of System
7.3.2. By Application
7.3.3. By Technology
7.3.4. By Sales Channel
7.3.5. By Price Range
7.4. South America Water Treatment Systems Market Size Outlook to 2034
7.4.1. By Type of System
7.4.2. By Application
7.4.3. By Technology
7.4.4. By Sales Channel
7.4.5. By Price Range
7.5. Middle East and Africa Water Treatment Systems Market Size Outlook to 2034
7.5.1. By Type of System
7.5.2. By Application
7.5.3. By Technology
7.5.4. By Sales Channel
7.5.5. By Price Range
8. Company Profiles: Leading Players in Water Treatment Systems Market
8.1. Veolia
8.2. Xylem Inc.
8.3. Ecolab
8.4. SUEZ
8.5. DuPont
8.6. Pentair
8.7. Kurita Water Industries
8.8. Thermax Limited
8.9. VA Tech Wabag
8.10. Ion Exchange India Ltd.
8.11. Aquatech International LLC
8.12. Calgon Carbon
8.13. Toshiba Water Solutions
8.14. Larsen & Toubro (L&T) - Water & Effluent Treatment
8.15. Sustainable Biosolutions Private Limited (SUSBIO)
9. Research Coverage & Methodology
9.1. Report Scope and Focus
9.2. Methodology: Data Collection & Analysis
9.3. Deliverables
10. Appendix
10.1. List of Tables
10.2. List of Figures
10.3. Abbreviations
